
|
|||||
|
 | |
| |
| |
| |
| |
| |
|
Gene: B2M |
Gene summary for B2M |
| Gene information | Species | Human | Gene symbol | B2M | Gene ID | 567 |
| Gene name | beta-2-microglobulin | |
| Gene Alias | IMD43 | |
| Cytomap | 15q21.1 | |
| Gene Type | protein-coding | GO ID | GO:0000041 | UniProtAcc | P61769 |
Top |
Malignant transformation analysis |
| Identification of the aberrant gene expression in precancerous and cancerous lesions by comparing the gene expression of stem-like cells in diseased tissues with normal stem cells |
| Entrez ID | Symbol | Replicates | Species | Organ | Tissue | Adj P-value | Log2FC | Malignancy |
| 567 | B2M | GSM4909282 | Human | Breast | IDC | 4.65e-17 | 2.48e-01 | -0.0288 |
| 567 | B2M | GSM4909285 | Human | Breast | IDC | 6.83e-38 | -4.84e-01 | 0.21 |
| 567 | B2M | GSM4909286 | Human | Breast | IDC | 1.01e-107 | -1.68e+00 | 0.1081 |
| 567 | B2M | GSM4909290 | Human | Breast | IDC | 3.00e-02 | 2.15e-01 | 0.2096 |
| 567 | B2M | GSM4909291 | Human | Breast | IDC | 3.14e-18 | -4.32e-01 | 0.1753 |
| 567 | B2M | GSM4909292 | Human | Breast | IDC | 9.03e-03 | -4.29e-01 | 0.1236 |
| 567 | B2M | GSM4909294 | Human | Breast | IDC | 3.18e-20 | -6.69e-01 | 0.2022 |
| 567 | B2M | GSM4909298 | Human | Breast | IDC | 1.59e-23 | -4.86e-01 | 0.1551 |
| 567 | B2M | GSM4909299 | Human | Breast | IDC | 6.75e-06 | 1.66e-01 | 0.035 |
| 567 | B2M | GSM4909300 | Human | Breast | IDC | 8.22e-05 | 2.80e-01 | 0.0334 |
| 567 | B2M | GSM4909301 | Human | Breast | IDC | 1.50e-37 | -6.45e-01 | 0.1577 |
| 567 | B2M | GSM4909303 | Human | Breast | IDC | 3.70e-02 | -3.12e-01 | 0.0438 |
| 567 | B2M | GSM4909304 | Human | Breast | IDC | 5.17e-52 | -6.58e-01 | 0.1636 |
| 567 | B2M | GSM4909306 | Human | Breast | IDC | 2.55e-09 | -1.52e-01 | 0.1564 |
| 567 | B2M | GSM4909307 | Human | Breast | IDC | 3.26e-15 | 2.34e-01 | 0.1569 |
| 567 | B2M | GSM4909308 | Human | Breast | IDC | 4.74e-18 | 3.16e-01 | 0.158 |
| 567 | B2M | GSM4909309 | Human | Breast | IDC | 5.35e-16 | 3.20e-01 | 0.0483 |
| 567 | B2M | GSM4909311 | Human | Breast | IDC | 1.91e-41 | -9.88e-01 | 0.1534 |
| 567 | B2M | GSM4909312 | Human | Breast | IDC | 2.90e-57 | -1.10e+00 | 0.1552 |
| 567 | B2M | GSM4909315 | Human | Breast | IDC | 1.42e-29 | -6.90e-01 | 0.21 |
| Page: 1 2 3 4 5 6 7 8 9 10 11 12 13 14 15 16 17 18 19 20 21 |
| Tissue | Expression Dynamics | Abbreviation |
| Breast | 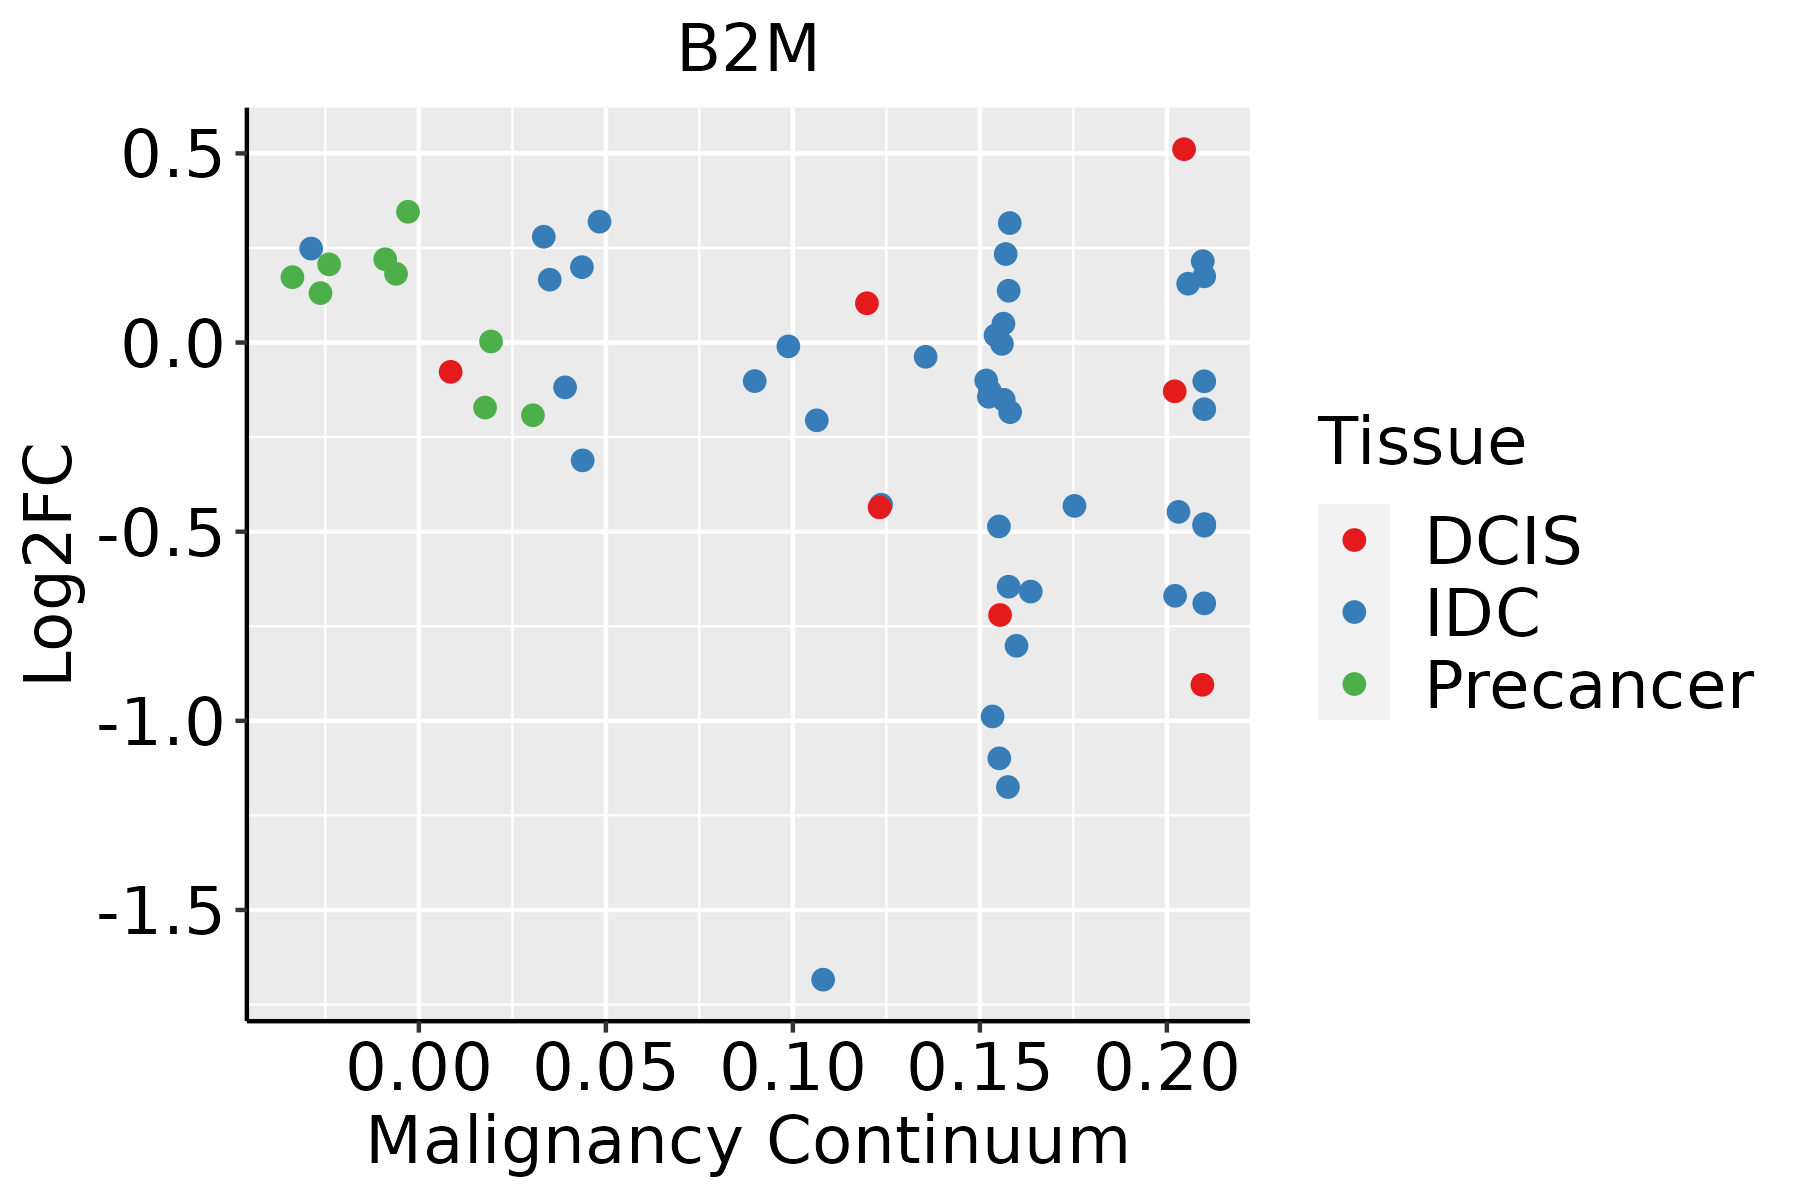 | IDC: Invasive ductal carcinoma |
| DCIS: Ductal carcinoma in situ | ||
| Precancer(BRCA1-mut): Precancerous lesion from BRCA1 mutation carriers | ||
| Cervix | 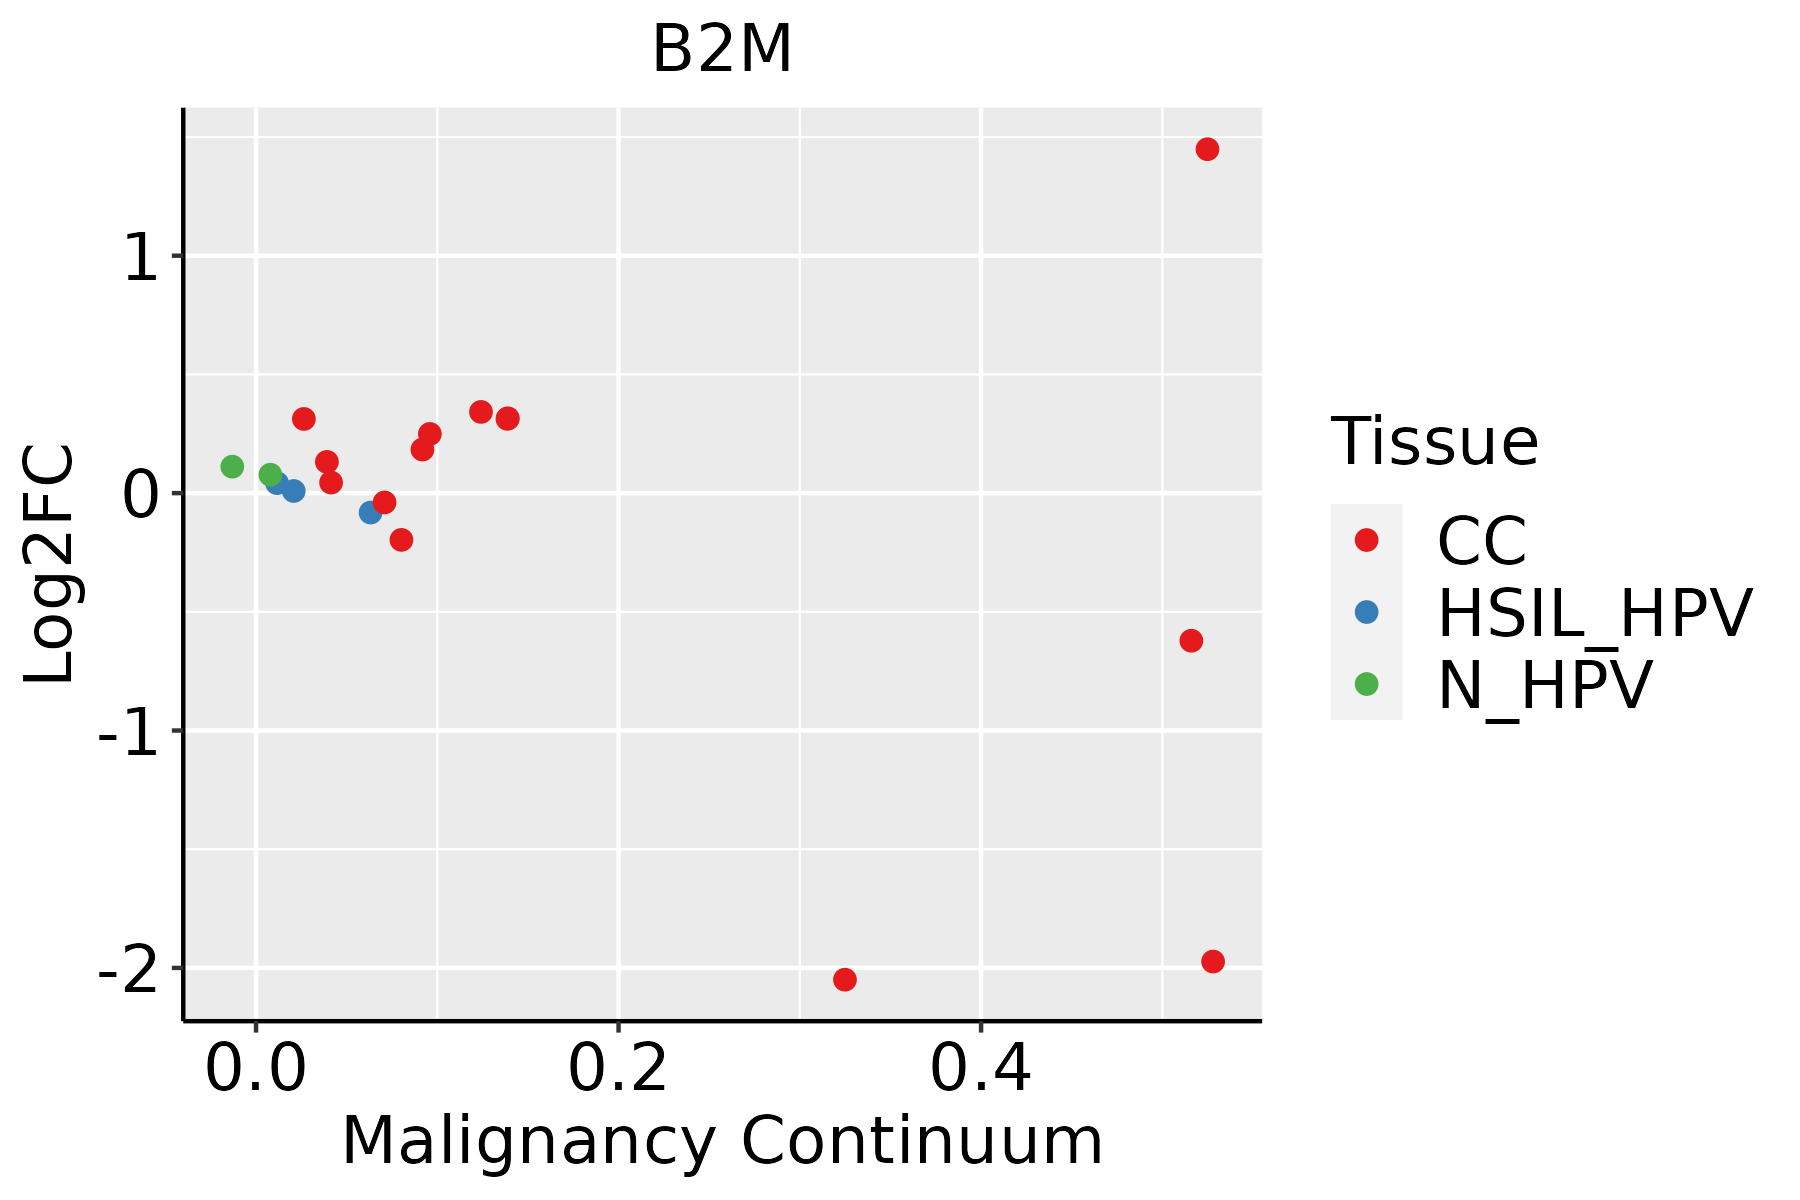 | CC: Cervix cancer |
| HSIL_HPV: HPV-infected high-grade squamous intraepithelial lesions | ||
| N_HPV: HPV-infected normal cervix | ||
| Colorectum (GSE201348) |  | FAP: Familial adenomatous polyposis |
| CRC: Colorectal cancer | ||
| Colorectum (HTA11) |  | AD: Adenomas |
| SER: Sessile serrated lesions | ||
| MSI-H: Microsatellite-high colorectal cancer | ||
| MSS: Microsatellite stable colorectal cancer | ||
| Endometrium | 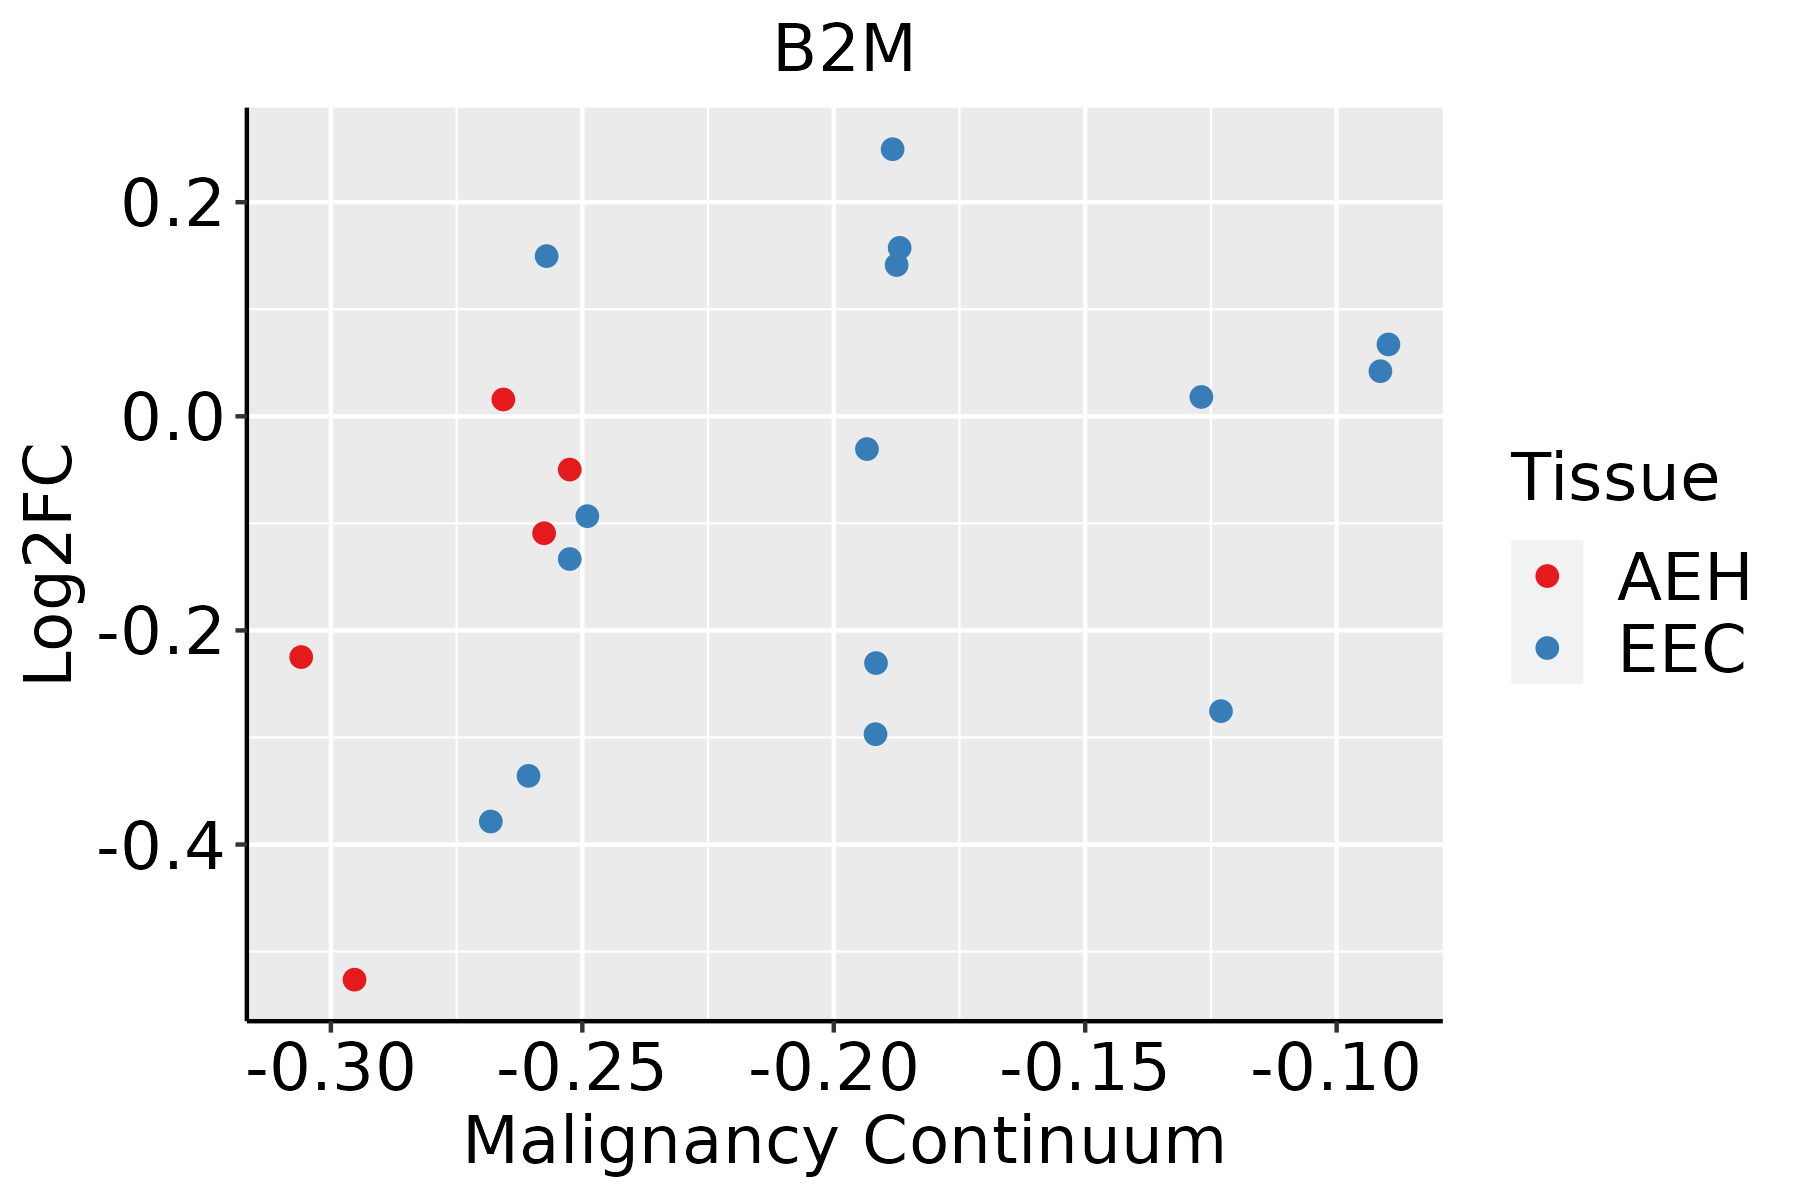 | AEH: Atypical endometrial hyperplasia |
| EEC: Endometrioid Cancer | ||
| Esophagus | 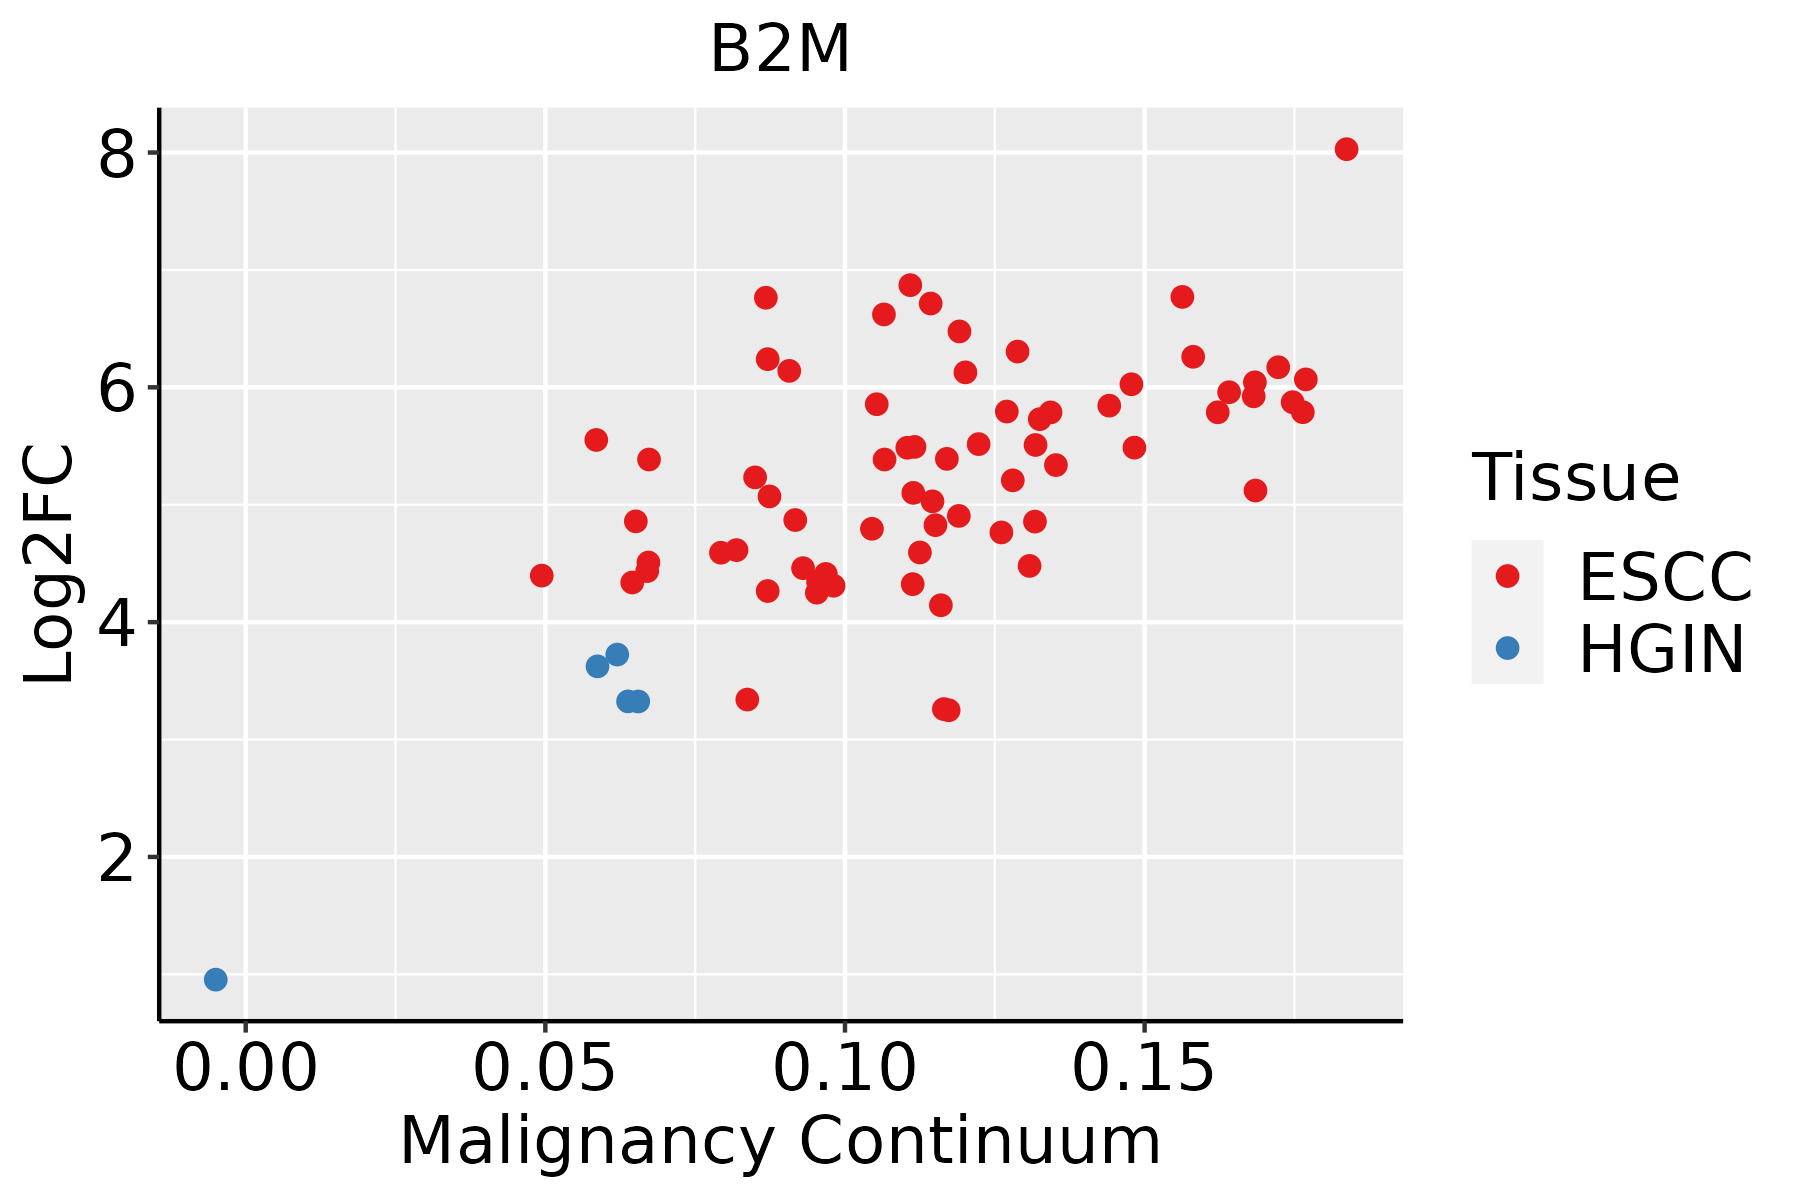 | ESCC: Esophageal squamous cell carcinoma |
| HGIN: High-grade intraepithelial neoplasias | ||
| LGIN: Low-grade intraepithelial neoplasias | ||
| GC | 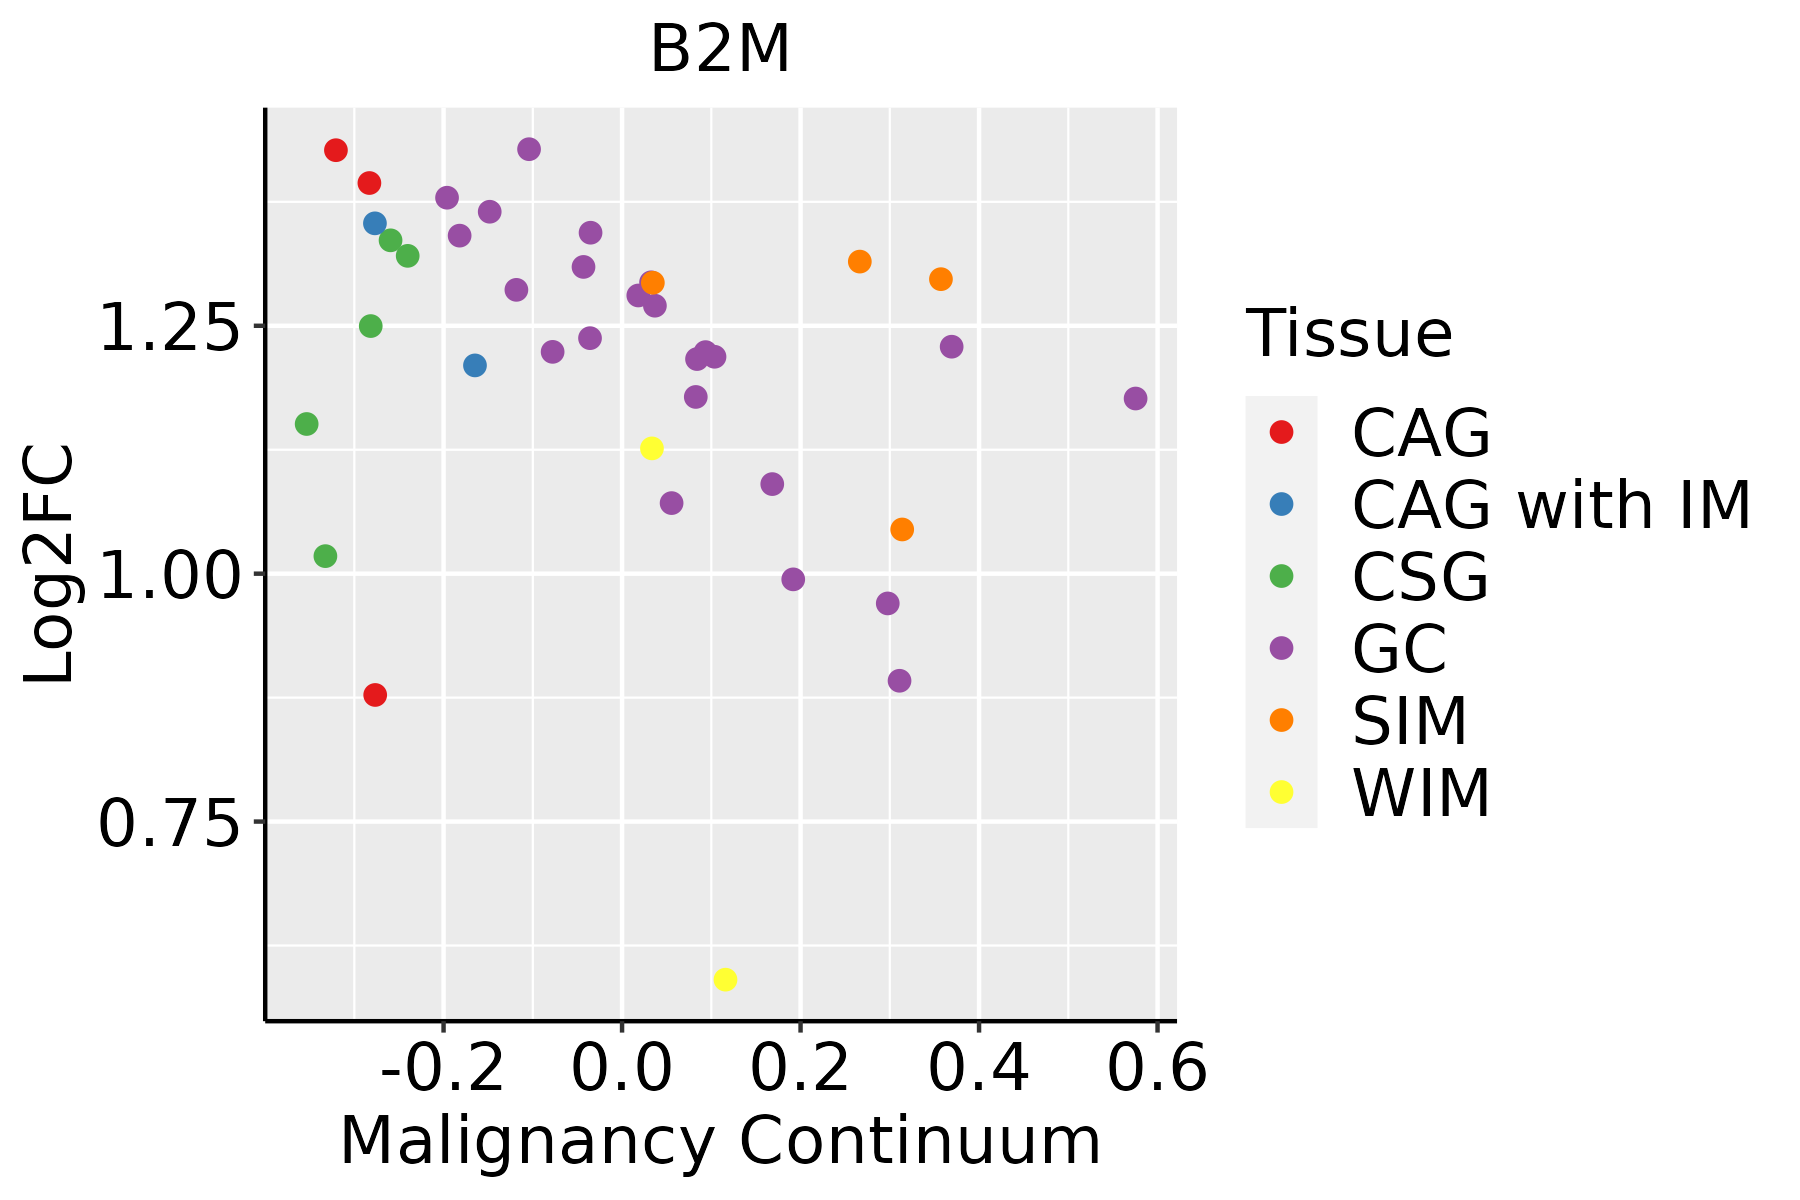 | CAG: Chronic atrophic gastritis |
| CAG with IM: Chronic atrophic gastritis with intestinal metaplasia | ||
| CSG: Chronic superficial gastritis | ||
| GC: Gastric cancer | ||
| SIM: Severe intestinal metaplasia | ||
| WIM: Wild intestinal metaplasia | ||
| Liver | 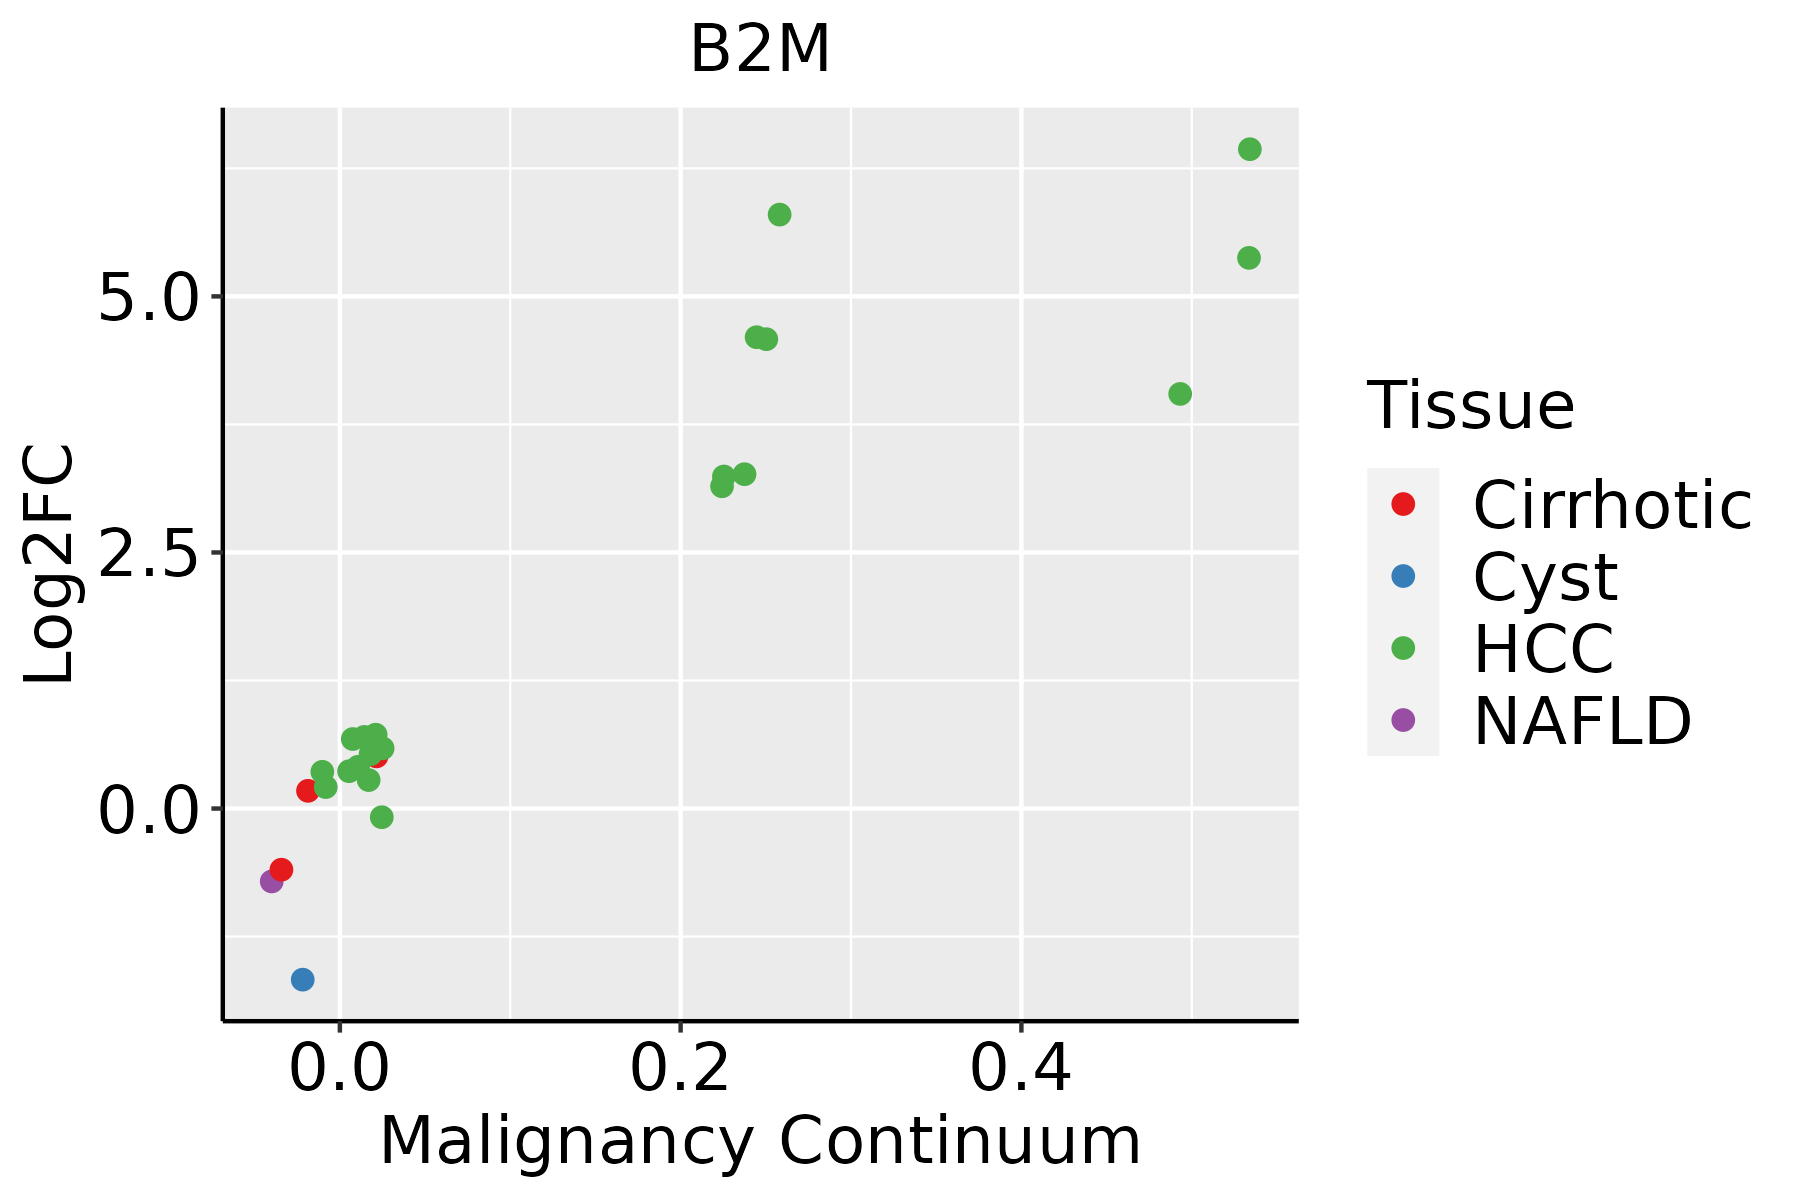 | HCC: Hepatocellular carcinoma |
| NAFLD: Non-alcoholic fatty liver disease | ||
| Lung | 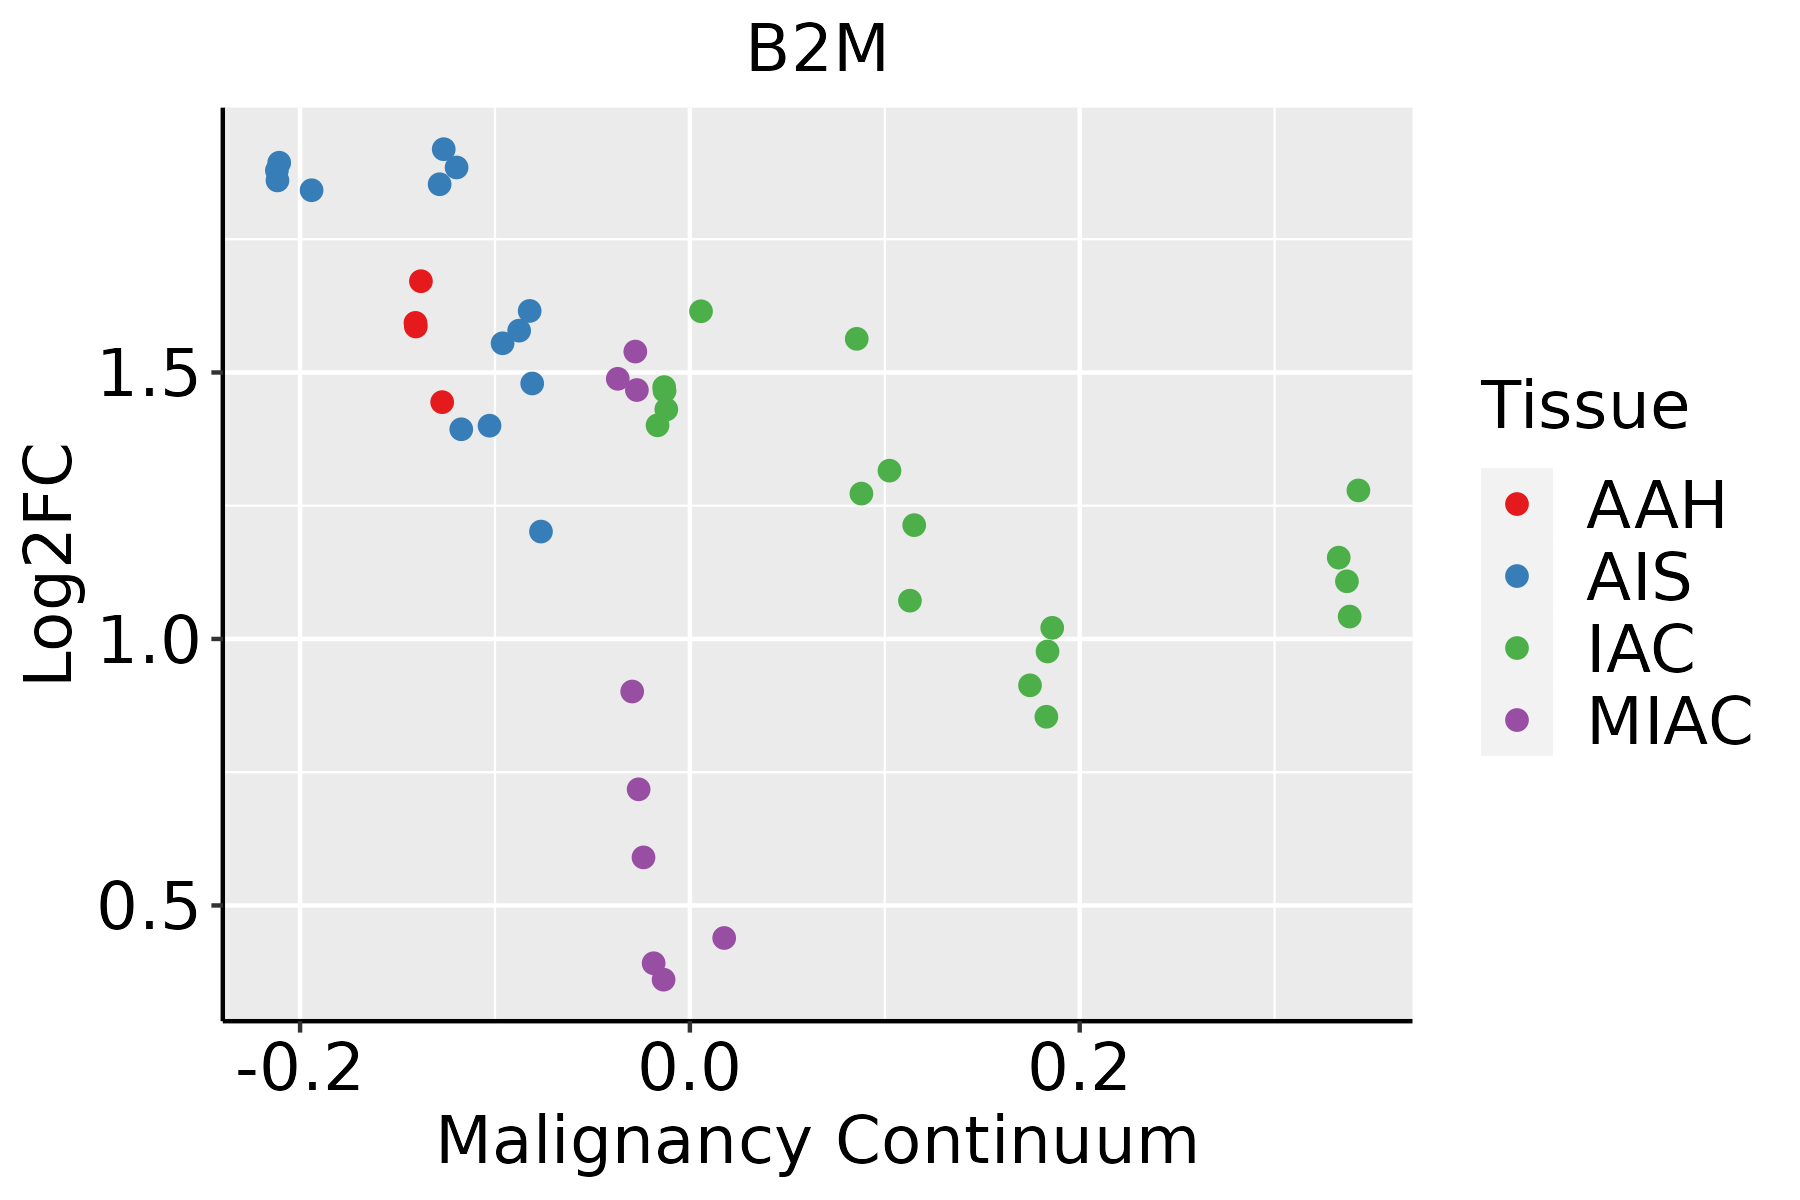 | AAH: Atypical adenomatous hyperplasia |
| AIS: Adenocarcinoma in situ | ||
| IAC: Invasive lung adenocarcinoma | ||
| MIA: Minimally invasive adenocarcinoma | ||
| Oral Cavity | 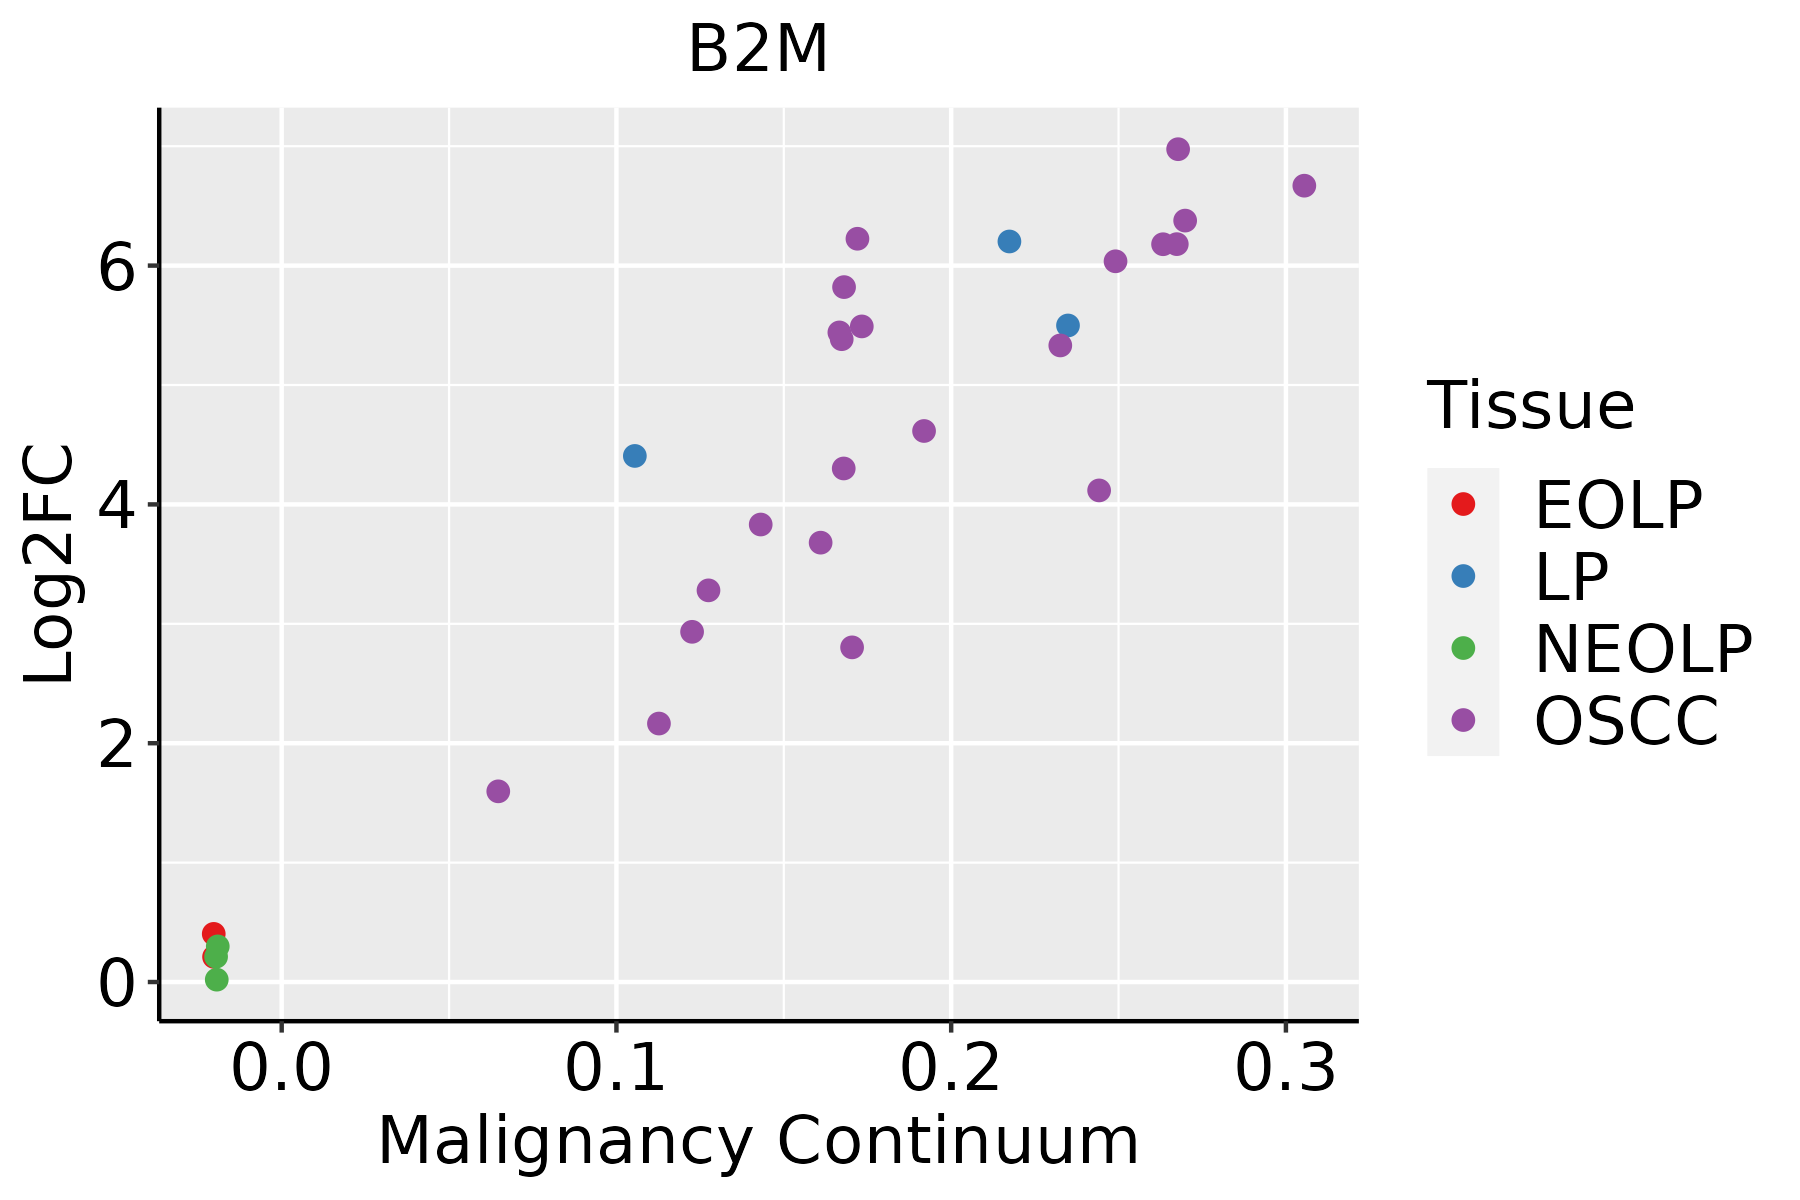 | EOLP: Erosive Oral lichen planus |
| LP: leukoplakia | ||
| NEOLP: Non-erosive oral lichen planus | ||
| OSCC: Oral squamous cell carcinoma | ||
| Prostate | 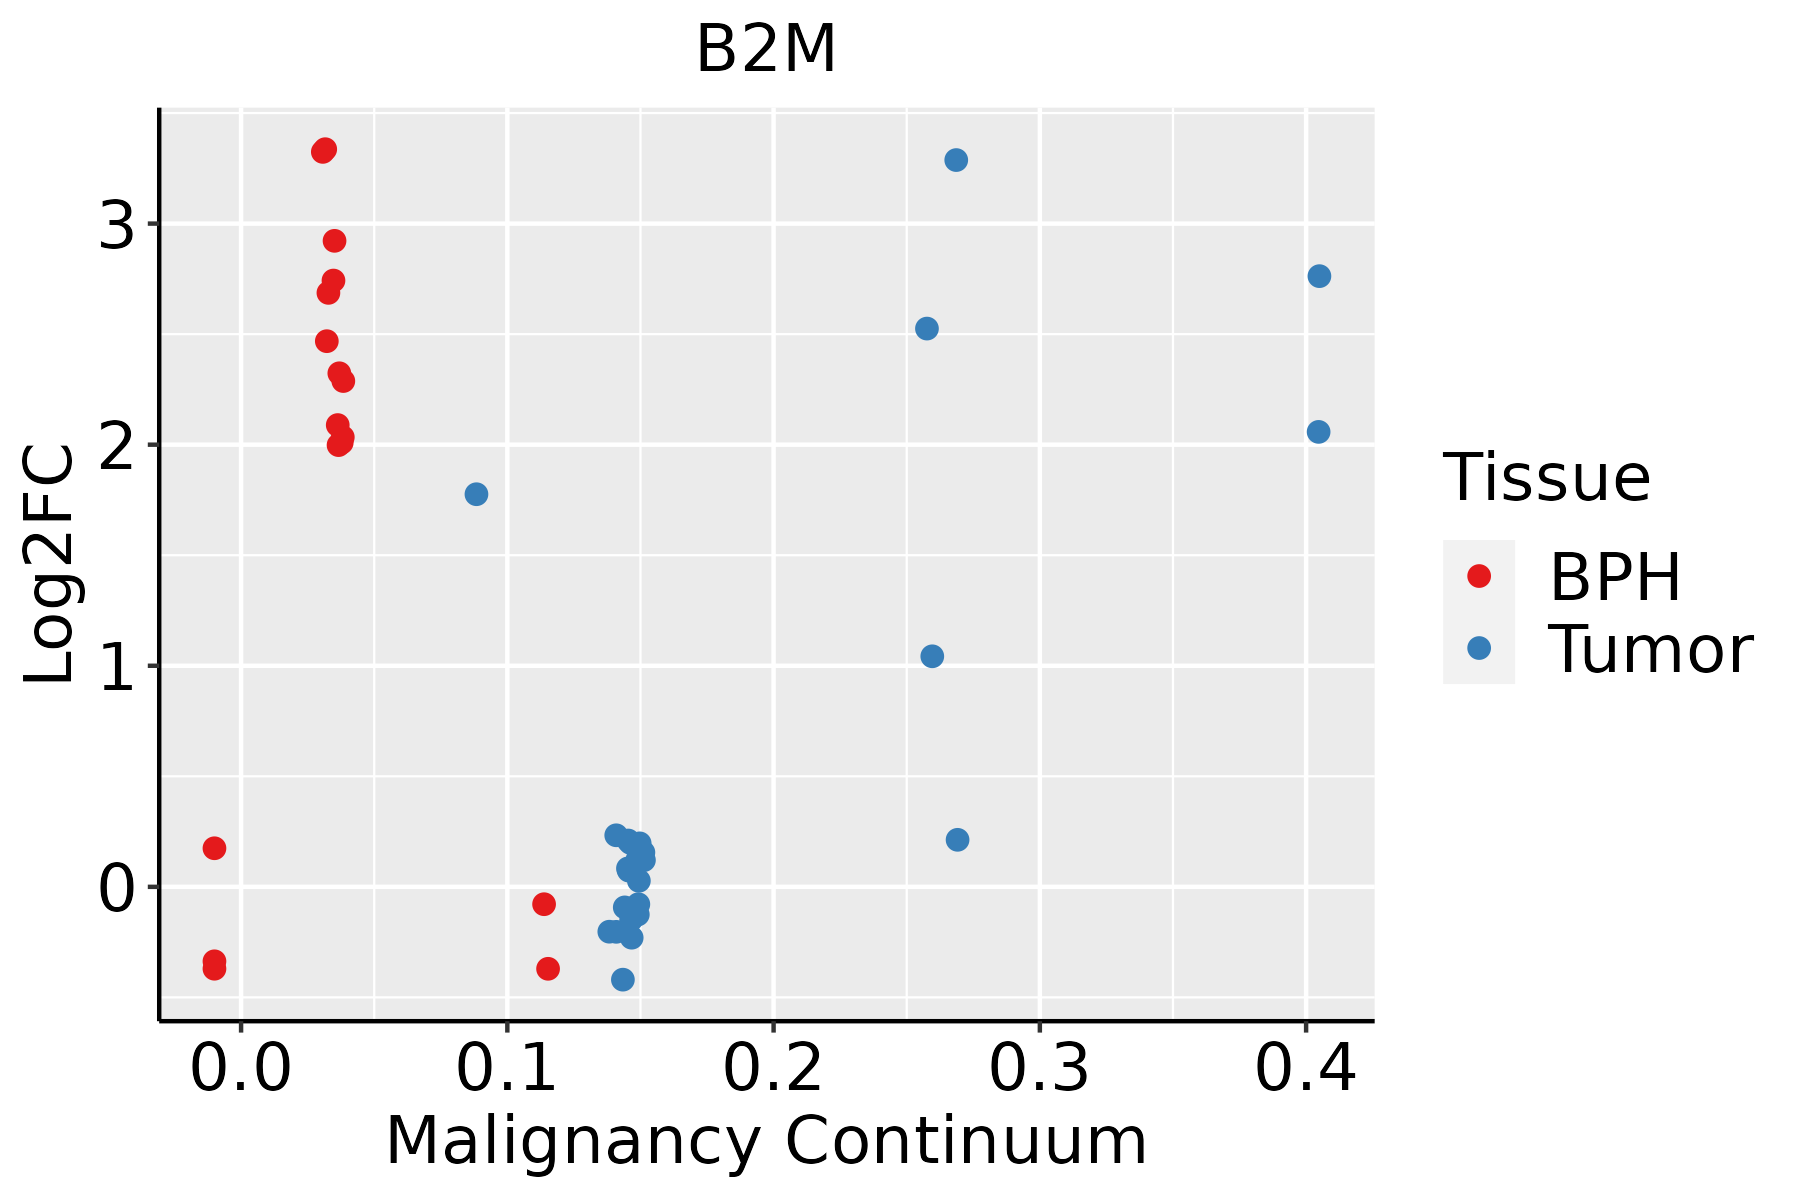 | BPH: Benign Prostatic Hyperplasia |
| Skin |  | AK: Actinic keratosis |
| cSCC: Cutaneous squamous cell carcinoma | ||
| SCCIS:squamous cell carcinoma in situ | ||
| Thyroid | 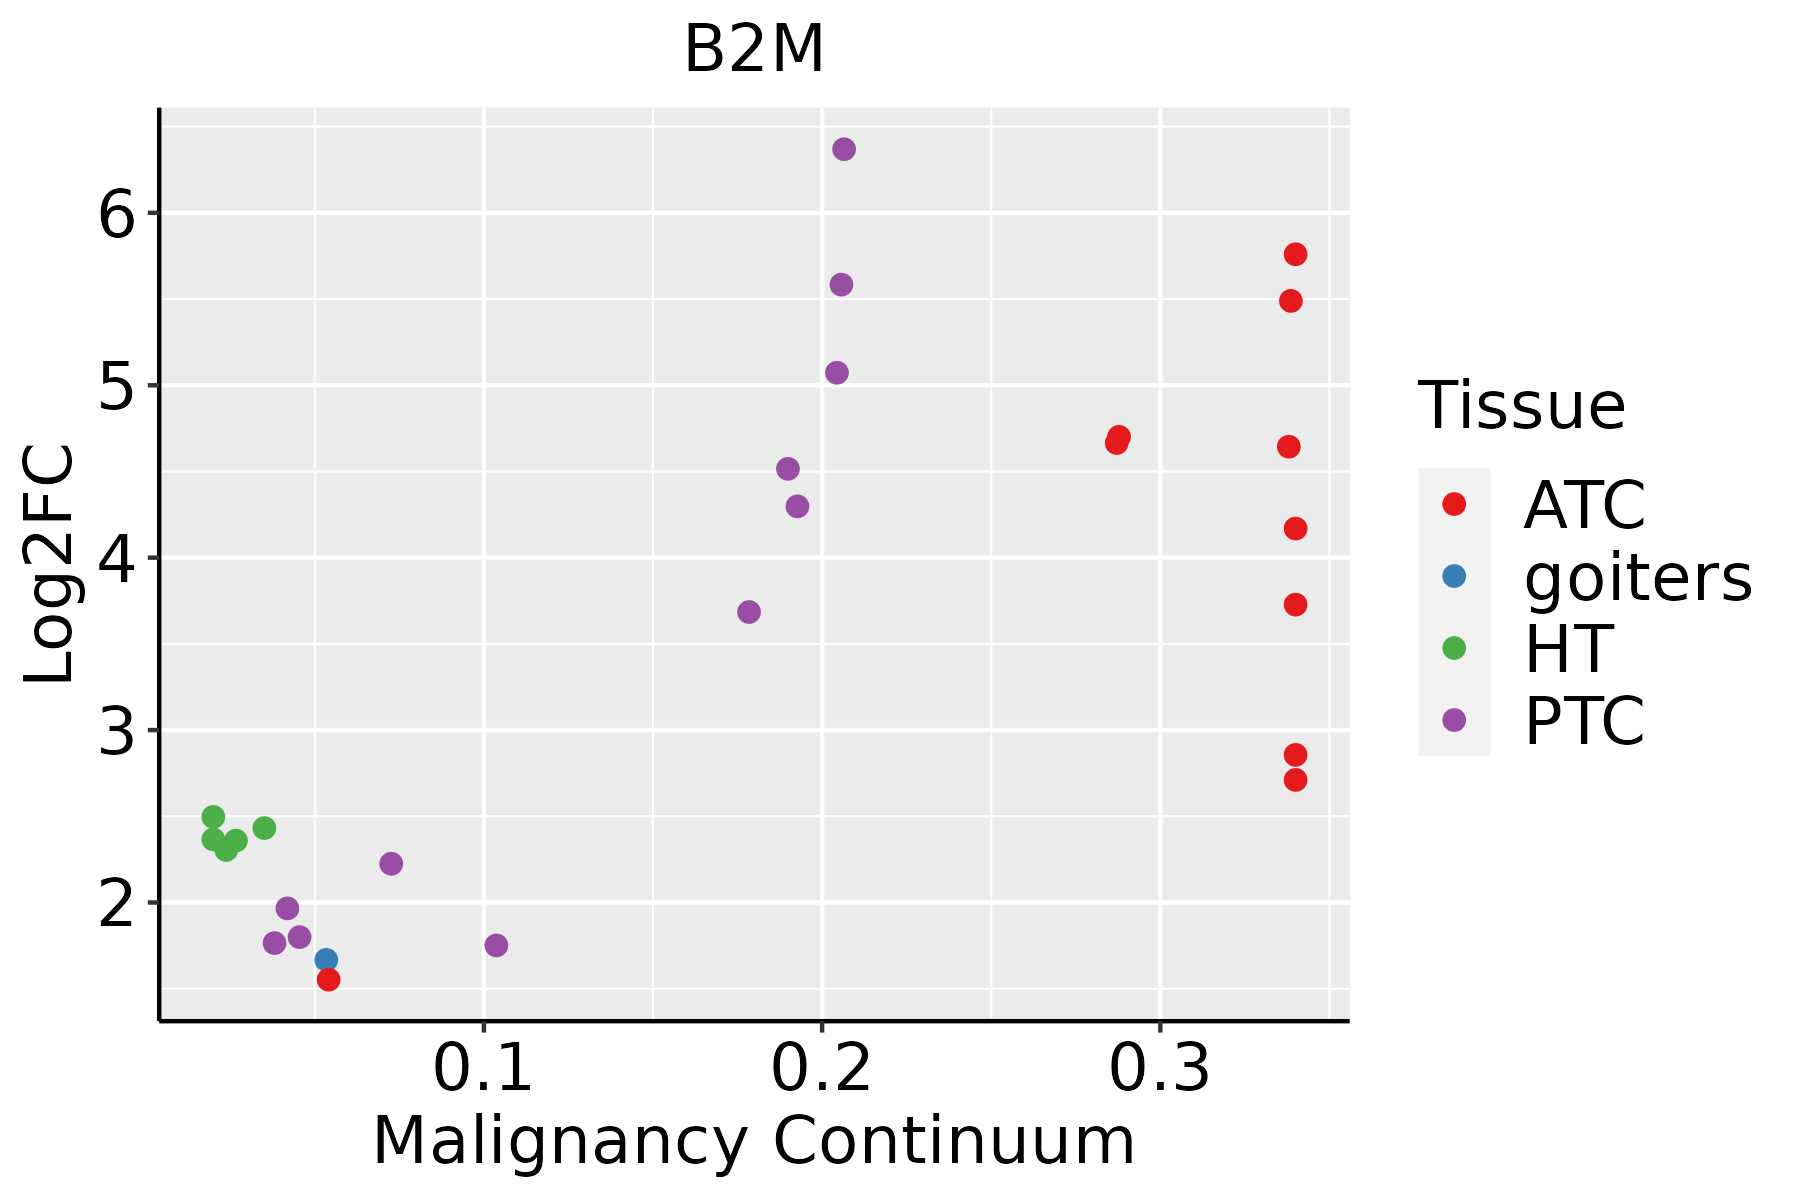 | ATC: Anaplastic thyroid cancer |
| HT: Hashimoto's thyroiditis | ||
| PTC: Papillary thyroid cancer |
| ∗log2FC in expression of this searched gene in stem-like cells from each diseased tissue sample relative to stem-like cells in normal samples in each tissue plotted against the malignancy continuum. Samples are colored based on if they are from different disease stage. |
Top |
Malignant transformation related pathway analysis |
| Find out the enriched GO biological processes and KEGG pathways involved in transition from healthy to precancer to cancer |
| Tissue | Disease Stage | Enriched GO biological Processes |
| Colorectum | AD |  |
| Colorectum | SER |  |
| Colorectum | MSS |  |
| Colorectum | MSI-H |  |
| Colorectum | FAP |  |
| ∗Top 15 enriched GO BP terms are showed in the bar plot of each disease state in each tissue. Each row represents a significant GO biological process which is colored according to the -log10(p.adjust). |
| Page: 1 2 3 4 5 6 7 8 9 |
| GO ID | Tissue | Disease Stage | Description | Gene Ratio | Bg Ratio | pvalue | p.adjust | Count |
| GO:0002711 | Stomach | CAG with IM | positive regulation of T cell mediated immunity | 9/1050 | 56/18723 | 3.72e-03 | 3.28e-02 | 9 |
| GO:00456464 | Stomach | CAG with IM | regulation of erythrocyte differentiation | 8/1050 | 47/18723 | 4.25e-03 | 3.60e-02 | 8 |
| GO:001095911 | Stomach | CAG with IM | regulation of metal ion transport | 36/1050 | 406/18723 | 4.52e-03 | 3.77e-02 | 36 |
| GO:005507611 | Stomach | CAG with IM | transition metal ion homeostasis | 16/1050 | 138/18723 | 4.60e-03 | 3.83e-02 | 16 |
| GO:000756811 | Stomach | CAG with IM | aging | 31/1050 | 339/18723 | 5.19e-03 | 4.17e-02 | 31 |
| GO:0001914 | Stomach | CAG with IM | regulation of T cell mediated cytotoxicity | 7/1050 | 39/18723 | 5.43e-03 | 4.29e-02 | 7 |
| GO:0002381 | Stomach | CAG with IM | immunoglobulin production involved in immunoglobulin-mediated immune response | 10/1050 | 70/18723 | 5.46e-03 | 4.30e-02 | 10 |
| GO:000645721 | Stomach | CSG | protein folding | 42/1034 | 212/18723 | 3.56e-13 | 1.26e-10 | 42 |
| GO:00480022 | Stomach | CSG | antigen processing and presentation of peptide antigen | 21/1034 | 62/18723 | 6.64e-12 | 1.85e-09 | 21 |
| GO:00198822 | Stomach | CSG | antigen processing and presentation | 25/1034 | 106/18723 | 4.65e-10 | 7.03e-08 | 25 |
| GO:00024782 | Stomach | CSG | antigen processing and presentation of exogenous peptide antigen | 15/1034 | 38/18723 | 5.72e-10 | 8.40e-08 | 15 |
| GO:00023962 | Stomach | CSG | MHC protein complex assembly | 11/1034 | 19/18723 | 6.95e-10 | 9.93e-08 | 11 |
| GO:00024952 | Stomach | CSG | antigen processing and presentation of peptide antigen via MHC class II | 14/1034 | 34/18723 | 1.11e-09 | 1.47e-07 | 14 |
| GO:00198842 | Stomach | CSG | antigen processing and presentation of exogenous antigen | 16/1034 | 47/18723 | 1.98e-09 | 2.47e-07 | 16 |
| GO:00198862 | Stomach | CSG | antigen processing and presentation of exogenous peptide antigen via MHC class II | 13/1034 | 30/18723 | 2.05e-09 | 2.47e-07 | 13 |
| GO:00025042 | Stomach | CSG | antigen processing and presentation of peptide or polysaccharide antigen via MHC class II | 14/1034 | 36/18723 | 2.72e-09 | 3.07e-07 | 14 |
| GO:00025012 | Stomach | CSG | peptide antigen assembly with MHC protein complex | 10/1034 | 18/18723 | 7.37e-09 | 7.09e-07 | 10 |
| GO:000189421 | Stomach | CSG | tissue homeostasis | 40/1034 | 268/18723 | 9.33e-09 | 8.66e-07 | 40 |
| GO:004202621 | Stomach | CSG | protein refolding | 11/1034 | 23/18723 | 1.01e-08 | 9.08e-07 | 11 |
| GO:006024921 | Stomach | CSG | anatomical structure homeostasis | 44/1034 | 314/18723 | 1.22e-08 | 1.06e-06 | 44 |
| Page: 1 2 3 4 5 6 7 8 9 10 11 12 13 14 15 16 17 18 19 20 21 22 23 24 25 26 27 28 29 30 31 32 33 34 35 36 37 38 39 40 41 42 43 44 45 46 47 48 49 50 51 52 53 54 55 56 57 58 59 60 61 62 63 64 65 66 67 68 69 70 71 72 73 74 75 76 77 78 79 80 81 82 83 84 85 86 87 88 89 90 91 92 93 94 95 96 97 98 99 100 101 102 103 104 105 106 107 108 109 110 111 112 113 |
| Pathway ID | Tissue | Disease Stage | Description | Gene Ratio | Bg Ratio | pvalue | p.adjust | qvalue | Count |
| hsa0461218 | Breast | Precancer | Antigen processing and presentation | 19/684 | 78/8465 | 9.61e-06 | 1.12e-04 | 8.62e-05 | 19 |
| hsa0516918 | Breast | Precancer | Epstein-Barr virus infection | 35/684 | 202/8465 | 1.15e-05 | 1.26e-04 | 9.64e-05 | 35 |
| hsa0516618 | Breast | Precancer | Human T-cell leukemia virus 1 infection | 33/684 | 222/8465 | 4.29e-04 | 3.31e-03 | 2.53e-03 | 33 |
| hsa0516316 | Breast | Precancer | Human cytomegalovirus infection | 32/684 | 225/8465 | 1.13e-03 | 7.57e-03 | 5.80e-03 | 32 |
| hsa0461219 | Breast | Precancer | Antigen processing and presentation | 19/684 | 78/8465 | 9.61e-06 | 1.12e-04 | 8.62e-05 | 19 |
| hsa0516919 | Breast | Precancer | Epstein-Barr virus infection | 35/684 | 202/8465 | 1.15e-05 | 1.26e-04 | 9.64e-05 | 35 |
| hsa0516619 | Breast | Precancer | Human T-cell leukemia virus 1 infection | 33/684 | 222/8465 | 4.29e-04 | 3.31e-03 | 2.53e-03 | 33 |
| hsa0516317 | Breast | Precancer | Human cytomegalovirus infection | 32/684 | 225/8465 | 1.13e-03 | 7.57e-03 | 5.80e-03 | 32 |
| hsa0516922 | Breast | IDC | Epstein-Barr virus infection | 45/867 | 202/8465 | 3.16e-07 | 6.05e-06 | 4.52e-06 | 45 |
| hsa0461223 | Breast | IDC | Antigen processing and presentation | 24/867 | 78/8465 | 4.61e-07 | 8.33e-06 | 6.23e-06 | 24 |
| hsa0516624 | Breast | IDC | Human T-cell leukemia virus 1 infection | 40/867 | 222/8465 | 2.52e-04 | 2.21e-03 | 1.66e-03 | 40 |
| hsa0516324 | Breast | IDC | Human cytomegalovirus infection | 39/867 | 225/8465 | 6.66e-04 | 5.41e-03 | 4.05e-03 | 39 |
| hsa0517014 | Breast | IDC | Human immunodeficiency virus 1 infection | 33/867 | 212/8465 | 9.28e-03 | 4.37e-02 | 3.27e-02 | 33 |
| hsa0516932 | Breast | IDC | Epstein-Barr virus infection | 45/867 | 202/8465 | 3.16e-07 | 6.05e-06 | 4.52e-06 | 45 |
| hsa0461233 | Breast | IDC | Antigen processing and presentation | 24/867 | 78/8465 | 4.61e-07 | 8.33e-06 | 6.23e-06 | 24 |
| hsa0516634 | Breast | IDC | Human T-cell leukemia virus 1 infection | 40/867 | 222/8465 | 2.52e-04 | 2.21e-03 | 1.66e-03 | 40 |
| hsa0516334 | Breast | IDC | Human cytomegalovirus infection | 39/867 | 225/8465 | 6.66e-04 | 5.41e-03 | 4.05e-03 | 39 |
| hsa0517015 | Breast | IDC | Human immunodeficiency virus 1 infection | 33/867 | 212/8465 | 9.28e-03 | 4.37e-02 | 3.27e-02 | 33 |
| hsa0516642 | Breast | DCIS | Human T-cell leukemia virus 1 infection | 41/846 | 222/8465 | 7.03e-05 | 6.88e-04 | 5.07e-04 | 41 |
| hsa0516344 | Breast | DCIS | Human cytomegalovirus infection | 38/846 | 225/8465 | 8.11e-04 | 5.95e-03 | 4.38e-03 | 38 |
| Page: 1 2 3 4 5 6 7 8 |
Top |
Cell-cell communication analysis |
| Identification of potential cell-cell interactions between two cell types and their ligand-receptor pairs for different disease states |
| Ligand | Receptor | LRpair | Pathway | Tissue | Disease Stage |
| Page: 1 |
Top |
Single-cell gene regulatory network inference analysis |
| Find out the significant the regulons (TFs) and the target genes of each regulon across cell types for different disease states |
| TF | Cell Type | Tissue | Disease Stage | Target Gene | RSS | Regulon Activity |
| ∗The dot plots of a searched regulon are shown for all cell subpopulations in each disease state of each tissue based on the regulon specific score inferred using pySCENIC and by calculating the average expression. |
| Page: 1 |
Top |
Somatic mutation of malignant transformation related genes |
| Annotation of somatic variants for genes involved in malignant transformation |
| Hugo Symbol | Variant Class | Variant Classification | dbSNP RS | HGVSc | HGVSp | HGVSp Short | SWISSPROT | BIOTYPE | SIFT | PolyPhen | Tumor Sample Barcode | Tissue | Histology | Sex | Age | Stage | Therapy Types | Drugs | Outcome |
| B2M | SNV | Missense_Mutation | rs765817584 | c.7N>T | p.Arg3Cys | p.R3C | P61769 | protein_coding | deleterious(0.01) | possibly_damaging(0.549) | TCGA-AR-A0TX-01 | Breast | breast invasive carcinoma | Female | <65 | I/II | Unknown | Unknown | SD |
| B2M | SNV | Missense_Mutation | c.43C>T | p.Leu15Phe | p.L15F | P61769 | protein_coding | deleterious(0.01) | benign(0.088) | TCGA-E2-A10C-01 | Breast | breast invasive carcinoma | Female | <65 | I/II | Chemotherapy | cytoxan | SD | |
| B2M | SNV | Missense_Mutation | c.248N>T | p.Tyr83Phe | p.Y83F | P61769 | protein_coding | deleterious(0.02) | probably_damaging(0.947) | TCGA-E9-A248-01 | Breast | breast invasive carcinoma | Female | <65 | I/II | Chemotherapy | cyclophosphamide | SD | |
| B2M | SNV | Missense_Mutation | c.280G>A | p.Glu94Lys | p.E94K | P61769 | protein_coding | tolerated(0.79) | benign(0.024) | TCGA-DR-A0ZM-01 | Cervix | cervical & endocervical cancer | Female | <65 | III/IV | Unspecific | Cisplatin | SD | |
| B2M | SNV | Missense_Mutation | novel | c.251N>G | p.Leu84Arg | p.L84R | P61769 | protein_coding | tolerated(0.34) | benign(0.354) | TCGA-CA-6717-01 | Colorectum | colon adenocarcinoma | Male | <65 | I/II | Chemotherapy | oxaliplatin | CR |
| B2M | SNV | Missense_Mutation | rs752758095 | c.38T>C | p.Leu13Pro | p.L13P | P61769 | protein_coding | deleterious(0.02) | possibly_damaging(0.466) | TCGA-CK-5913-01 | Colorectum | colon adenocarcinoma | Female | <65 | I/II | Unknown | Unknown | SD |
| B2M | SNV | Missense_Mutation | c.35N>C | p.Leu12Pro | p.L12P | P61769 | protein_coding | deleterious(0) | probably_damaging(0.998) | TCGA-F4-6703-01 | Colorectum | colon adenocarcinoma | Male | <65 | I/II | Unknown | Unknown | SD | |
| B2M | SNV | Missense_Mutation | c.88T>C | p.Tyr30His | p.Y30H | P61769 | protein_coding | deleterious(0) | probably_damaging(1) | TCGA-AG-3892-01 | Colorectum | rectum adenocarcinoma | Female | <65 | I/II | Unknown | Unknown | SD | |
| B2M | SNV | Missense_Mutation | novel | c.228C>A | p.Phe76Leu | p.F76L | P61769 | protein_coding | deleterious(0) | probably_damaging(0.998) | TCGA-AG-3892-01 | Colorectum | rectum adenocarcinoma | Female | <65 | I/II | Unknown | Unknown | SD |
| B2M | deletion | Frame_Shift_Del | c.293delA | p.Tyr98LeufsTer5 | p.Y98Lfs*5 | P61769 | protein_coding | TCGA-5M-AAT6-01 | Colorectum | colon adenocarcinoma | Female | <65 | III/IV | Unknown | Unknown | PD |
| Page: 1 2 3 4 5 |
Top |
Related drugs of malignant transformation related genes |
| Identification of chemicals and drugs interact with genes involved in malignant transfromation |
| (DGIdb 4.0) |
| Entrez ID | Symbol | Category | Interaction Types | Drug Claim Name | Drug Name | PMIDs |
| 567 | B2M | CLINICALLY ACTIONABLE, DRUGGABLE GENOME, EXTERNAL SIDE OF PLASMA MEMBRANE, DRUG RESISTANCE | AMIKACIN | AMIKACIN | 7672871 | |
| 567 | B2M | CLINICALLY ACTIONABLE, DRUGGABLE GENOME, EXTERNAL SIDE OF PLASMA MEMBRANE, DRUG RESISTANCE | PEMBROLIZUMAB | PEMBROLIZUMAB | 27433843 | |
| 567 | B2M | CLINICALLY ACTIONABLE, DRUGGABLE GENOME, EXTERNAL SIDE OF PLASMA MEMBRANE, DRUG RESISTANCE | THYROGLOBULIN | THYROGLOBULIN | 9609129 |
| Page: 1 |

Copyright 2023-Present -The University of Texas Health Science Center at Houston |