| Tissue | Expression Dynamics | Abbreviation |
| Colorectum (GSE201348) |  | FAP: Familial adenomatous polyposis |
| CRC: Colorectal cancer |
| Colorectum (HTA11) |  | AD: Adenomas |
| SER: Sessile serrated lesions |
| MSI-H: Microsatellite-high colorectal cancer |
| MSS: Microsatellite stable colorectal cancer |
| Esophagus | 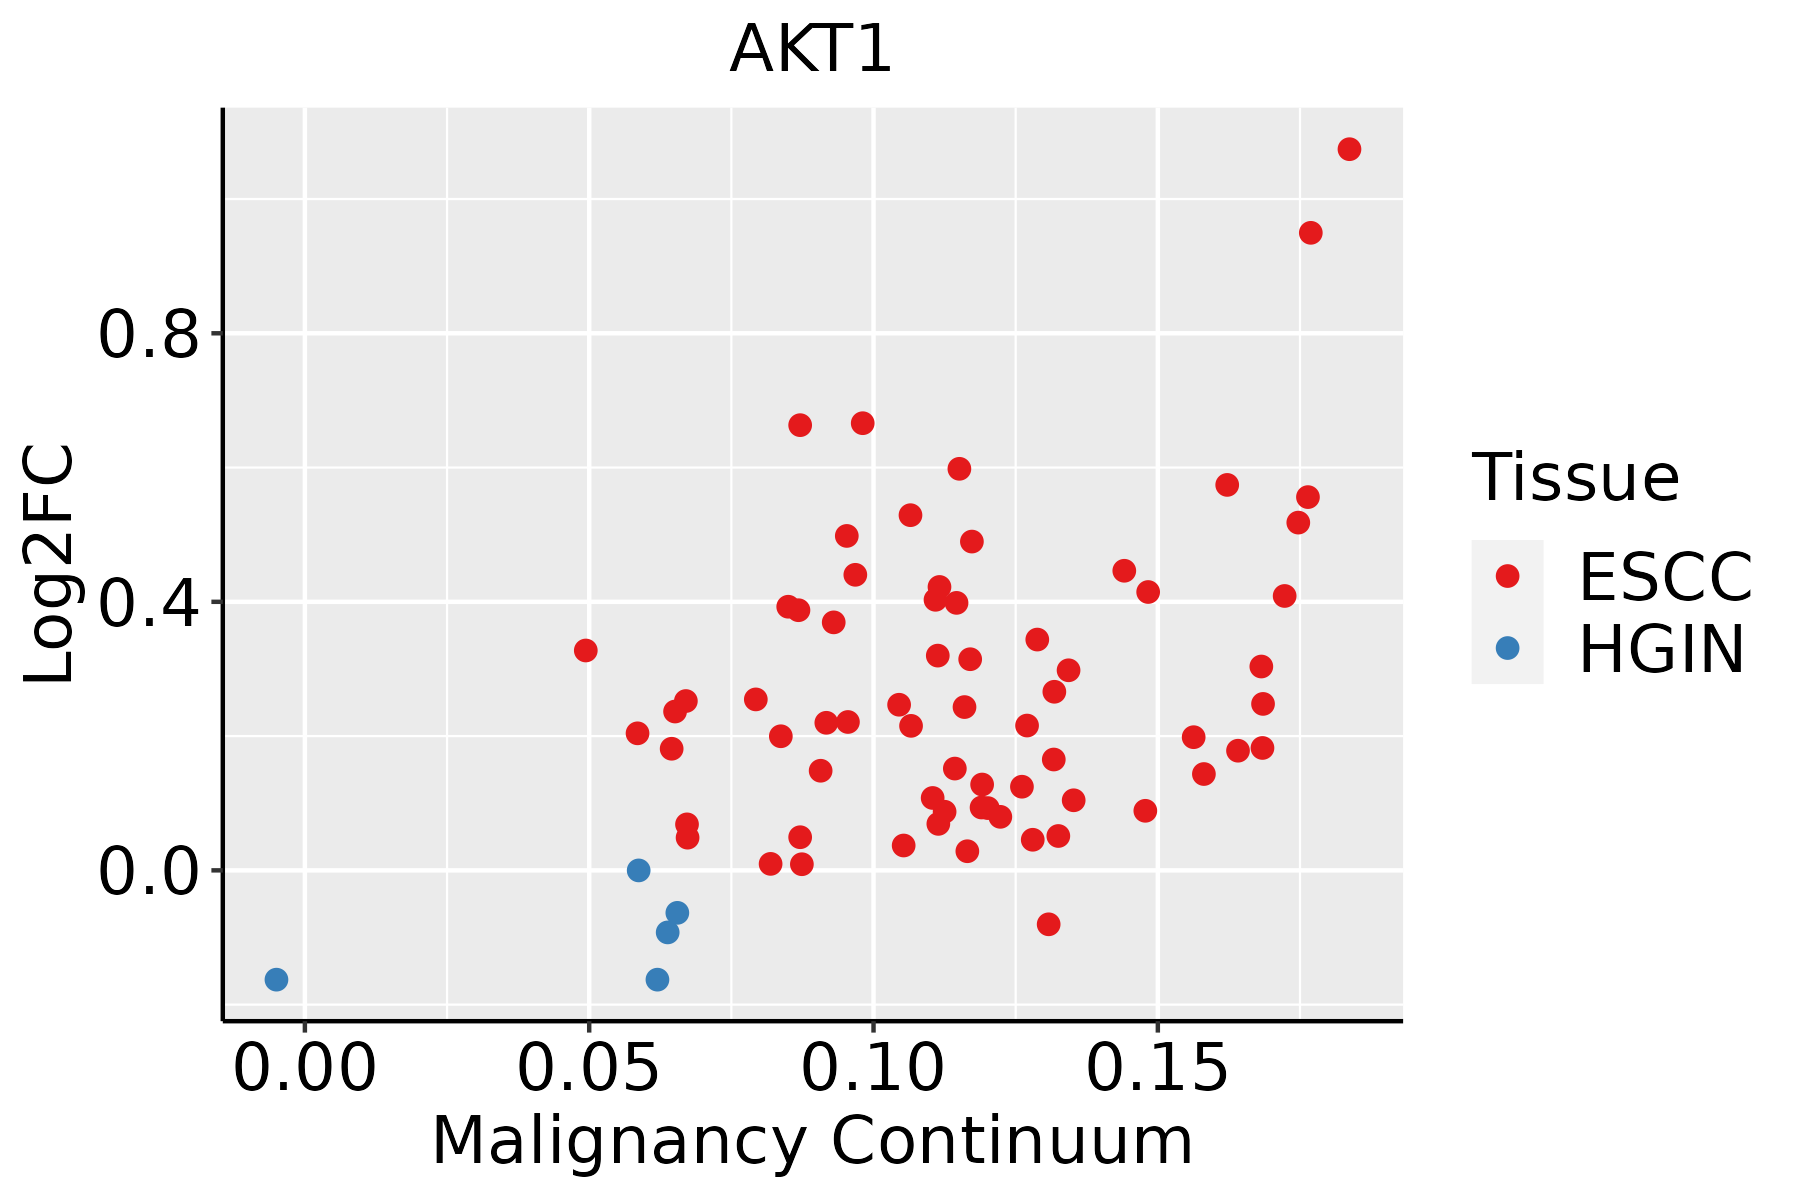 | ESCC: Esophageal squamous cell carcinoma |
| HGIN: High-grade intraepithelial neoplasias |
| LGIN: Low-grade intraepithelial neoplasias |
| Liver |  | HCC: Hepatocellular carcinoma |
| NAFLD: Non-alcoholic fatty liver disease |
| Oral Cavity |  | EOLP: Erosive Oral lichen planus |
| LP: leukoplakia |
| NEOLP: Non-erosive oral lichen planus |
| OSCC: Oral squamous cell carcinoma |
| Thyroid |  | ATC: Anaplastic thyroid cancer |
| HT: Hashimoto's thyroiditis |
| PTC: Papillary thyroid cancer |
| GO ID | Tissue | Disease Stage | Description | Gene Ratio | Bg Ratio | pvalue | p.adjust | Count |
| GO:0070227 | Oral cavity | OSCC | lymphocyte apoptotic process | 40/7305 | 72/18723 | 3.21e-03 | 1.38e-02 | 40 |
| GO:00620128 | Oral cavity | OSCC | regulation of small molecule metabolic process | 155/7305 | 334/18723 | 3.30e-03 | 1.41e-02 | 155 |
| GO:00457371 | Oral cavity | OSCC | positive regulation of cyclin-dependent protein serine/threonine kinase activity | 19/7305 | 29/18723 | 3.47e-03 | 1.47e-02 | 19 |
| GO:00181079 | Oral cavity | OSCC | peptidyl-threonine phosphorylation | 60/7305 | 116/18723 | 3.59e-03 | 1.50e-02 | 60 |
| GO:19040311 | Oral cavity | OSCC | positive regulation of cyclin-dependent protein kinase activity | 21/7305 | 33/18723 | 3.63e-03 | 1.51e-02 | 21 |
| GO:00182109 | Oral cavity | OSCC | peptidyl-threonine modification | 64/7305 | 125/18723 | 3.68e-03 | 1.52e-02 | 64 |
| GO:005087010 | Oral cavity | OSCC | positive regulation of T cell activation | 104/7305 | 216/18723 | 3.76e-03 | 1.55e-02 | 104 |
| GO:003087910 | Oral cavity | OSCC | mammary gland development | 69/7305 | 137/18723 | 4.43e-03 | 1.79e-02 | 69 |
| GO:00331354 | Oral cavity | OSCC | regulation of peptidyl-serine phosphorylation | 72/7305 | 144/18723 | 4.66e-03 | 1.87e-02 | 72 |
| GO:00426927 | Oral cavity | OSCC | muscle cell differentiation | 175/7305 | 384/18723 | 4.79e-03 | 1.92e-02 | 175 |
| GO:001063218 | Oral cavity | OSCC | regulation of epithelial cell migration | 136/7305 | 292/18723 | 4.82e-03 | 1.92e-02 | 136 |
| GO:00068514 | Oral cavity | OSCC | mitochondrial calcium ion transmembrane transport | 14/7305 | 20/18723 | 4.95e-03 | 1.94e-02 | 14 |
| GO:00486614 | Oral cavity | OSCC | positive regulation of smooth muscle cell proliferation | 54/7305 | 104/18723 | 5.00e-03 | 1.96e-02 | 54 |
| GO:00447067 | Oral cavity | OSCC | multi-multicellular organism process | 105/7305 | 220/18723 | 5.05e-03 | 1.97e-02 | 105 |
| GO:00160513 | Oral cavity | OSCC | carbohydrate biosynthetic process | 97/7305 | 202/18723 | 5.50e-03 | 2.13e-02 | 97 |
| GO:190040718 | Oral cavity | OSCC | regulation of cellular response to oxidative stress | 47/7305 | 89/18723 | 5.62e-03 | 2.17e-02 | 47 |
| GO:000680915 | Oral cavity | OSCC | nitric oxide biosynthetic process | 41/7305 | 76/18723 | 5.78e-03 | 2.22e-02 | 41 |
| GO:20004013 | Oral cavity | OSCC | regulation of lymphocyte migration | 34/7305 | 61/18723 | 5.90e-03 | 2.25e-02 | 34 |
| GO:00486596 | Oral cavity | OSCC | smooth muscle cell proliferation | 89/7305 | 184/18723 | 5.95e-03 | 2.27e-02 | 89 |
| GO:00714022 | Oral cavity | OSCC | cellular response to lipoprotein particle stimulus | 22/7305 | 36/18723 | 5.96e-03 | 2.27e-02 | 22 |
| Pathway ID | Tissue | Disease Stage | Description | Gene Ratio | Bg Ratio | pvalue | p.adjust | qvalue | Count |
| hsa05208 | Colorectum | AD | Chemical carcinogenesis - reactive oxygen species | 126/2092 | 223/8465 | 1.01e-24 | 1.68e-22 | 1.07e-22 | 126 |
| hsa05415 | Colorectum | AD | Diabetic cardiomyopathy | 114/2092 | 203/8465 | 3.65e-22 | 3.06e-20 | 1.95e-20 | 114 |
| hsa05010 | Colorectum | AD | Alzheimer disease | 174/2092 | 384/8465 | 1.82e-19 | 9.26e-18 | 5.91e-18 | 174 |
| hsa04932 | Colorectum | AD | Non-alcoholic fatty liver disease | 90/2092 | 155/8465 | 4.83e-19 | 1.80e-17 | 1.15e-17 | 90 |
| hsa05131 | Colorectum | AD | Shigellosis | 109/2092 | 247/8465 | 1.09e-11 | 2.44e-10 | 1.55e-10 | 109 |
| hsa05132 | Colorectum | AD | Salmonella infection | 102/2092 | 249/8465 | 7.65e-09 | 1.28e-07 | 8.17e-08 | 102 |
| hsa04666 | Colorectum | AD | Fc gamma R-mediated phagocytosis | 46/2092 | 97/8465 | 9.10e-07 | 1.22e-05 | 7.77e-06 | 46 |
| hsa05017 | Colorectum | AD | Spinocerebellar ataxia | 60/2092 | 143/8465 | 3.78e-06 | 4.35e-05 | 2.78e-05 | 60 |
| hsa05135 | Colorectum | AD | Yersinia infection | 58/2092 | 137/8465 | 3.90e-06 | 4.35e-05 | 2.78e-05 | 58 |
| hsa04066 | Colorectum | AD | HIF-1 signaling pathway | 48/2092 | 109/8465 | 7.25e-06 | 7.84e-05 | 5.00e-05 | 48 |
| hsa04919 | Colorectum | AD | Thyroid hormone signaling pathway | 51/2092 | 121/8465 | 1.71e-05 | 1.73e-04 | 1.10e-04 | 51 |
| hsa04722 | Colorectum | AD | Neurotrophin signaling pathway | 50/2092 | 119/8465 | 2.28e-05 | 2.24e-04 | 1.43e-04 | 50 |
| hsa05213 | Colorectum | AD | Endometrial cancer | 29/2092 | 58/8465 | 2.69e-05 | 2.57e-04 | 1.64e-04 | 29 |
| hsa05230 | Colorectum | AD | Central carbon metabolism in cancer | 33/2092 | 70/8465 | 3.61e-05 | 3.19e-04 | 2.03e-04 | 33 |
| hsa05418 | Colorectum | AD | Fluid shear stress and atherosclerosis | 54/2092 | 139/8465 | 1.41e-04 | 1.16e-03 | 7.37e-04 | 54 |
| hsa04152 | Colorectum | AD | AMPK signaling pathway | 47/2092 | 121/8465 | 3.74e-04 | 2.82e-03 | 1.80e-03 | 47 |
| hsa05210 | Colorectum | AD | Colorectal cancer | 35/2092 | 86/8465 | 7.54e-04 | 5.49e-03 | 3.50e-03 | 35 |
| hsa04213 | Colorectum | AD | Longevity regulating pathway - multiple species | 27/2092 | 62/8465 | 8.72e-04 | 5.96e-03 | 3.80e-03 | 27 |
| hsa04922 | Colorectum | AD | Glucagon signaling pathway | 41/2092 | 107/8465 | 1.18e-03 | 7.75e-03 | 4.94e-03 | 41 |
| hsa05417 | Colorectum | AD | Lipid and atherosclerosis | 73/2092 | 215/8465 | 1.31e-03 | 8.27e-03 | 5.27e-03 | 73 |
| Hugo Symbol | Variant Class | Variant Classification | dbSNP RS | HGVSc | HGVSp | HGVSp Short | SWISSPROT | BIOTYPE | SIFT | PolyPhen | Tumor Sample Barcode | Tissue | Histology | Sex | Age | Stage | Therapy Types | Drugs | Outcome |
| AKT1 | SNV | Missense_Mutation | novel | c.618N>T | p.Arg206Ser | p.R206S | P31749 | protein_coding | tolerated(0.32) | benign(0.023) | TCGA-A7-A13G-01 | Breast | breast invasive carcinoma | Female | >=65 | I/II | Hormone Therapy | arimidex | PD |
| AKT1 | SNV | Missense_Mutation | rs121434592 | c.49G>A | p.Glu17Lys | p.E17K | P31749 | protein_coding | deleterious(0) | probably_damaging(1) | TCGA-A8-A094-01 | Breast | breast invasive carcinoma | Female | >=65 | I/II | Unknown | Unknown | SD |
| AKT1 | SNV | Missense_Mutation | rs121434592 | c.49G>A | p.Glu17Lys | p.E17K | P31749 | protein_coding | deleterious(0) | probably_damaging(1) | TCGA-AC-A6IX-01 | Breast | breast invasive carcinoma | Female | <65 | III/IV | Unknown | Unknown | SD |
| AKT1 | SNV | Missense_Mutation | | c.155N>G | p.Leu52Arg | p.L52R | P31749 | protein_coding | deleterious(0) | probably_damaging(0.993) | TCGA-AN-A0XR-01 | Breast | breast invasive carcinoma | Female | <65 | III/IV | Unknown | Unknown | SD |
| AKT1 | SNV | Missense_Mutation | rs121434592 | c.49G>A | p.Glu17Lys | p.E17K | P31749 | protein_coding | deleterious(0) | probably_damaging(1) | TCGA-AO-A12H-01 | Breast | breast invasive carcinoma | Female | >=65 | I/II | Hormone Therapy | arimidex | SD |
| AKT1 | SNV | Missense_Mutation | rs121434592 | c.49G>A | p.Glu17Lys | p.E17K | P31749 | protein_coding | deleterious(0) | probably_damaging(1) | TCGA-AR-A24X-01 | Breast | breast invasive carcinoma | Female | <65 | I/II | Hormone Therapy | tamoxiphen | SD |
| AKT1 | SNV | Missense_Mutation | rs121434592 | c.49G>A | p.Glu17Lys | p.E17K | P31749 | protein_coding | deleterious(0) | probably_damaging(1) | TCGA-B6-A0WZ-01 | Breast | breast invasive carcinoma | Female | <65 | I/II | Unknown | Unknown | PD |
| AKT1 | SNV | Missense_Mutation | rs121434592 | c.49N>A | p.Glu17Lys | p.E17K | P31749 | protein_coding | deleterious(0) | probably_damaging(1) | TCGA-BH-A0BR-01 | Breast | breast invasive carcinoma | Female | <65 | I/II | Unknown | Unknown | SD |
| AKT1 | SNV | Missense_Mutation | rs121434592 | c.49N>A | p.Glu17Lys | p.E17K | P31749 | protein_coding | deleterious(0) | probably_damaging(1) | TCGA-BH-A0BS-01 | Breast | breast invasive carcinoma | Female | <65 | III/IV | Chemotherapy | adriamycin | CR |
| AKT1 | SNV | Missense_Mutation | rs121434592 | c.49N>A | p.Glu17Lys | p.E17K | P31749 | protein_coding | deleterious(0) | probably_damaging(1) | TCGA-BH-A0W4-01 | Breast | breast invasive carcinoma | Female | <65 | I/II | Unknown | Unknown | SD |
| Entrez ID | Symbol | Category | Interaction Types | Drug Claim Name | Drug Name | PMIDs |
| 207 | AKT1 | SERINE THREONINE KINASE, KINASE, ENZYME, DRUGGABLE GENOME, CLINICALLY ACTIONABLE, TRANSPORTER, TRANSCRIPTION FACTOR, DRUG RESISTANCE | inhibitor | 178101884 | GSK-690693 | |
| 207 | AKT1 | SERINE THREONINE KINASE, KINASE, ENZYME, DRUGGABLE GENOME, CLINICALLY ACTIONABLE, TRANSPORTER, TRANSCRIPTION FACTOR, DRUG RESISTANCE | | AZD4547 | | 26351323 |
| 207 | AKT1 | SERINE THREONINE KINASE, KINASE, ENZYME, DRUGGABLE GENOME, CLINICALLY ACTIONABLE, TRANSPORTER, TRANSCRIPTION FACTOR, DRUG RESISTANCE | | PTX-200 | | |
| 207 | AKT1 | SERINE THREONINE KINASE, KINASE, ENZYME, DRUGGABLE GENOME, CLINICALLY ACTIONABLE, TRANSPORTER, TRANSCRIPTION FACTOR, DRUG RESISTANCE | inhibitor | CHEMBL3137336 | UPROSERTIB | |
| 207 | AKT1 | SERINE THREONINE KINASE, KINASE, ENZYME, DRUGGABLE GENOME, CLINICALLY ACTIONABLE, TRANSPORTER, TRANSCRIPTION FACTOR, DRUG RESISTANCE | inhibitor | 249565578 | IPATASERTIB | |
| 207 | AKT1 | SERINE THREONINE KINASE, KINASE, ENZYME, DRUGGABLE GENOME, CLINICALLY ACTIONABLE, TRANSPORTER, TRANSCRIPTION FACTOR, DRUG RESISTANCE | | Ipatasertib | IPATASERTIB | 27872130 |
| 207 | AKT1 | SERINE THREONINE KINASE, KINASE, ENZYME, DRUGGABLE GENOME, CLINICALLY ACTIONABLE, TRANSPORTER, TRANSCRIPTION FACTOR, DRUG RESISTANCE | | GAMBOGIC AMIDE | GAMBOGIC AMIDE | 17911251 |
| 207 | AKT1 | SERINE THREONINE KINASE, KINASE, ENZYME, DRUGGABLE GENOME, CLINICALLY ACTIONABLE, TRANSPORTER, TRANSCRIPTION FACTOR, DRUG RESISTANCE | | GDC-0068 | IPATASERTIB | |
| 207 | AKT1 | SERINE THREONINE KINASE, KINASE, ENZYME, DRUGGABLE GENOME, CLINICALLY ACTIONABLE, TRANSPORTER, TRANSCRIPTION FACTOR, DRUG RESISTANCE | | SOTRASTAURIN | SOTRASTAURIN | |
| 207 | AKT1 | SERINE THREONINE KINASE, KINASE, ENZYME, DRUGGABLE GENOME, CLINICALLY ACTIONABLE, TRANSPORTER, TRANSCRIPTION FACTOR, DRUG RESISTANCE | inhibitor | MK-2206 | MK-2206 | |


