
|
|||||
|
 | |
| |
| |
| |
| |
| |
|
Gene: EZR |
Gene summary for EZR |
| Gene information | Species | Human | Gene symbol | EZR | Gene ID | 7430 |
| Gene name | ezrin | |
| Gene Alias | CVIL | |
| Cytomap | 6q25.3 | |
| Gene Type | protein-coding | GO ID | GO:0000122 | UniProtAcc | P15311 |
Top |
Malignant transformation analysis |
| Identification of the aberrant gene expression in precancerous and cancerous lesions by comparing the gene expression of stem-like cells in diseased tissues with normal stem cells |
| Entrez ID | Symbol | Replicates | Species | Organ | Tissue | Adj P-value | Log2FC | Malignancy |
| 7430 | EZR | GSM4909290 | Human | Breast | IDC | 3.17e-02 | 2.92e-01 | 0.2096 |
| 7430 | EZR | GSM4909293 | Human | Breast | IDC | 3.45e-06 | 2.15e-01 | 0.1581 |
| 7430 | EZR | GSM4909296 | Human | Breast | IDC | 3.02e-17 | -4.60e-01 | 0.1524 |
| 7430 | EZR | GSM4909297 | Human | Breast | IDC | 1.50e-09 | -5.31e-02 | 0.1517 |
| 7430 | EZR | GSM4909298 | Human | Breast | IDC | 5.72e-03 | 1.91e-01 | 0.1551 |
| 7430 | EZR | GSM4909311 | Human | Breast | IDC | 2.51e-26 | -3.87e-01 | 0.1534 |
| 7430 | EZR | GSM4909312 | Human | Breast | IDC | 7.48e-05 | -1.68e-01 | 0.1552 |
| 7430 | EZR | GSM4909317 | Human | Breast | IDC | 6.47e-05 | 3.52e-01 | 0.1355 |
| 7430 | EZR | GSM4909319 | Human | Breast | IDC | 6.75e-29 | -5.10e-01 | 0.1563 |
| 7430 | EZR | GSM4909321 | Human | Breast | IDC | 6.13e-08 | -2.49e-01 | 0.1559 |
| 7430 | EZR | brca1 | Human | Breast | Precancer | 2.95e-08 | 3.75e-01 | -0.0338 |
| 7430 | EZR | brca2 | Human | Breast | Precancer | 1.57e-03 | 1.91e-01 | -0.024 |
| 7430 | EZR | NCCBC14 | Human | Breast | DCIS | 6.21e-17 | 4.00e-01 | 0.2021 |
| 7430 | EZR | NCCBC5 | Human | Breast | DCIS | 1.57e-11 | -2.03e-01 | 0.2046 |
| 7430 | EZR | P1 | Human | Breast | IDC | 3.30e-15 | -1.23e-01 | 0.1527 |
| 7430 | EZR | P2 | Human | Breast | IDC | 8.79e-04 | 2.67e-01 | 0.21 |
| 7430 | EZR | DCIS2 | Human | Breast | DCIS | 1.28e-49 | 6.22e-01 | 0.0085 |
| 7430 | EZR | CA_HPV_1 | Human | Cervix | CC | 4.50e-03 | -2.16e-01 | 0.0264 |
| 7430 | EZR | CA_HPV_3 | Human | Cervix | CC | 2.09e-05 | -2.62e-01 | 0.0414 |
| 7430 | EZR | HSIL_HPV_1 | Human | Cervix | HSIL_HPV | 2.40e-06 | -4.56e-01 | 0.0116 |
| Page: 1 2 3 4 5 6 7 8 9 10 11 12 13 14 15 |
| Tissue | Expression Dynamics | Abbreviation |
| Breast | 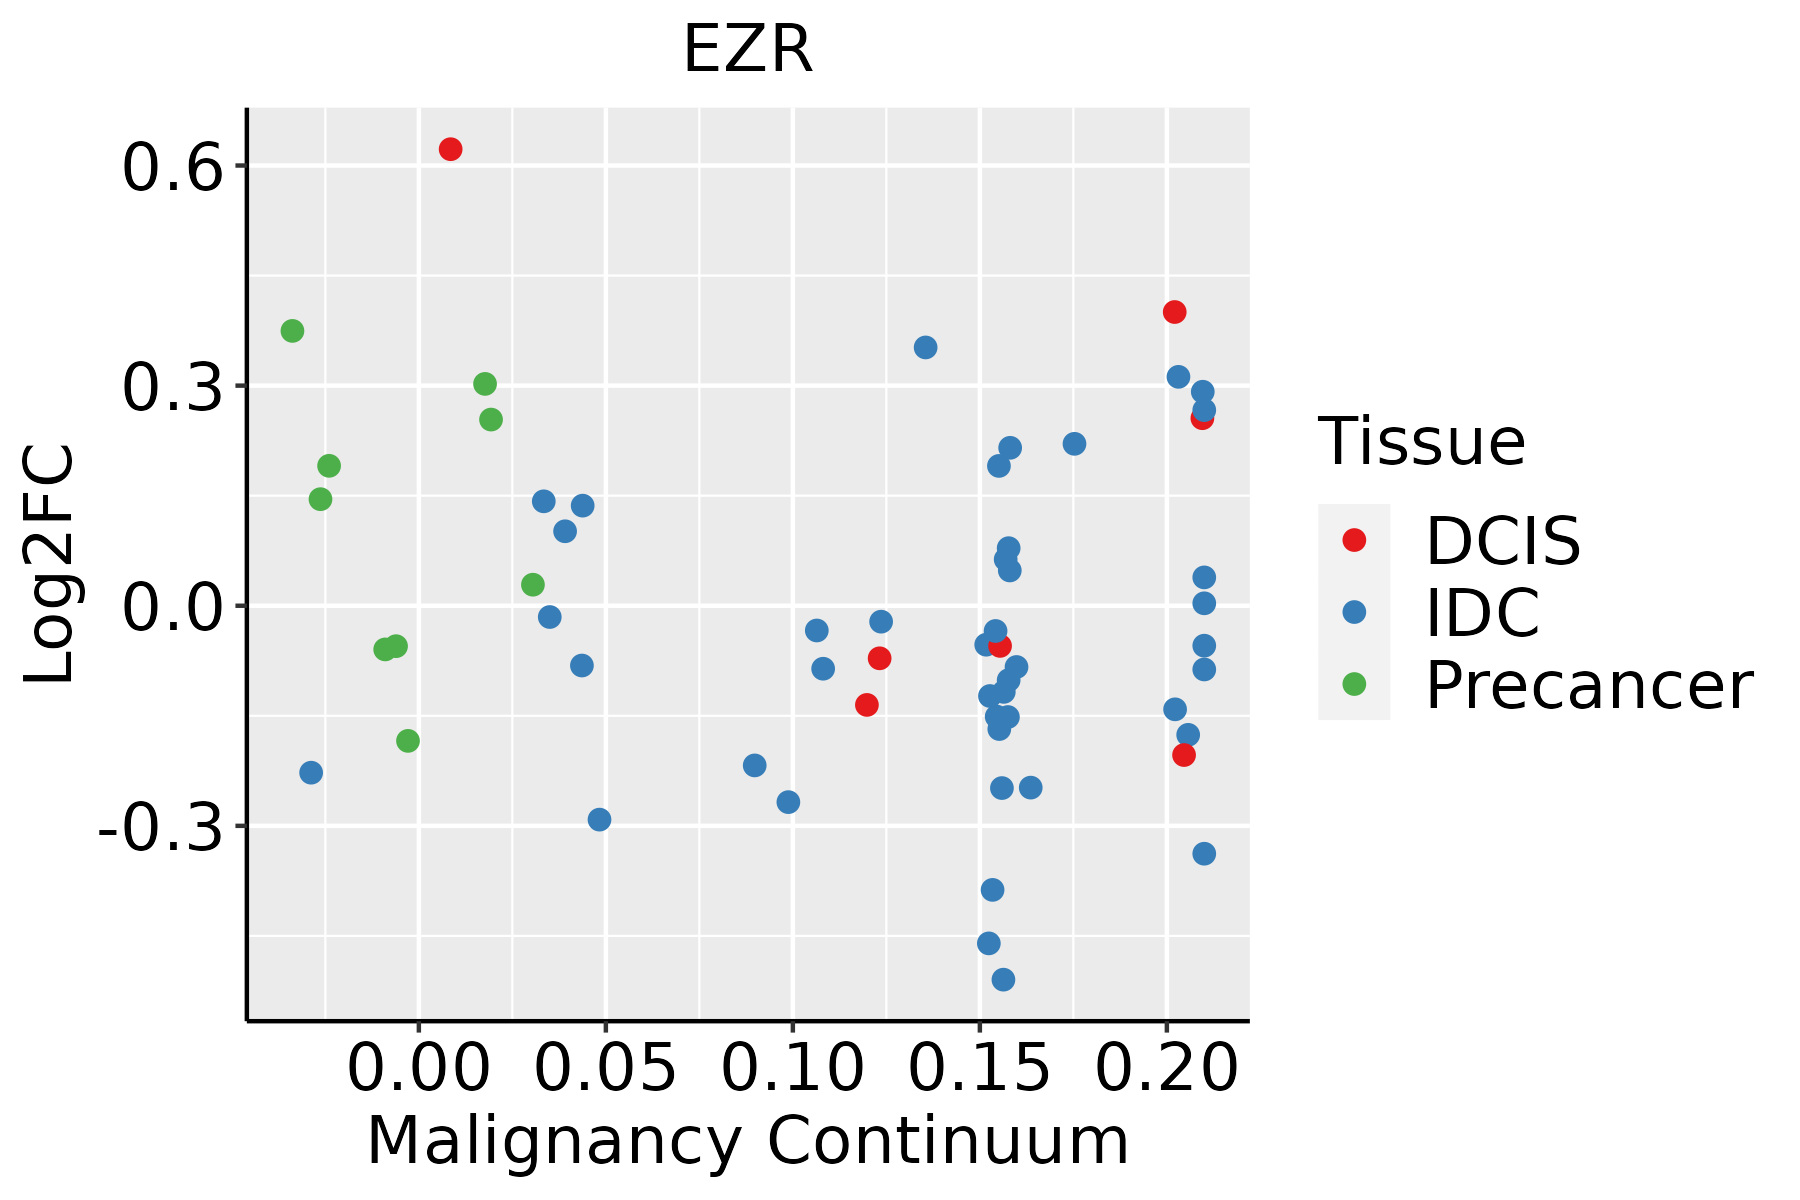 | IDC: Invasive ductal carcinoma |
| DCIS: Ductal carcinoma in situ | ||
| Precancer(BRCA1-mut): Precancerous lesion from BRCA1 mutation carriers | ||
| Cervix | 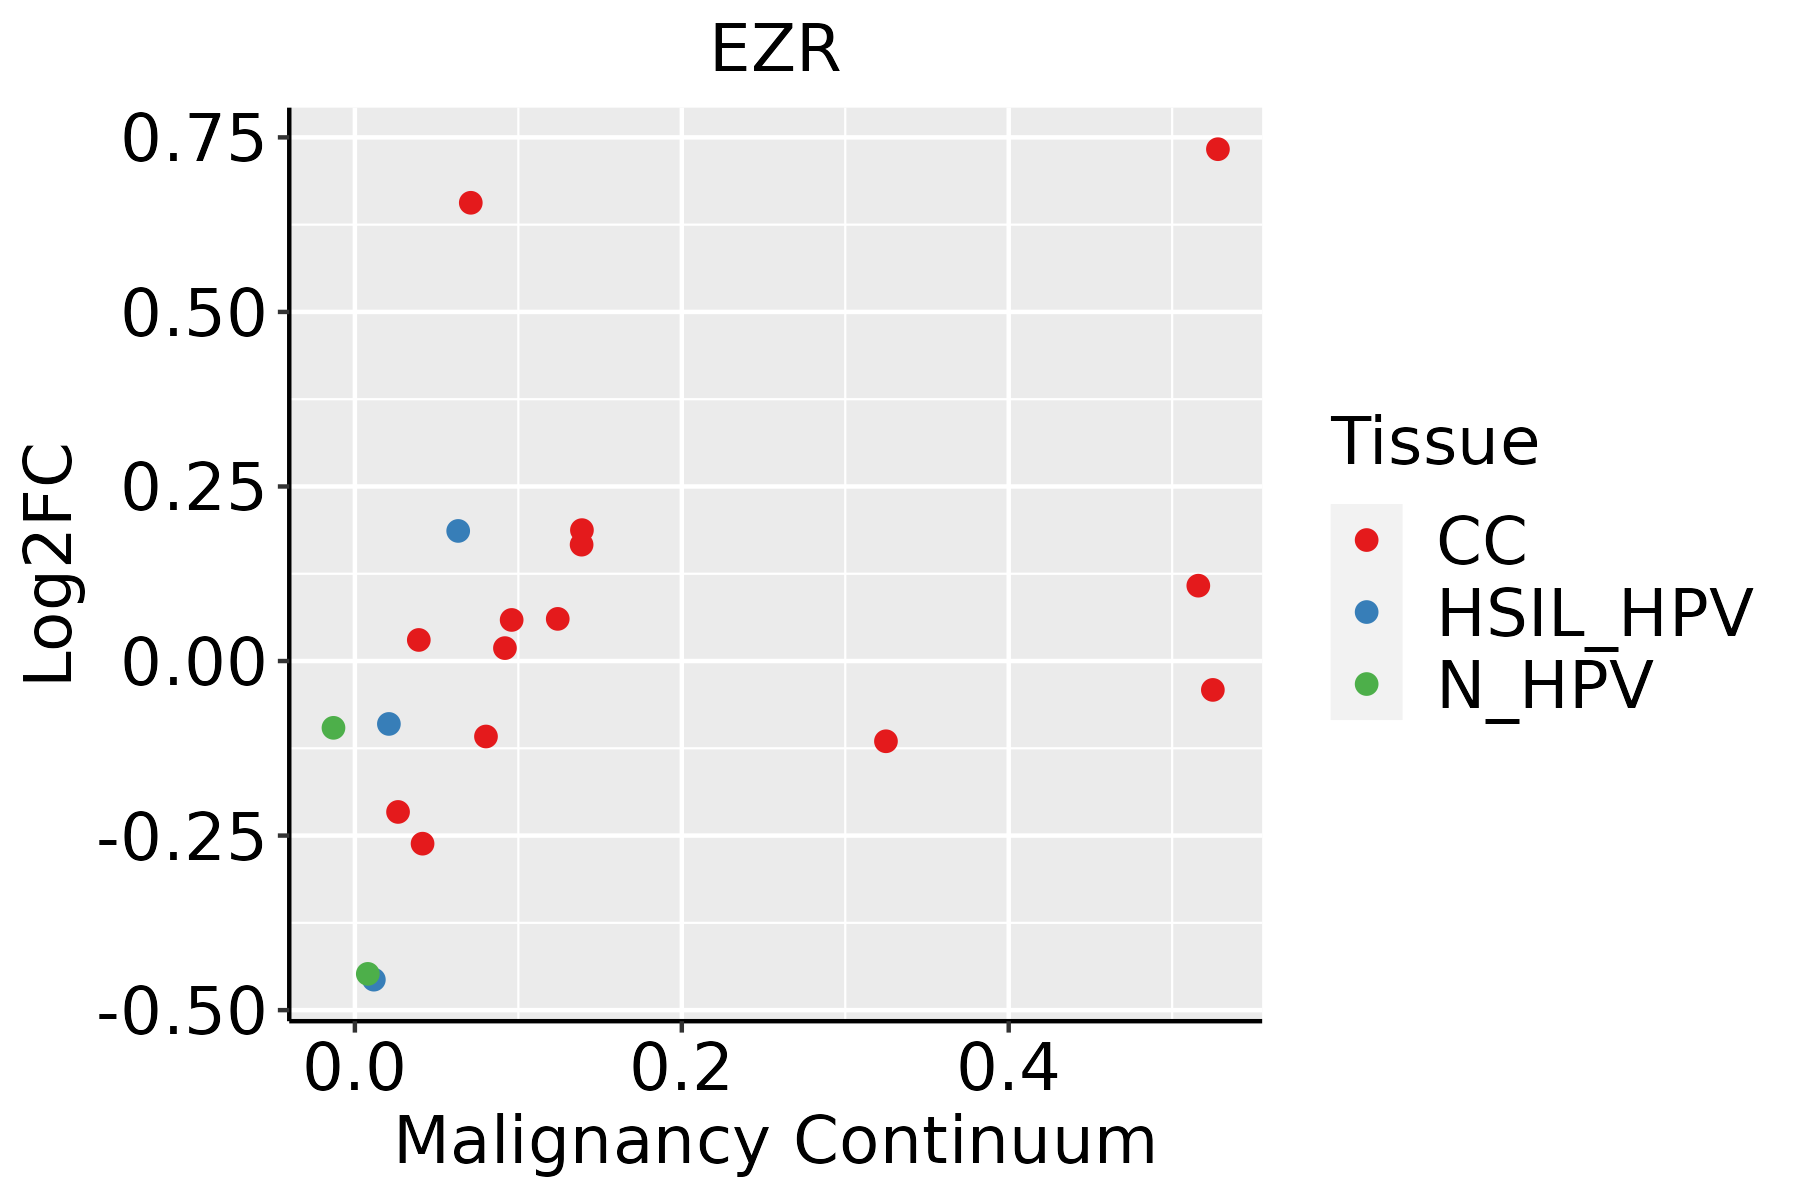 | CC: Cervix cancer |
| HSIL_HPV: HPV-infected high-grade squamous intraepithelial lesions | ||
| N_HPV: HPV-infected normal cervix | ||
| Colorectum (GSE201348) |  | FAP: Familial adenomatous polyposis |
| CRC: Colorectal cancer | ||
| Colorectum (HTA11) |  | AD: Adenomas |
| SER: Sessile serrated lesions | ||
| MSI-H: Microsatellite-high colorectal cancer | ||
| MSS: Microsatellite stable colorectal cancer | ||
| Endometrium | 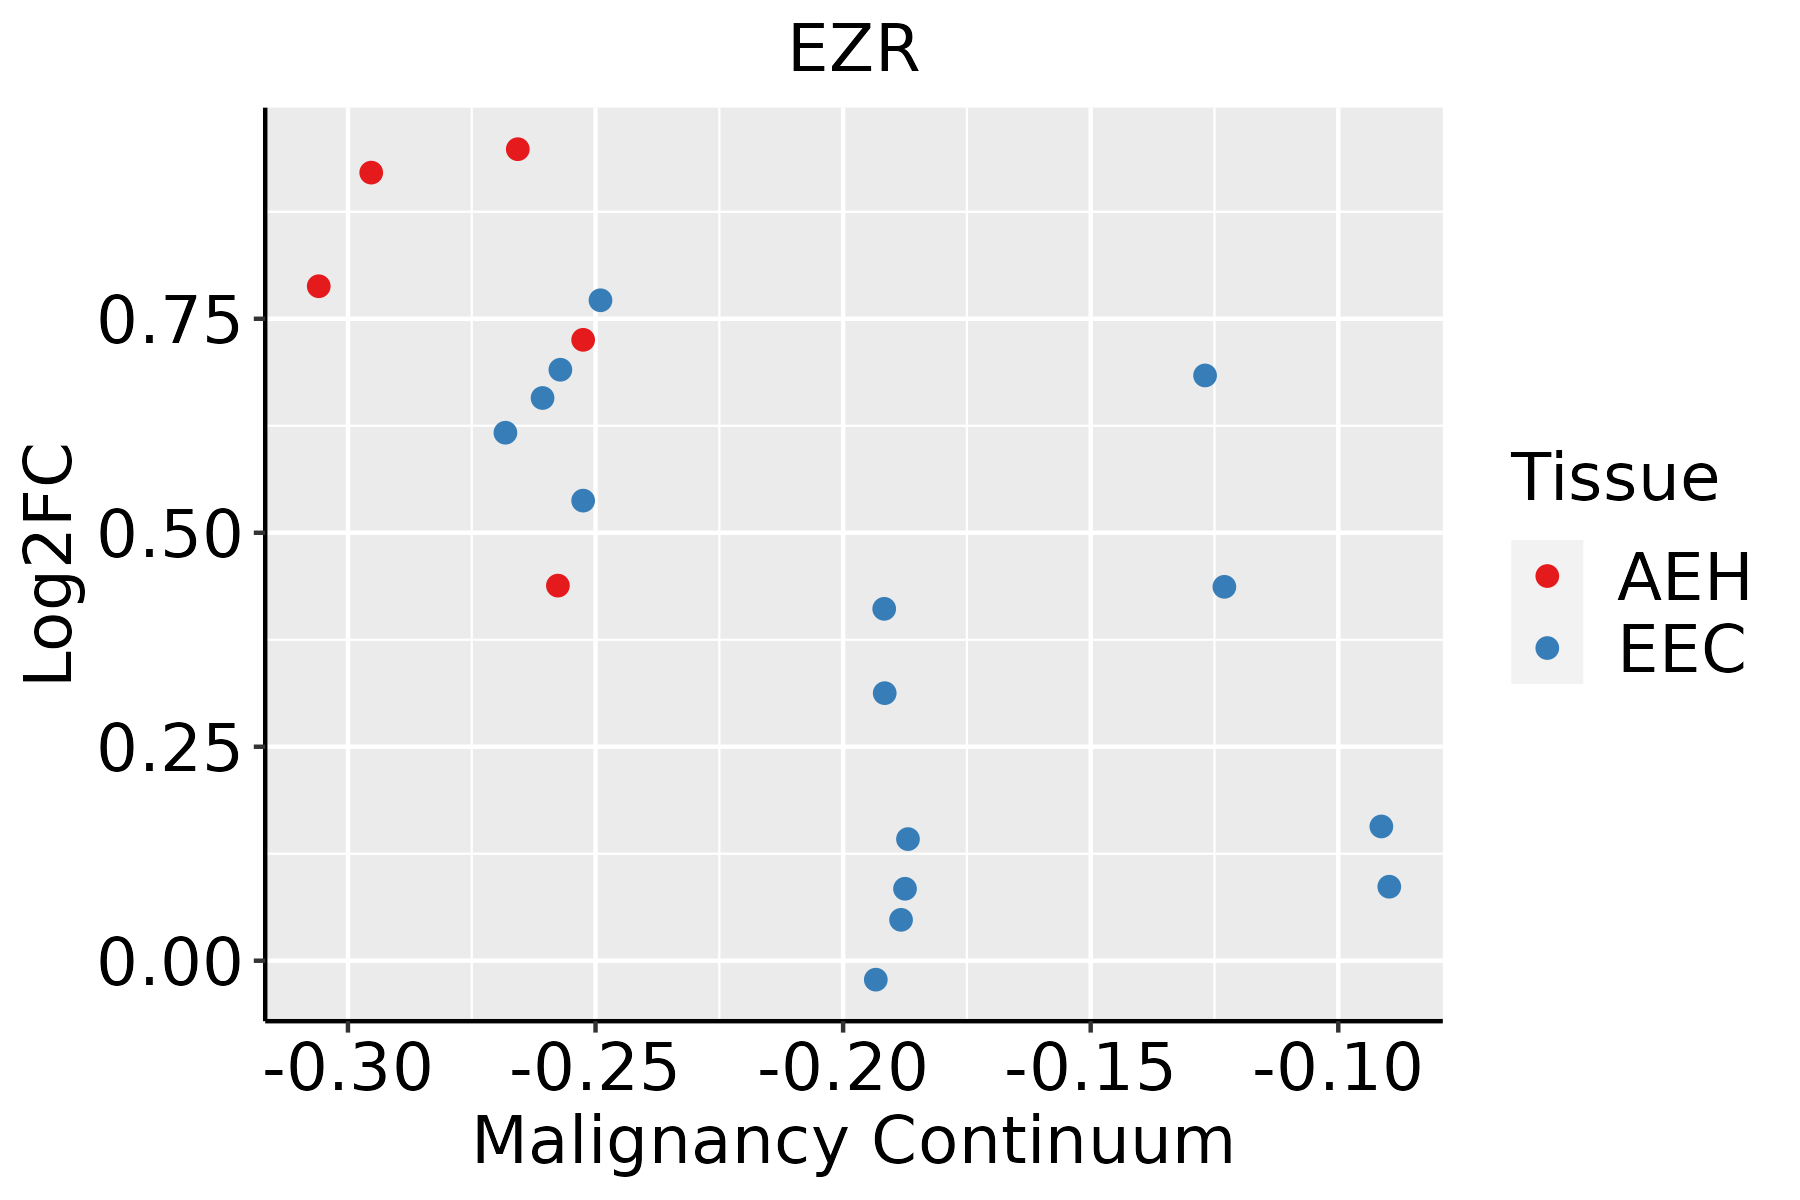 | AEH: Atypical endometrial hyperplasia |
| EEC: Endometrioid Cancer | ||
| Esophagus | 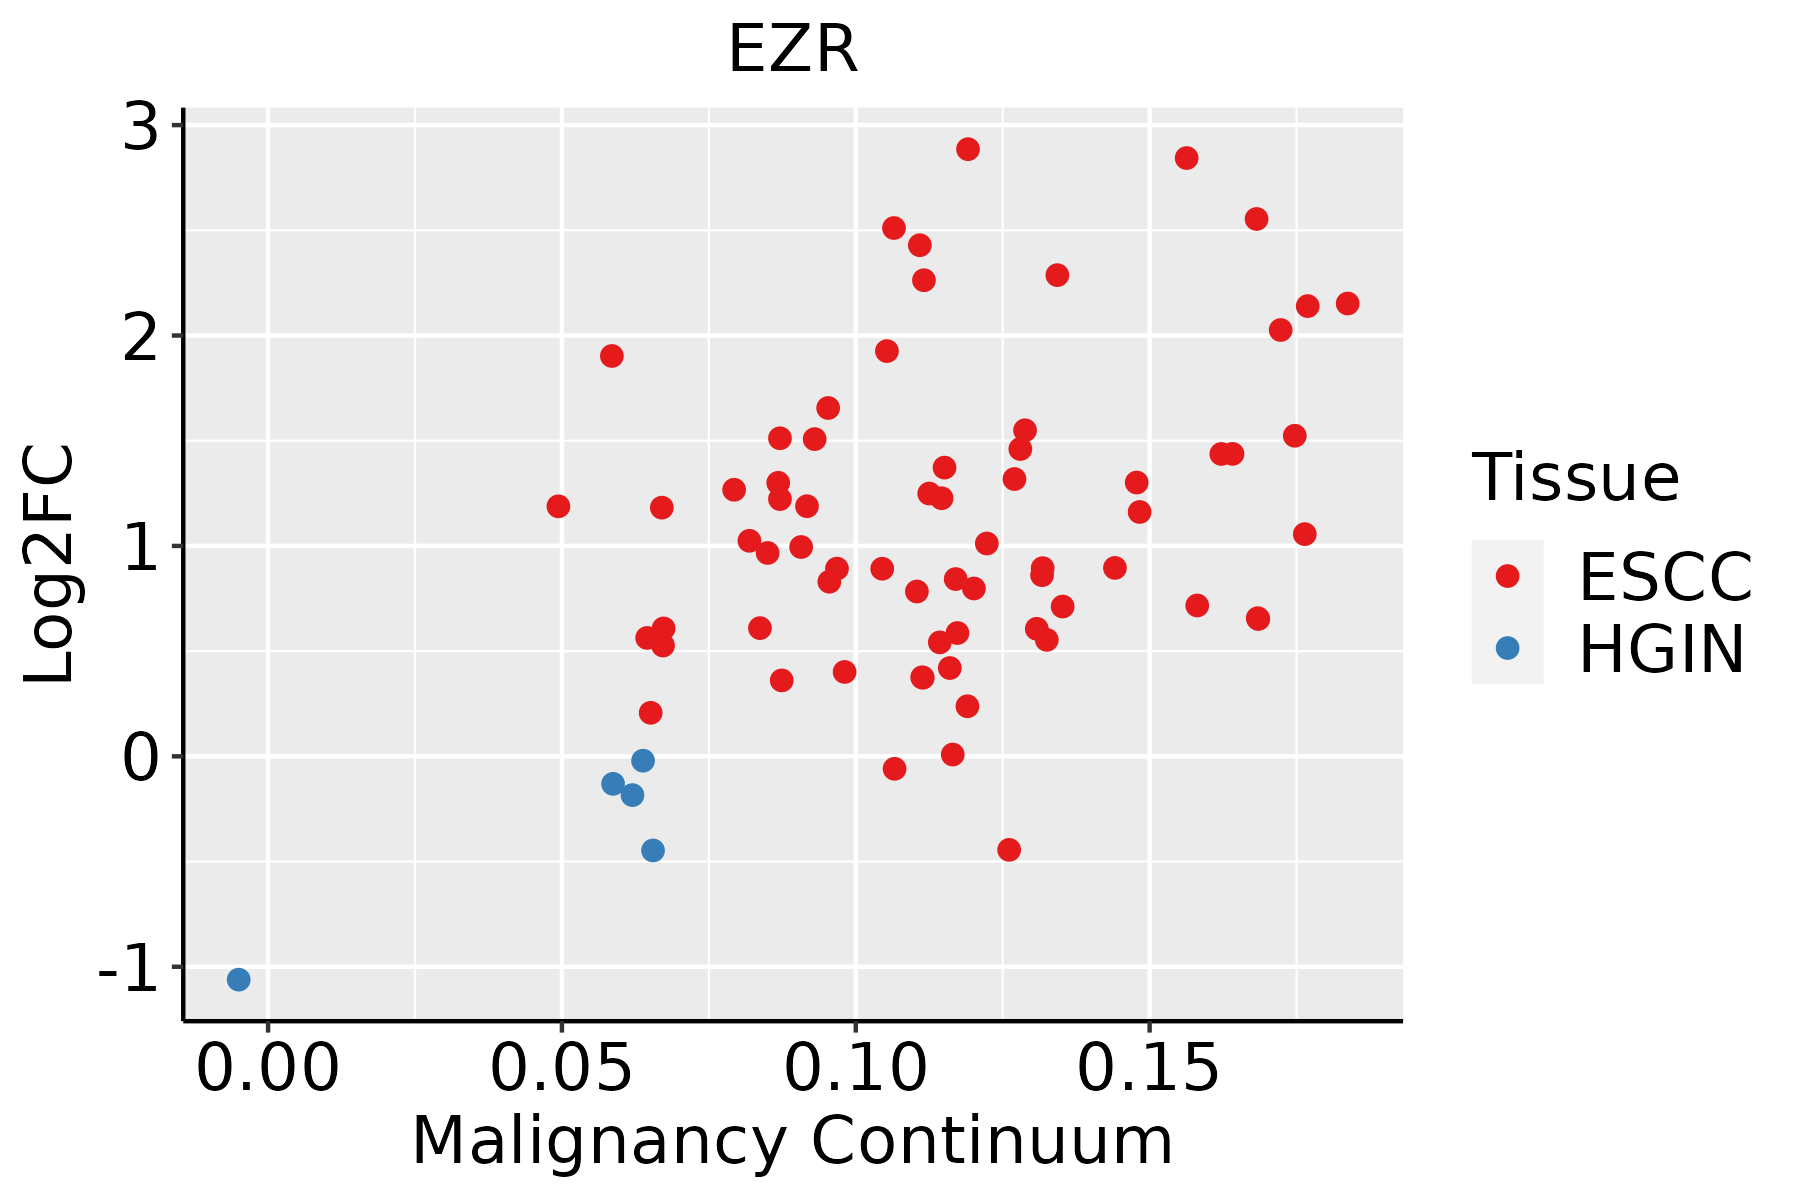 | ESCC: Esophageal squamous cell carcinoma |
| HGIN: High-grade intraepithelial neoplasias | ||
| LGIN: Low-grade intraepithelial neoplasias | ||
| GC |  | CAG: Chronic atrophic gastritis |
| CAG with IM: Chronic atrophic gastritis with intestinal metaplasia | ||
| CSG: Chronic superficial gastritis | ||
| GC: Gastric cancer | ||
| SIM: Severe intestinal metaplasia | ||
| WIM: Wild intestinal metaplasia | ||
| Liver | 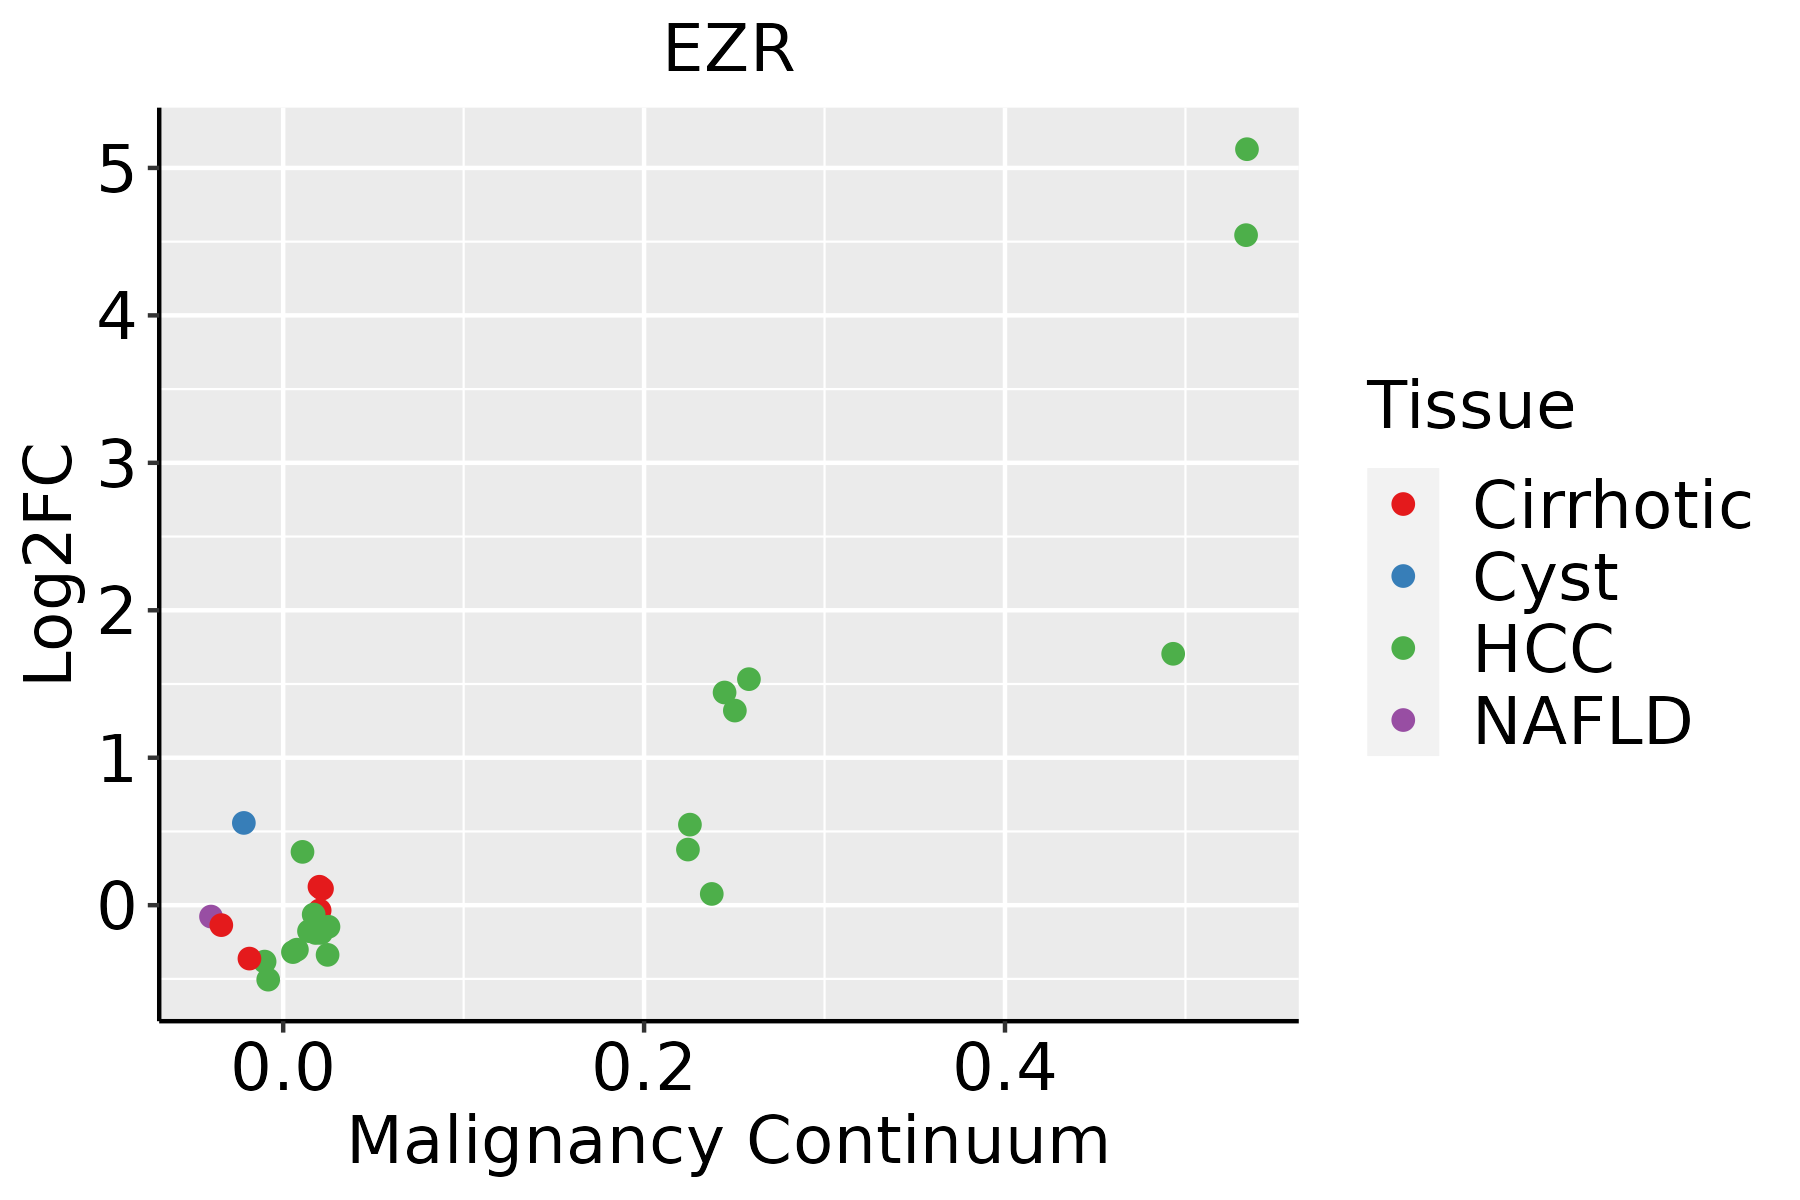 | HCC: Hepatocellular carcinoma |
| NAFLD: Non-alcoholic fatty liver disease | ||
| Lung | 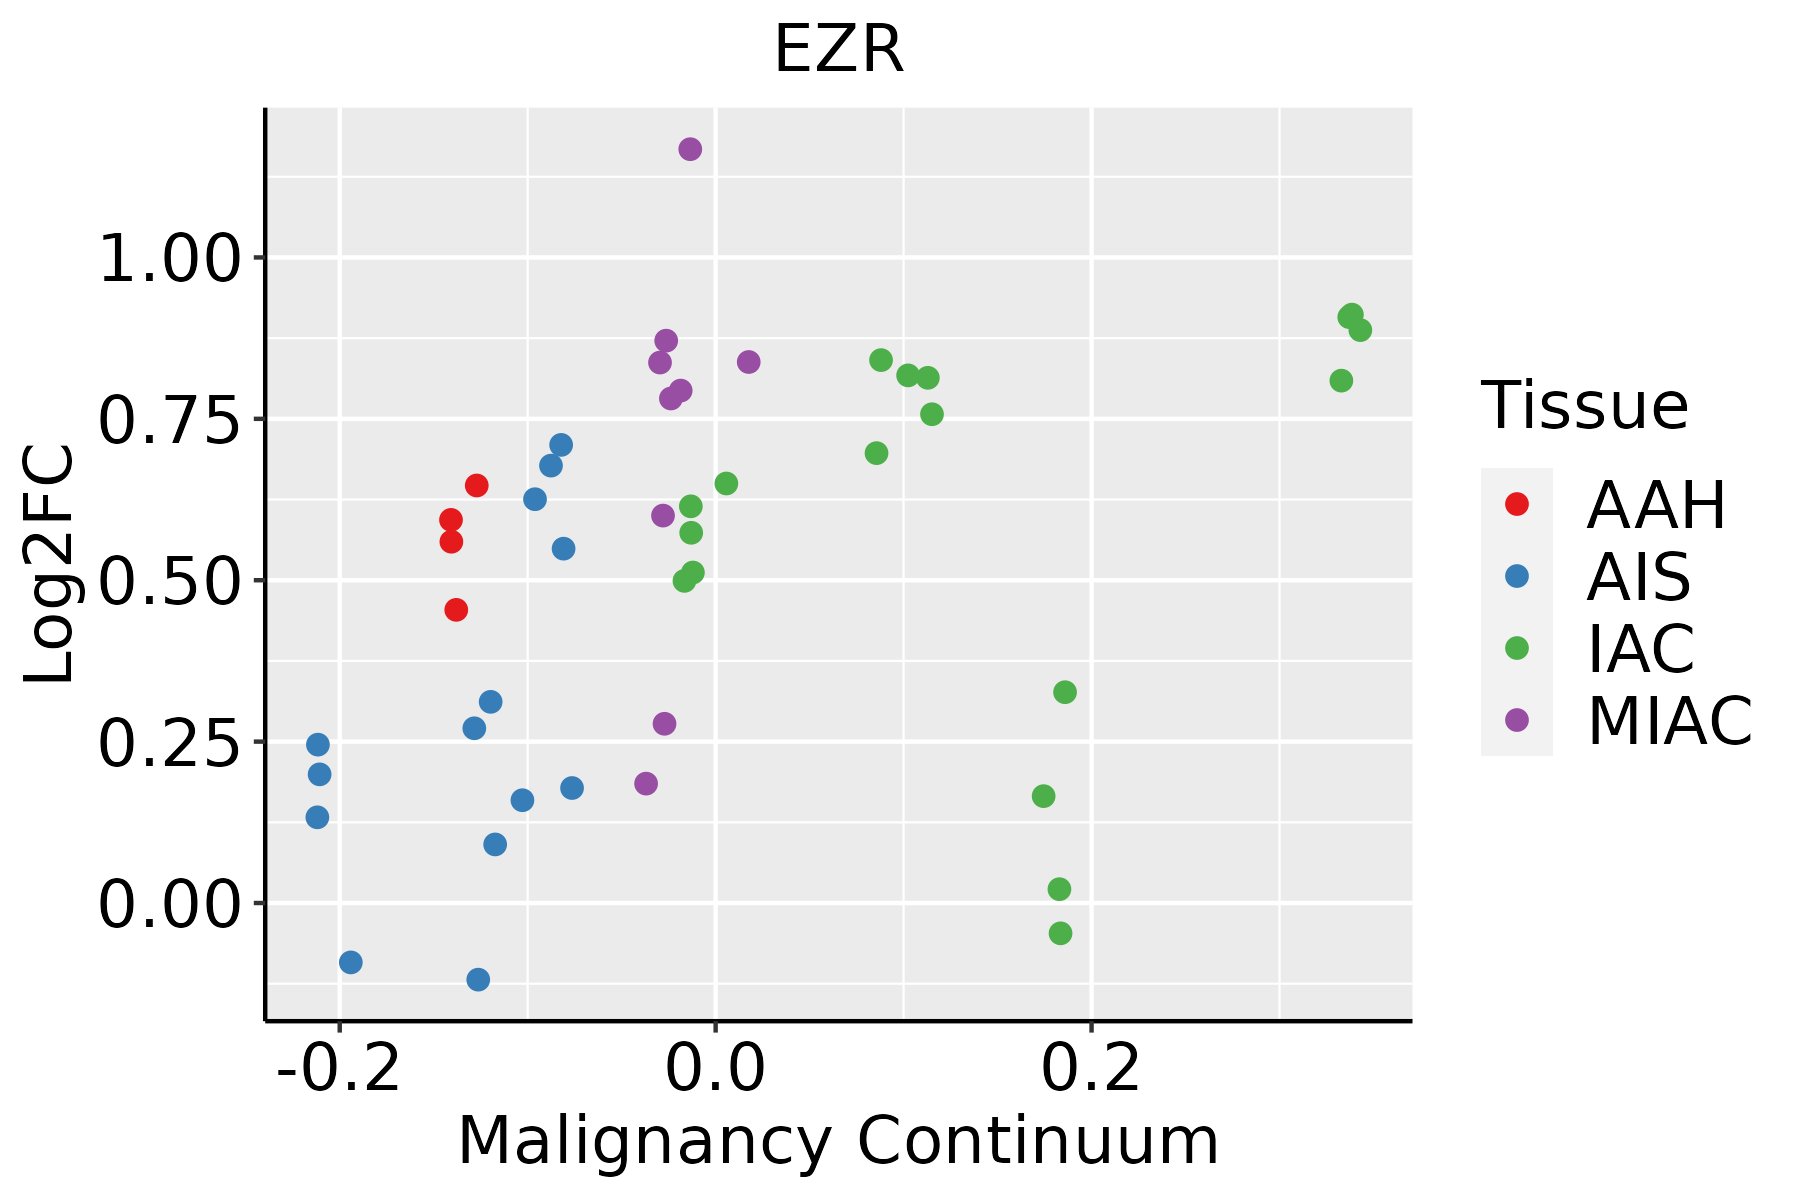 | AAH: Atypical adenomatous hyperplasia |
| AIS: Adenocarcinoma in situ | ||
| IAC: Invasive lung adenocarcinoma | ||
| MIA: Minimally invasive adenocarcinoma | ||
| Oral Cavity | 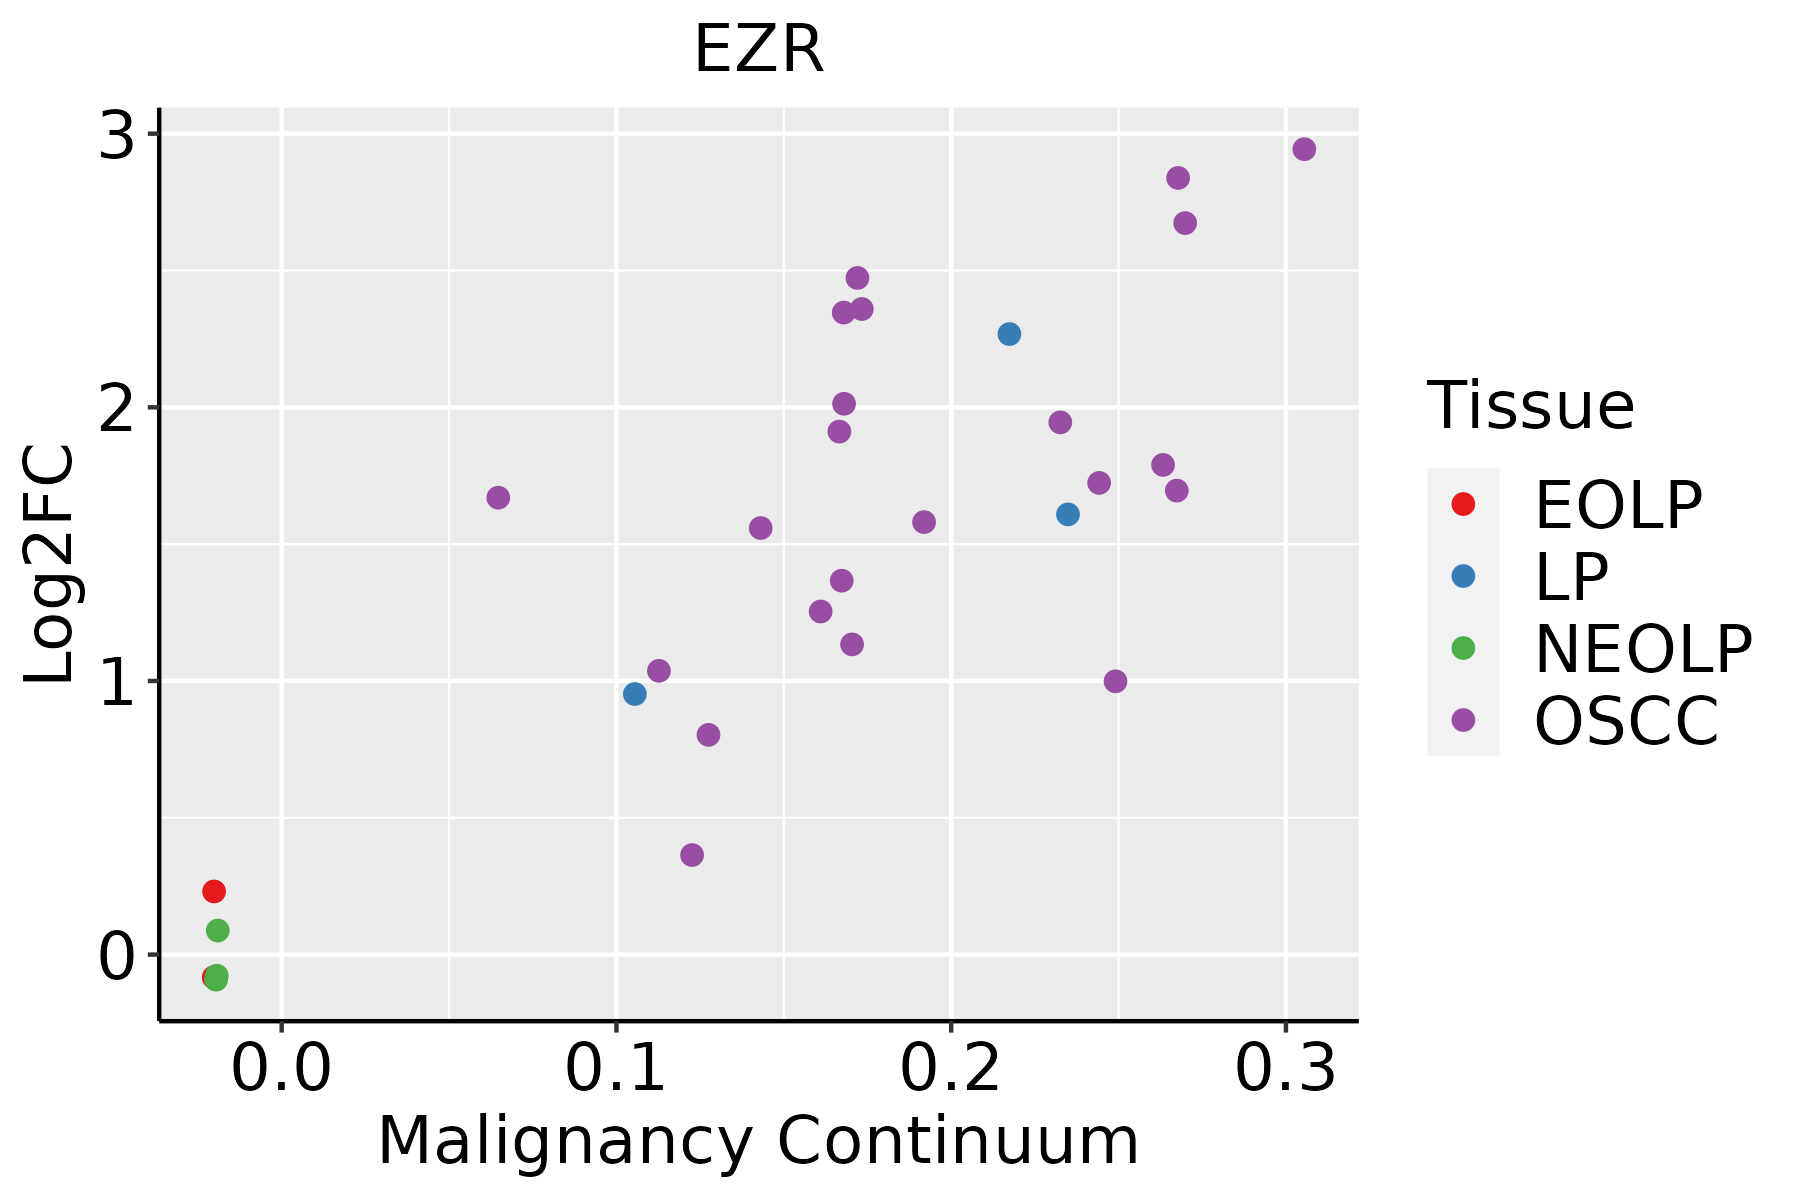 | EOLP: Erosive Oral lichen planus |
| LP: leukoplakia | ||
| NEOLP: Non-erosive oral lichen planus | ||
| OSCC: Oral squamous cell carcinoma | ||
| Prostate | 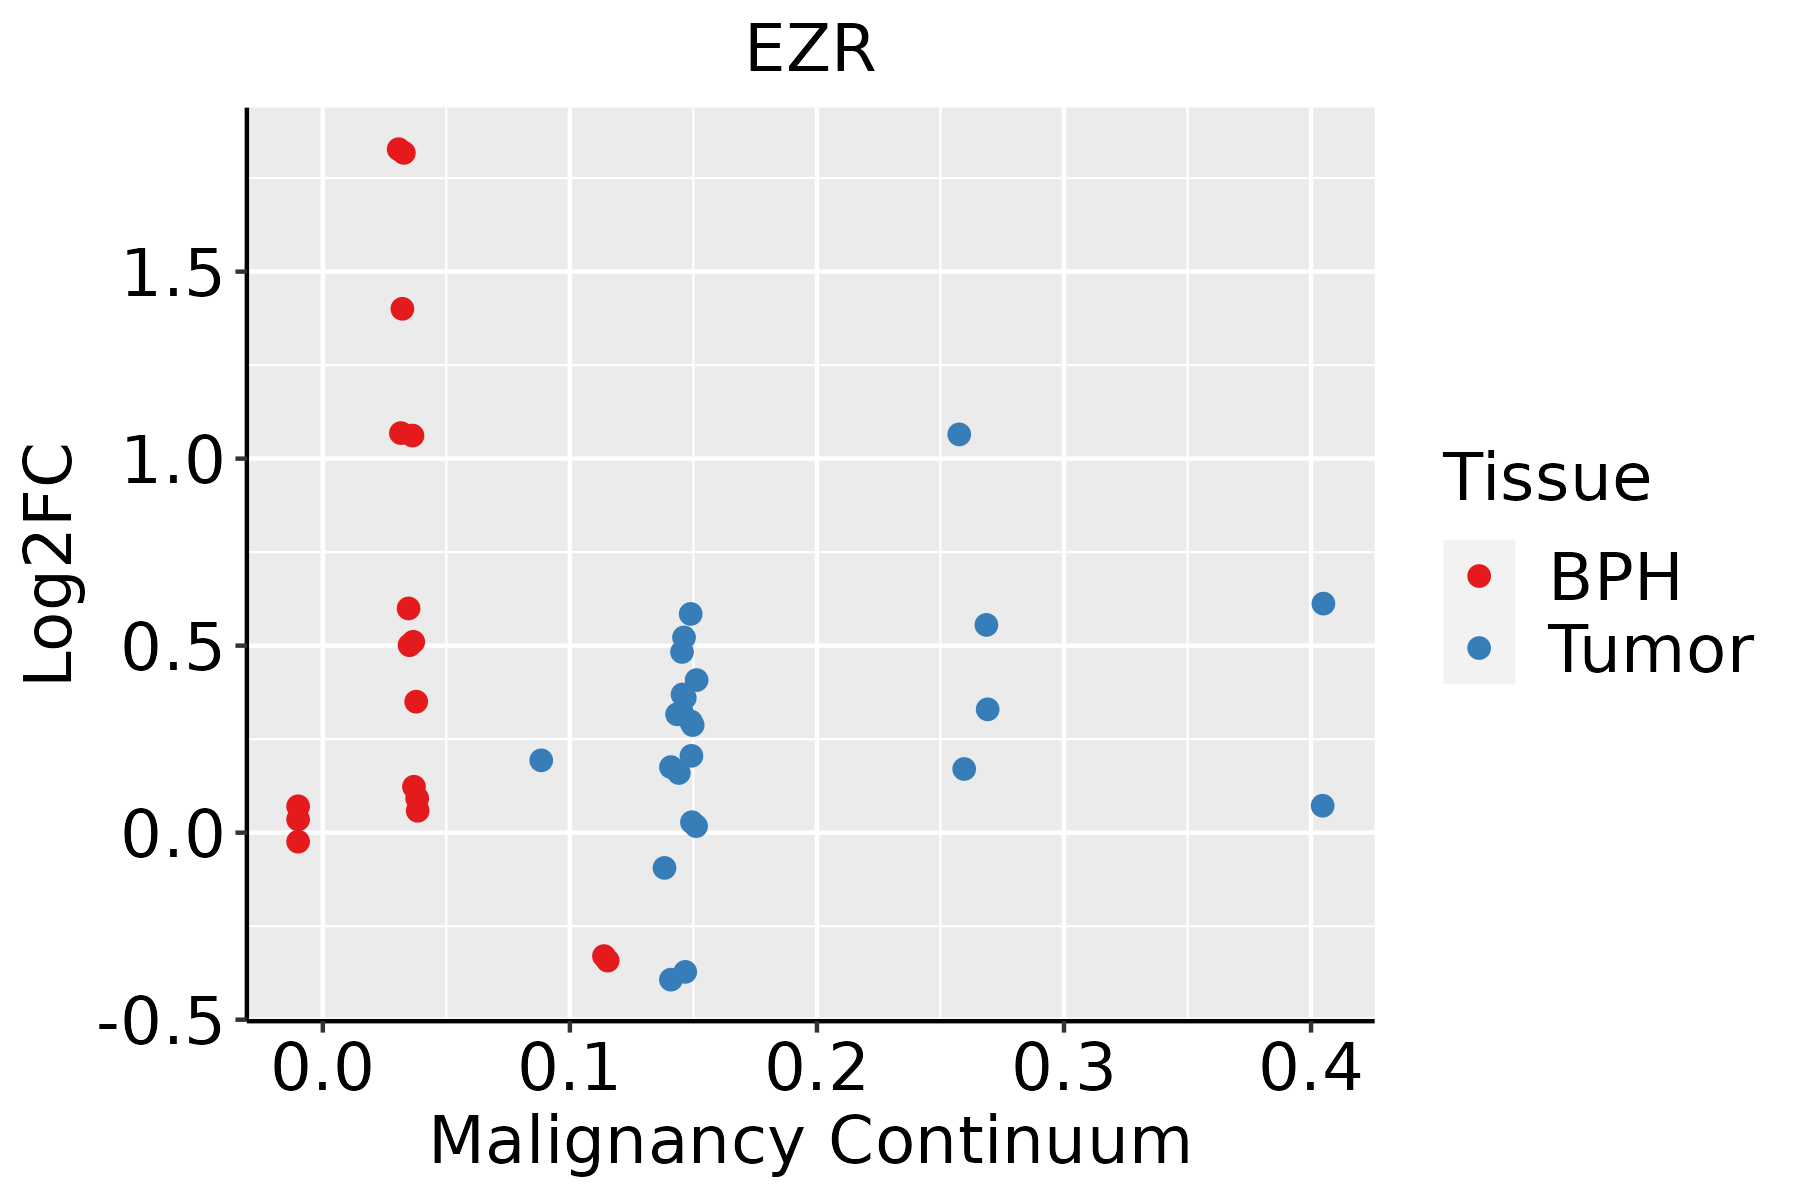 | BPH: Benign Prostatic Hyperplasia |
| Skin | 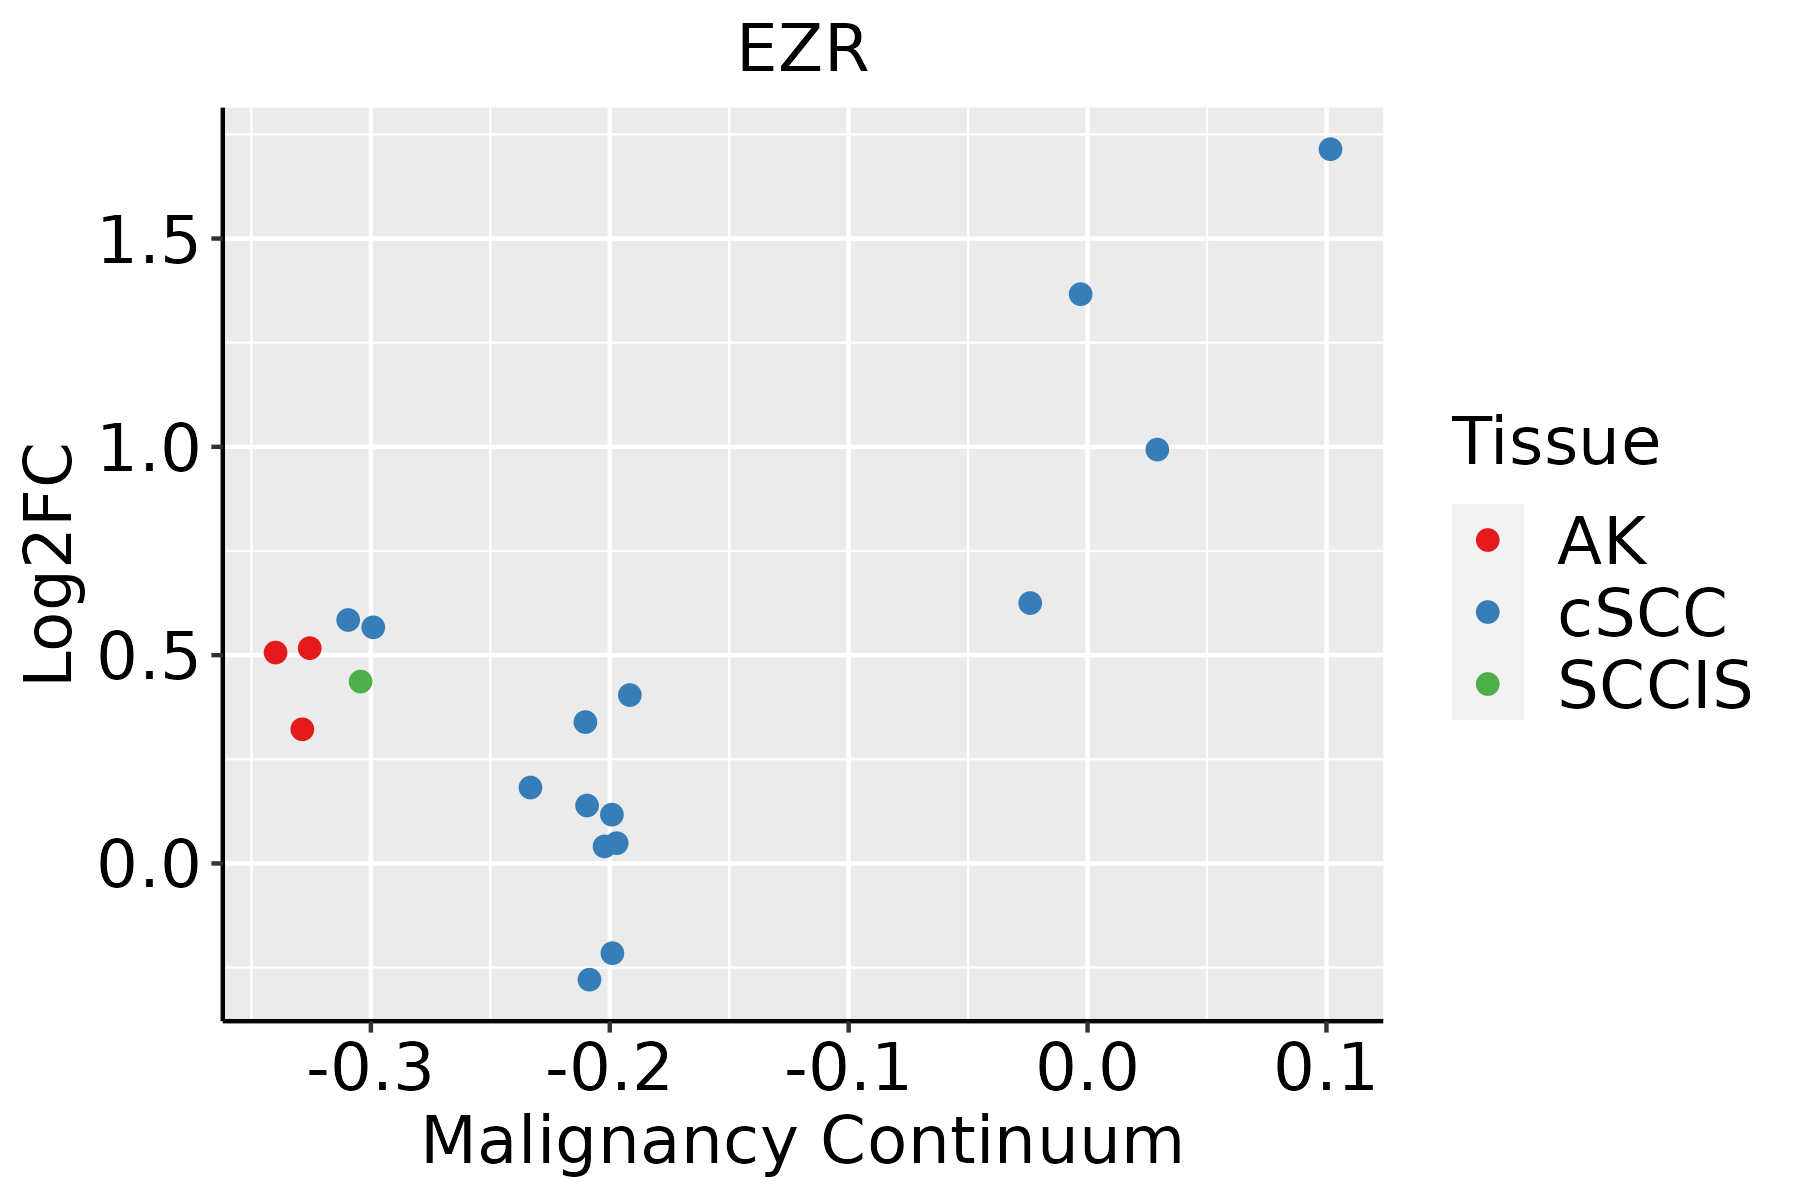 | AK: Actinic keratosis |
| cSCC: Cutaneous squamous cell carcinoma | ||
| SCCIS:squamous cell carcinoma in situ | ||
| Thyroid | 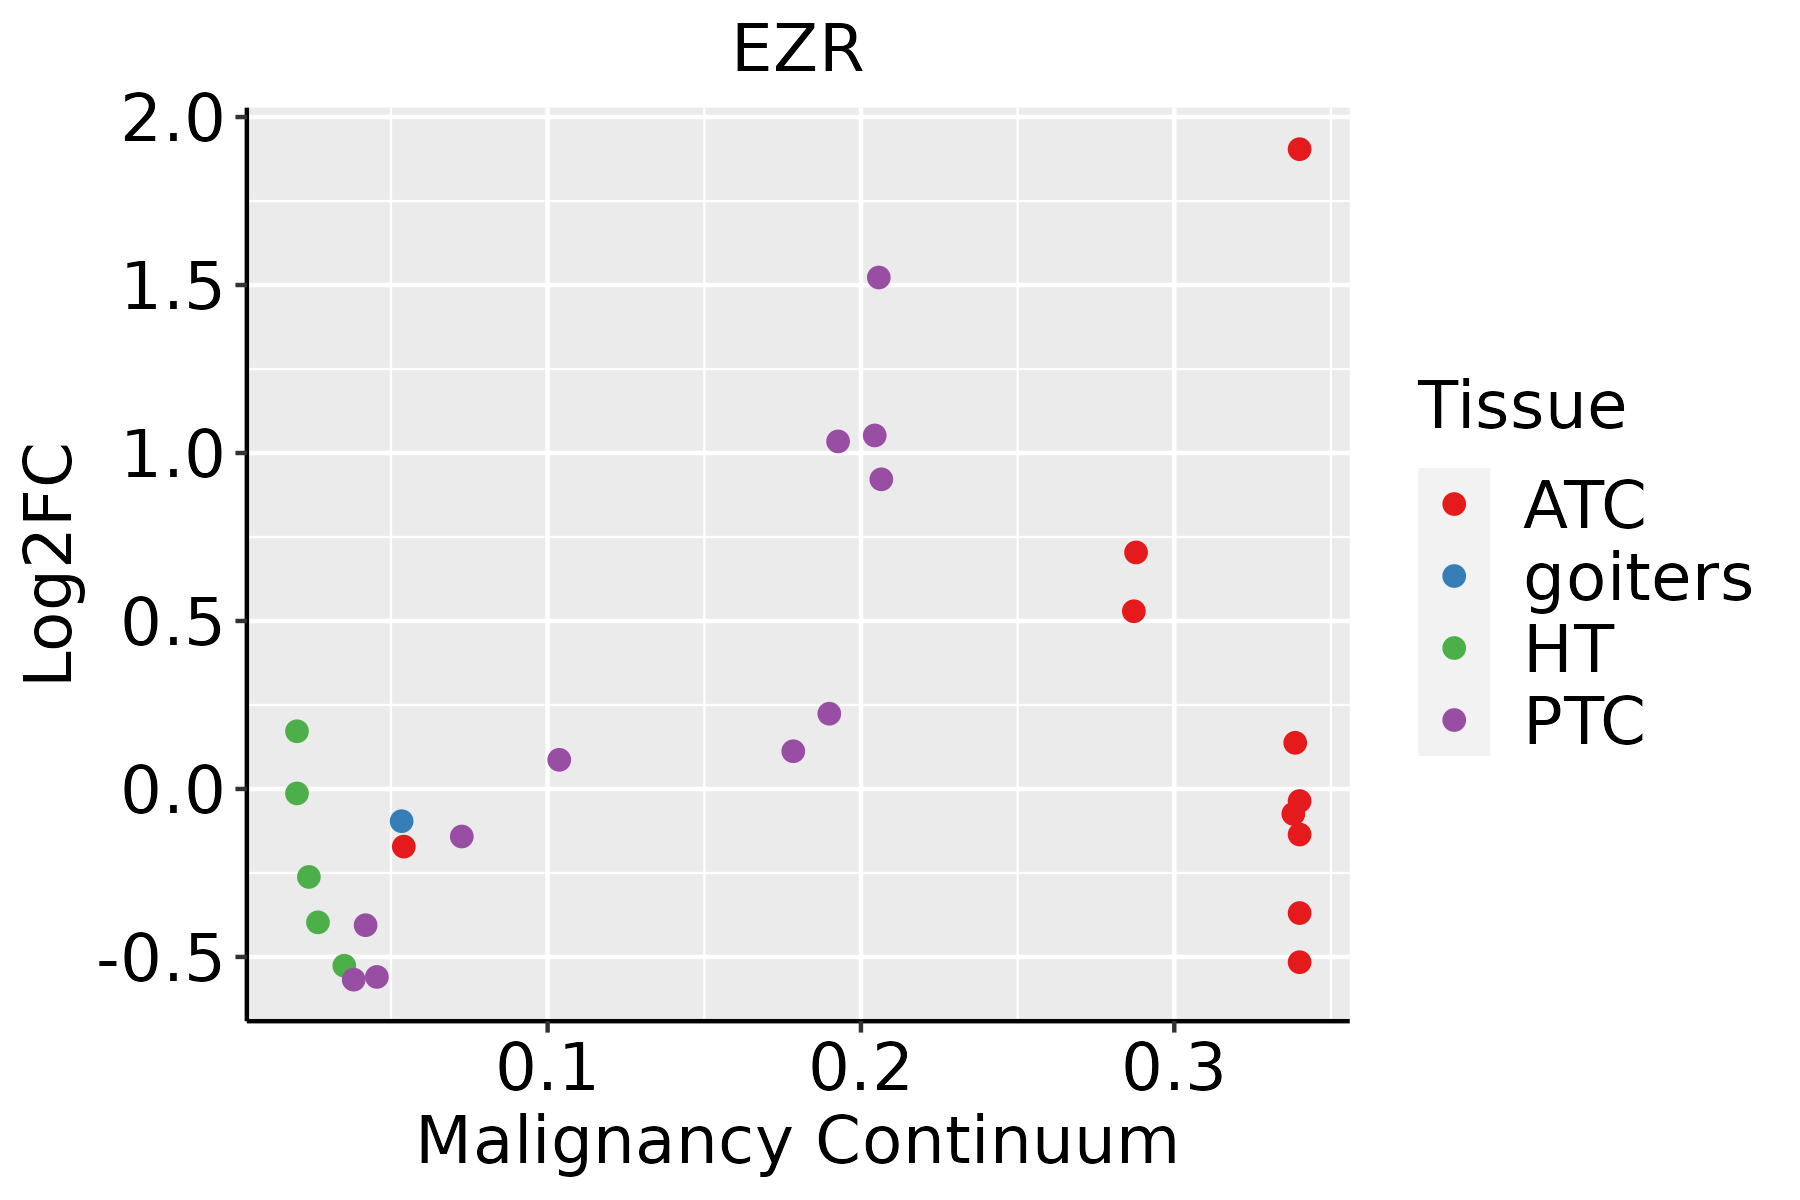 | ATC: Anaplastic thyroid cancer |
| HT: Hashimoto's thyroiditis | ||
| PTC: Papillary thyroid cancer |
| ∗log2FC in expression of this searched gene in stem-like cells from each diseased tissue sample relative to stem-like cells in normal samples in each tissue plotted against the malignancy continuum. Samples are colored based on if they are from different disease stage. |
Top |
Malignant transformation related pathway analysis |
| Find out the enriched GO biological processes and KEGG pathways involved in transition from healthy to precancer to cancer |
| Tissue | Disease Stage | Enriched GO biological Processes |
| Colorectum | AD |  |
| Colorectum | SER |  |
| Colorectum | MSS |  |
| Colorectum | MSI-H |  |
| Colorectum | FAP |  |
| ∗Top 15 enriched GO BP terms are showed in the bar plot of each disease state in each tissue. Each row represents a significant GO biological process which is colored according to the -log10(p.adjust). |
| Page: 1 2 3 4 5 6 7 8 9 |
| GO ID | Tissue | Disease Stage | Description | Gene Ratio | Bg Ratio | pvalue | p.adjust | Count |
| GO:190336451 | Stomach | SIM | positive regulation of cellular protein catabolic process | 13/708 | 155/18723 | 6.05e-03 | 4.83e-02 | 13 |
| GO:004217630 | Thyroid | HT | regulation of protein catabolic process | 70/1272 | 391/18723 | 5.96e-14 | 1.66e-11 | 70 |
| GO:190336230 | Thyroid | HT | regulation of cellular protein catabolic process | 50/1272 | 255/18723 | 7.98e-12 | 1.48e-09 | 50 |
| GO:004573230 | Thyroid | HT | positive regulation of protein catabolic process | 40/1272 | 231/18723 | 3.91e-08 | 2.65e-06 | 40 |
| GO:000715920 | Thyroid | HT | leukocyte cell-cell adhesion | 54/1272 | 371/18723 | 8.84e-08 | 5.23e-06 | 54 |
| GO:190336430 | Thyroid | HT | positive regulation of cellular protein catabolic process | 30/1272 | 155/18723 | 1.61e-07 | 8.85e-06 | 30 |
| GO:000989629 | Thyroid | HT | positive regulation of catabolic process | 63/1272 | 492/18723 | 8.49e-07 | 3.45e-05 | 63 |
| GO:003133129 | Thyroid | HT | positive regulation of cellular catabolic process | 56/1272 | 427/18723 | 1.63e-06 | 6.16e-05 | 56 |
| GO:000206427 | Thyroid | HT | epithelial cell development | 35/1272 | 220/18723 | 2.12e-06 | 7.61e-05 | 35 |
| GO:190382929 | Thyroid | HT | positive regulation of cellular protein localization | 40/1272 | 276/18723 | 4.52e-06 | 1.45e-04 | 40 |
| GO:000315820 | Thyroid | HT | endothelium development | 24/1272 | 136/18723 | 1.42e-05 | 3.57e-04 | 24 |
| GO:003109820 | Thyroid | HT | stress-activated protein kinase signaling cascade | 35/1272 | 247/18723 | 2.84e-05 | 6.14e-04 | 35 |
| GO:005140320 | Thyroid | HT | stress-activated MAPK cascade | 34/1272 | 239/18723 | 3.39e-05 | 7.11e-04 | 34 |
| GO:00022536 | Thyroid | HT | activation of immune response | 47/1272 | 375/18723 | 3.55e-05 | 7.40e-04 | 47 |
| GO:003287220 | Thyroid | HT | regulation of stress-activated MAPK cascade | 29/1272 | 192/18723 | 4.16e-05 | 8.50e-04 | 29 |
| GO:004544618 | Thyroid | HT | endothelial cell differentiation | 21/1272 | 118/18723 | 4.20e-05 | 8.56e-04 | 21 |
| GO:000268319 | Thyroid | HT | negative regulation of immune system process | 52/1272 | 434/18723 | 4.74e-05 | 9.49e-04 | 52 |
| GO:007030220 | Thyroid | HT | regulation of stress-activated protein kinase signaling cascade | 29/1272 | 195/18723 | 5.55e-05 | 1.07e-03 | 29 |
| GO:001407420 | Thyroid | HT | response to purine-containing compound | 24/1272 | 148/18723 | 5.93e-05 | 1.13e-03 | 24 |
| GO:190495127 | Thyroid | HT | positive regulation of establishment of protein localization | 41/1272 | 319/18723 | 6.22e-05 | 1.16e-03 | 41 |
| Page: 1 2 3 4 5 6 7 8 9 10 11 12 13 14 15 16 17 18 19 20 21 22 23 24 25 26 27 28 29 30 31 32 33 34 35 36 37 38 39 40 41 42 43 44 45 46 47 48 49 50 51 52 53 54 55 56 57 58 59 60 61 62 63 64 65 66 67 68 69 70 71 72 73 74 75 76 77 78 79 80 81 82 83 84 85 86 87 88 89 90 91 92 93 94 95 96 97 98 99 |
| Pathway ID | Tissue | Disease Stage | Description | Gene Ratio | Bg Ratio | pvalue | p.adjust | qvalue | Count |
| hsa0513018 | Breast | Precancer | Pathogenic Escherichia coli infection | 38/684 | 197/8465 | 3.12e-07 | 5.81e-06 | 4.45e-06 | 38 |
| hsa0453018 | Breast | Precancer | Tight junction | 31/684 | 169/8465 | 1.13e-05 | 1.26e-04 | 9.64e-05 | 31 |
| hsa0467018 | Breast | Precancer | Leukocyte transendothelial migration | 20/684 | 114/8465 | 7.26e-04 | 5.33e-03 | 4.09e-03 | 20 |
| hsa0520514 | Breast | Precancer | Proteoglycans in cancer | 30/684 | 205/8465 | 1.00e-03 | 7.18e-03 | 5.50e-03 | 30 |
| hsa0497114 | Breast | Precancer | Gastric acid secretion | 13/684 | 76/8465 | 7.35e-03 | 4.07e-02 | 3.12e-02 | 13 |
| hsa0513019 | Breast | Precancer | Pathogenic Escherichia coli infection | 38/684 | 197/8465 | 3.12e-07 | 5.81e-06 | 4.45e-06 | 38 |
| hsa0453019 | Breast | Precancer | Tight junction | 31/684 | 169/8465 | 1.13e-05 | 1.26e-04 | 9.64e-05 | 31 |
| hsa0467019 | Breast | Precancer | Leukocyte transendothelial migration | 20/684 | 114/8465 | 7.26e-04 | 5.33e-03 | 4.09e-03 | 20 |
| hsa0520515 | Breast | Precancer | Proteoglycans in cancer | 30/684 | 205/8465 | 1.00e-03 | 7.18e-03 | 5.50e-03 | 30 |
| hsa0497115 | Breast | Precancer | Gastric acid secretion | 13/684 | 76/8465 | 7.35e-03 | 4.07e-02 | 3.12e-02 | 13 |
| hsa0453024 | Breast | IDC | Tight junction | 38/867 | 169/8465 | 2.07e-06 | 3.20e-05 | 2.39e-05 | 38 |
| hsa0513024 | Breast | IDC | Pathogenic Escherichia coli infection | 42/867 | 197/8465 | 2.66e-06 | 3.92e-05 | 2.94e-05 | 42 |
| hsa0520523 | Breast | IDC | Proteoglycans in cancer | 42/867 | 205/8465 | 7.69e-06 | 9.99e-05 | 7.48e-05 | 42 |
| hsa0497122 | Breast | IDC | Gastric acid secretion | 16/867 | 76/8465 | 3.80e-03 | 2.33e-02 | 1.74e-02 | 16 |
| hsa0467024 | Breast | IDC | Leukocyte transendothelial migration | 21/867 | 114/8465 | 5.41e-03 | 3.13e-02 | 2.34e-02 | 21 |
| hsa0481014 | Breast | IDC | Regulation of actin cytoskeleton | 36/867 | 229/8465 | 5.79e-03 | 3.13e-02 | 2.34e-02 | 36 |
| hsa0453034 | Breast | IDC | Tight junction | 38/867 | 169/8465 | 2.07e-06 | 3.20e-05 | 2.39e-05 | 38 |
| hsa0513034 | Breast | IDC | Pathogenic Escherichia coli infection | 42/867 | 197/8465 | 2.66e-06 | 3.92e-05 | 2.94e-05 | 42 |
| hsa0520533 | Breast | IDC | Proteoglycans in cancer | 42/867 | 205/8465 | 7.69e-06 | 9.99e-05 | 7.48e-05 | 42 |
| hsa0497132 | Breast | IDC | Gastric acid secretion | 16/867 | 76/8465 | 3.80e-03 | 2.33e-02 | 1.74e-02 | 16 |
| Page: 1 2 3 4 5 6 7 8 9 10 11 12 13 14 15 |
Top |
Cell-cell communication analysis |
| Identification of potential cell-cell interactions between two cell types and their ligand-receptor pairs for different disease states |
| Ligand | Receptor | LRpair | Pathway | Tissue | Disease Stage |
| Page: 1 |
Top |
Single-cell gene regulatory network inference analysis |
| Find out the significant the regulons (TFs) and the target genes of each regulon across cell types for different disease states |
| TF | Cell Type | Tissue | Disease Stage | Target Gene | RSS | Regulon Activity |
| EZR | FIB | Breast | ADJ | ACAP1,NEDD4L,CDH1, etc. | 4.36e-02 |  |
| EZR | CAF | Breast | ADJ | ACAP1,NEDD4L,CDH1, etc. | 1.08e-01 | |
| EZR | INCAF | Breast | ADJ | ACAP1,NEDD4L,CDH1, etc. | 3.21e-02 | |
| EZR | PERI | Breast | Precancer | ACAP1,NEDD4L,CDH1, etc. | 3.58e-02 |  |
| EZR | MSC | Oral cavity | ADJ | SLPI,ANXA1,CXCR4, etc. | 2.38e-01 |  |
| EZR | MSC | Oral cavity | EOLP | SLPI,ANXA1,CXCR4, etc. | 2.40e-01 |  |
| EZR | MSC.MVA | Oral cavity | EOLP | SLPI,ANXA1,CXCR4, etc. | 1.85e-02 | |
| EZR | MSC | Oral cavity | Healthy | SLPI,ANXA1,CXCR4, etc. | 9.17e-02 |  |
| EZR | MSC.MVA | Oral cavity | Healthy | SLPI,ANXA1,CXCR4, etc. | 3.79e-02 | |
| EZR | MSC | Oral cavity | LP | SLPI,ANXA1,CXCR4, etc. | 3.86e-01 |  |
| ∗The dot plots of a searched regulon are shown for all cell subpopulations in each disease state of each tissue based on the regulon specific score inferred using pySCENIC and by calculating the average expression. |
| Page: 1 2 |
Top |
Somatic mutation of malignant transformation related genes |
| Annotation of somatic variants for genes involved in malignant transformation |
| Hugo Symbol | Variant Class | Variant Classification | dbSNP RS | HGVSc | HGVSp | HGVSp Short | SWISSPROT | BIOTYPE | SIFT | PolyPhen | Tumor Sample Barcode | Tissue | Histology | Sex | Age | Stage | Therapy Types | Drugs | Outcome |
| EZR | SNV | Missense_Mutation | c.1140N>T | p.Lys380Asn | p.K380N | P15311 | protein_coding | deleterious(0.04) | possibly_damaging(0.456) | TCGA-A1-A0SO-01 | Breast | breast invasive carcinoma | Female | >=65 | I/II | Chemotherapy | SD | ||
| EZR | SNV | Missense_Mutation | c.746C>T | p.Ser249Phe | p.S249F | P15311 | protein_coding | deleterious(0) | probably_damaging(0.998) | TCGA-C8-A1HE-01 | Breast | breast invasive carcinoma | Female | <65 | I/II | Unknown | Unknown | SD | |
| EZR | SNV | Missense_Mutation | rs528409234 | c.385G>A | p.Ala129Thr | p.A129T | P15311 | protein_coding | deleterious(0) | probably_damaging(0.993) | TCGA-2W-A8YY-01 | Cervix | cervical & endocervical cancer | Female | <65 | I/II | Chemotherapy | cisplatin | CR |
| EZR | SNV | Missense_Mutation | novel | c.1685N>A | p.Arg562Gln | p.R562Q | P15311 | protein_coding | deleterious(0.01) | possibly_damaging(0.903) | TCGA-EA-A3HU-01 | Cervix | cervical & endocervical cancer | Female | <65 | I/II | Unknown | Unknown | SD |
| EZR | SNV | Missense_Mutation | c.1381N>A | p.Glu461Lys | p.E461K | P15311 | protein_coding | tolerated(0.18) | benign(0.201) | TCGA-EK-A2RK-01 | Cervix | cervical & endocervical cancer | Female | >=65 | I/II | Unknown | Unknown | SD | |
| EZR | SNV | Missense_Mutation | c.1084N>A | p.Glu362Lys | p.E362K | P15311 | protein_coding | tolerated(0.12) | benign(0.217) | TCGA-EK-A3GK-01 | Cervix | cervical & endocervical cancer | Female | <65 | I/II | Unknown | Unknown | SD | |
| EZR | SNV | Missense_Mutation | c.1281N>T | p.Lys427Asn | p.K427N | P15311 | protein_coding | tolerated(0.06) | benign(0.033) | TCGA-FU-A3HZ-01 | Cervix | cervical & endocervical cancer | Female | <65 | I/II | Chemotherapy | cisplatin | CR | |
| EZR | SNV | Missense_Mutation | c.77G>A | p.Gly26Glu | p.G26E | P15311 | protein_coding | deleterious(0) | probably_damaging(0.998) | TCGA-Q1-A73O-01 | Cervix | cervical & endocervical cancer | Female | <65 | I/II | Chemotherapy | cisplatin | CR | |
| EZR | SNV | Missense_Mutation | c.380C>T | p.Ser127Phe | p.S127F | P15311 | protein_coding | deleterious(0) | probably_damaging(1) | TCGA-5M-AAT6-01 | Colorectum | colon adenocarcinoma | Female | <65 | III/IV | Unknown | Unknown | PD | |
| EZR | SNV | Missense_Mutation | rs369743003 | c.241N>T | p.Arg81Trp | p.R81W | P15311 | protein_coding | deleterious(0.01) | probably_damaging(0.994) | TCGA-AA-3984-01 | Colorectum | colon adenocarcinoma | Female | <65 | I/II | Unknown | Unknown | SD |
| Page: 1 2 3 4 5 |
Top |
Related drugs of malignant transformation related genes |
| Identification of chemicals and drugs interact with genes involved in malignant transfromation |
| (DGIdb 4.0) |
| Entrez ID | Symbol | Category | Interaction Types | Drug Claim Name | Drug Name | PMIDs |
| 7430 | EZR | CLINICALLY ACTIONABLE, KINASE | TNF-ALPHA | 15965500 | ||
| 7430 | EZR | CLINICALLY ACTIONABLE, KINASE | RO 31-8220 | 9124348 |
| Page: 1 |

Copyright 2023-Present -The University of Texas Health Science Center at Houston |