
|
|||||
|
 | |
| |
| |
| |
| |
| |
|
Gene: APOE |
Gene summary for APOE |
| Gene information | Species | Human | Gene symbol | APOE | Gene ID | 348 |
| Gene name | apolipoprotein E | |
| Gene Alias | AD2 | |
| Cytomap | 19q13.32 | |
| Gene Type | protein-coding | GO ID | GO:0000165 | UniProtAcc | A0A0S2Z3D5 |
Top |
Malignant transformation analysis |
| Identification of the aberrant gene expression in precancerous and cancerous lesions by comparing the gene expression of stem-like cells in diseased tissues with normal stem cells |
| Entrez ID | Symbol | Replicates | Species | Organ | Tissue | Adj P-value | Log2FC | Malignancy |
| 348 | APOE | GSM4909281 | Human | Breast | IDC | 8.80e-42 | 9.22e-01 | 0.21 |
| 348 | APOE | GSM4909285 | Human | Breast | IDC | 1.34e-08 | 3.05e-01 | 0.21 |
| 348 | APOE | GSM4909293 | Human | Breast | IDC | 3.22e-08 | -2.39e-01 | 0.1581 |
| 348 | APOE | GSM4909295 | Human | Breast | IDC | 3.40e-02 | 3.39e-01 | 0.0898 |
| 348 | APOE | GSM4909296 | Human | Breast | IDC | 2.47e-04 | -2.22e-01 | 0.1524 |
| 348 | APOE | GSM4909297 | Human | Breast | IDC | 5.55e-07 | -2.39e-01 | 0.1517 |
| 348 | APOE | GSM4909299 | Human | Breast | IDC | 1.11e-08 | 5.00e-01 | 0.035 |
| 348 | APOE | GSM4909302 | Human | Breast | IDC | 1.27e-04 | 3.13e-01 | 0.1545 |
| 348 | APOE | GSM4909309 | Human | Breast | IDC | 7.67e-06 | 3.72e-01 | 0.0483 |
| 348 | APOE | GSM4909311 | Human | Breast | IDC | 2.02e-07 | -2.01e-01 | 0.1534 |
| 348 | APOE | GSM4909312 | Human | Breast | IDC | 7.71e-11 | -2.65e-01 | 0.1552 |
| 348 | APOE | GSM4909315 | Human | Breast | IDC | 5.71e-08 | -2.59e-01 | 0.21 |
| 348 | APOE | GSM4909319 | Human | Breast | IDC | 5.14e-08 | 3.05e-02 | 0.1563 |
| 348 | APOE | GSM4909321 | Human | Breast | IDC | 2.05e-08 | -2.64e-01 | 0.1559 |
| 348 | APOE | NCCBC14 | Human | Breast | DCIS | 1.43e-24 | 1.00e+00 | 0.2021 |
| 348 | APOE | NCCBC2 | Human | Breast | DCIS | 2.85e-05 | 6.98e-01 | 0.1554 |
| 348 | APOE | NCCBC3 | Human | Breast | DCIS | 2.21e-44 | 1.08e+00 | 0.1198 |
| 348 | APOE | NCCBC5 | Human | Breast | DCIS | 1.30e-09 | 5.49e-01 | 0.2046 |
| 348 | APOE | P1 | Human | Breast | IDC | 1.21e-03 | 2.27e-01 | 0.1527 |
| 348 | APOE | DCIS2 | Human | Breast | DCIS | 1.29e-08 | -4.91e-02 | 0.0085 |
| Page: 1 2 3 4 5 6 7 8 9 |
| Tissue | Expression Dynamics | Abbreviation |
| Breast |  | IDC: Invasive ductal carcinoma |
| DCIS: Ductal carcinoma in situ | ||
| Precancer(BRCA1-mut): Precancerous lesion from BRCA1 mutation carriers | ||
| Endometrium | 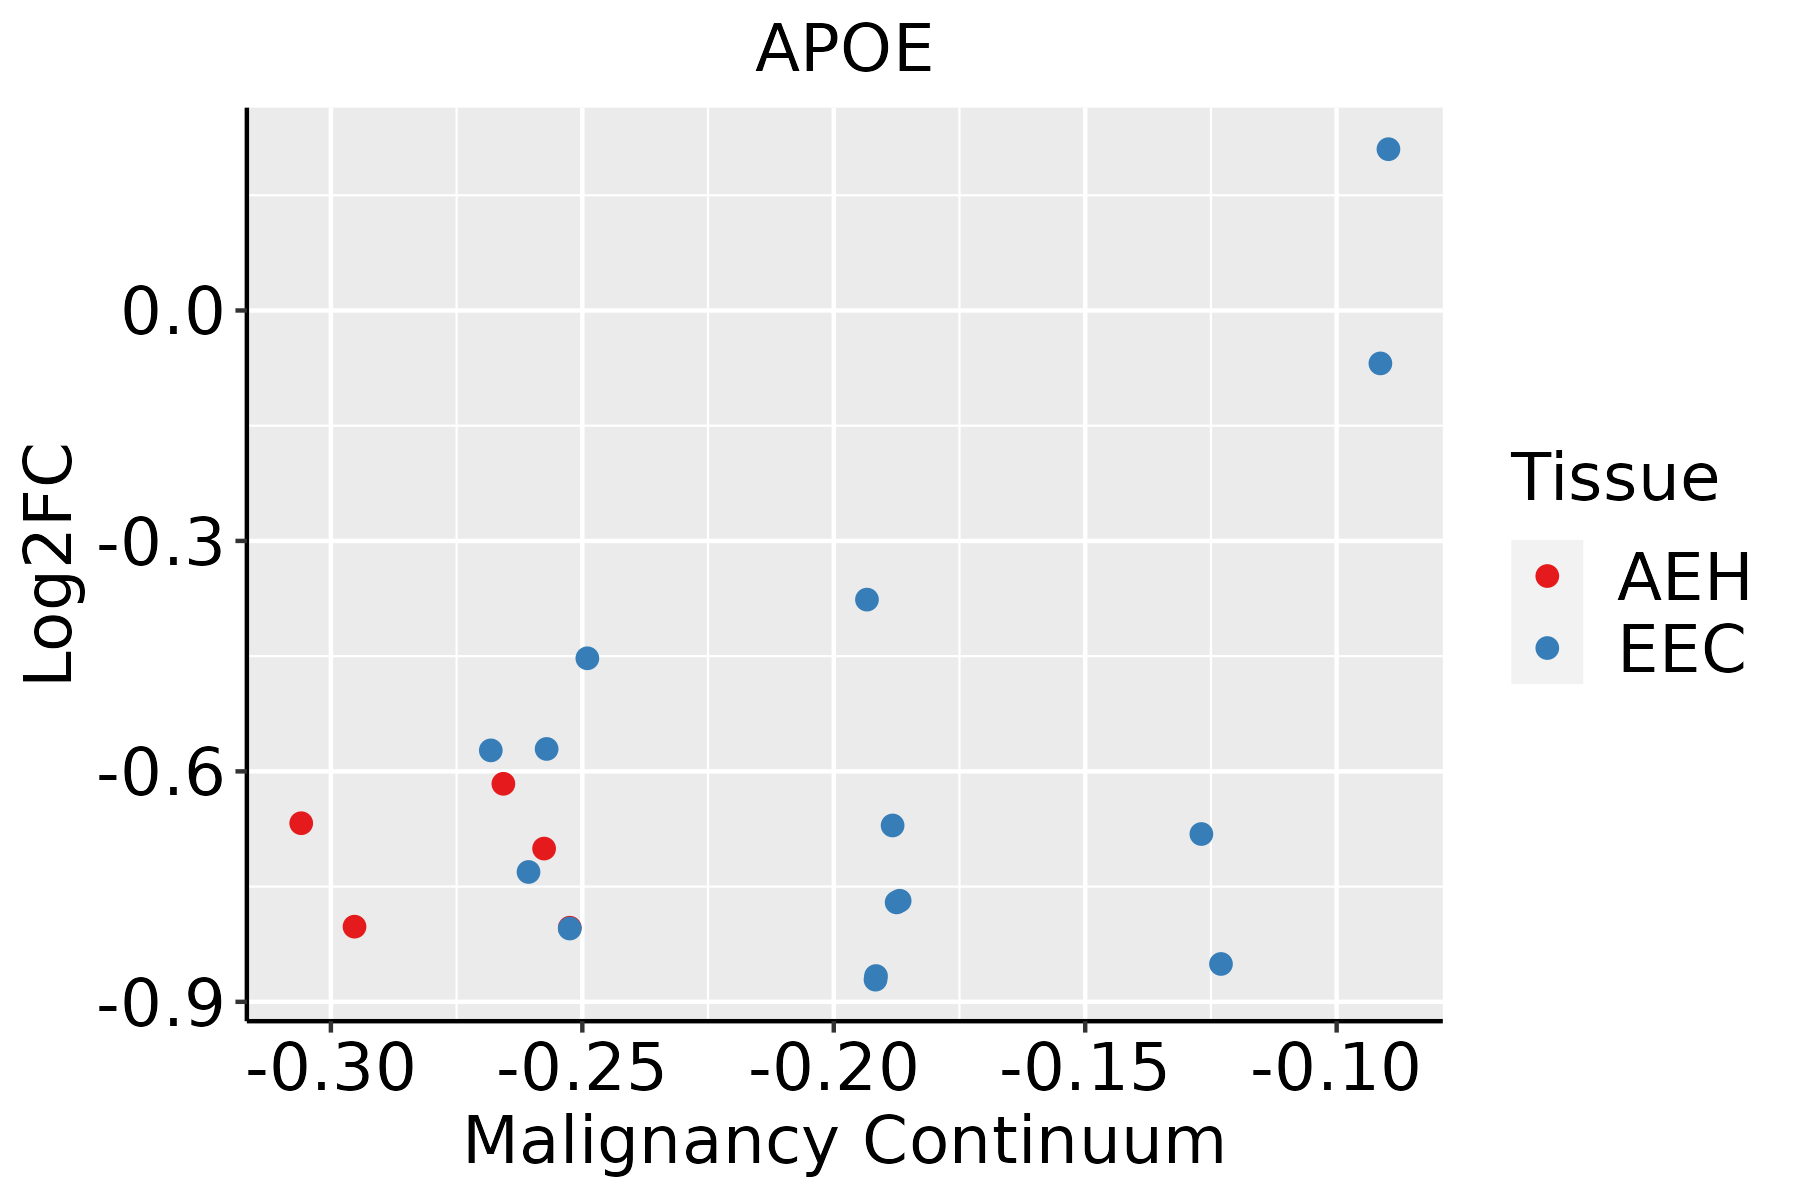 | AEH: Atypical endometrial hyperplasia |
| EEC: Endometrioid Cancer | ||
| Esophagus |  | ESCC: Esophageal squamous cell carcinoma |
| HGIN: High-grade intraepithelial neoplasias | ||
| LGIN: Low-grade intraepithelial neoplasias | ||
| Liver |  | HCC: Hepatocellular carcinoma |
| NAFLD: Non-alcoholic fatty liver disease | ||
| Oral Cavity | 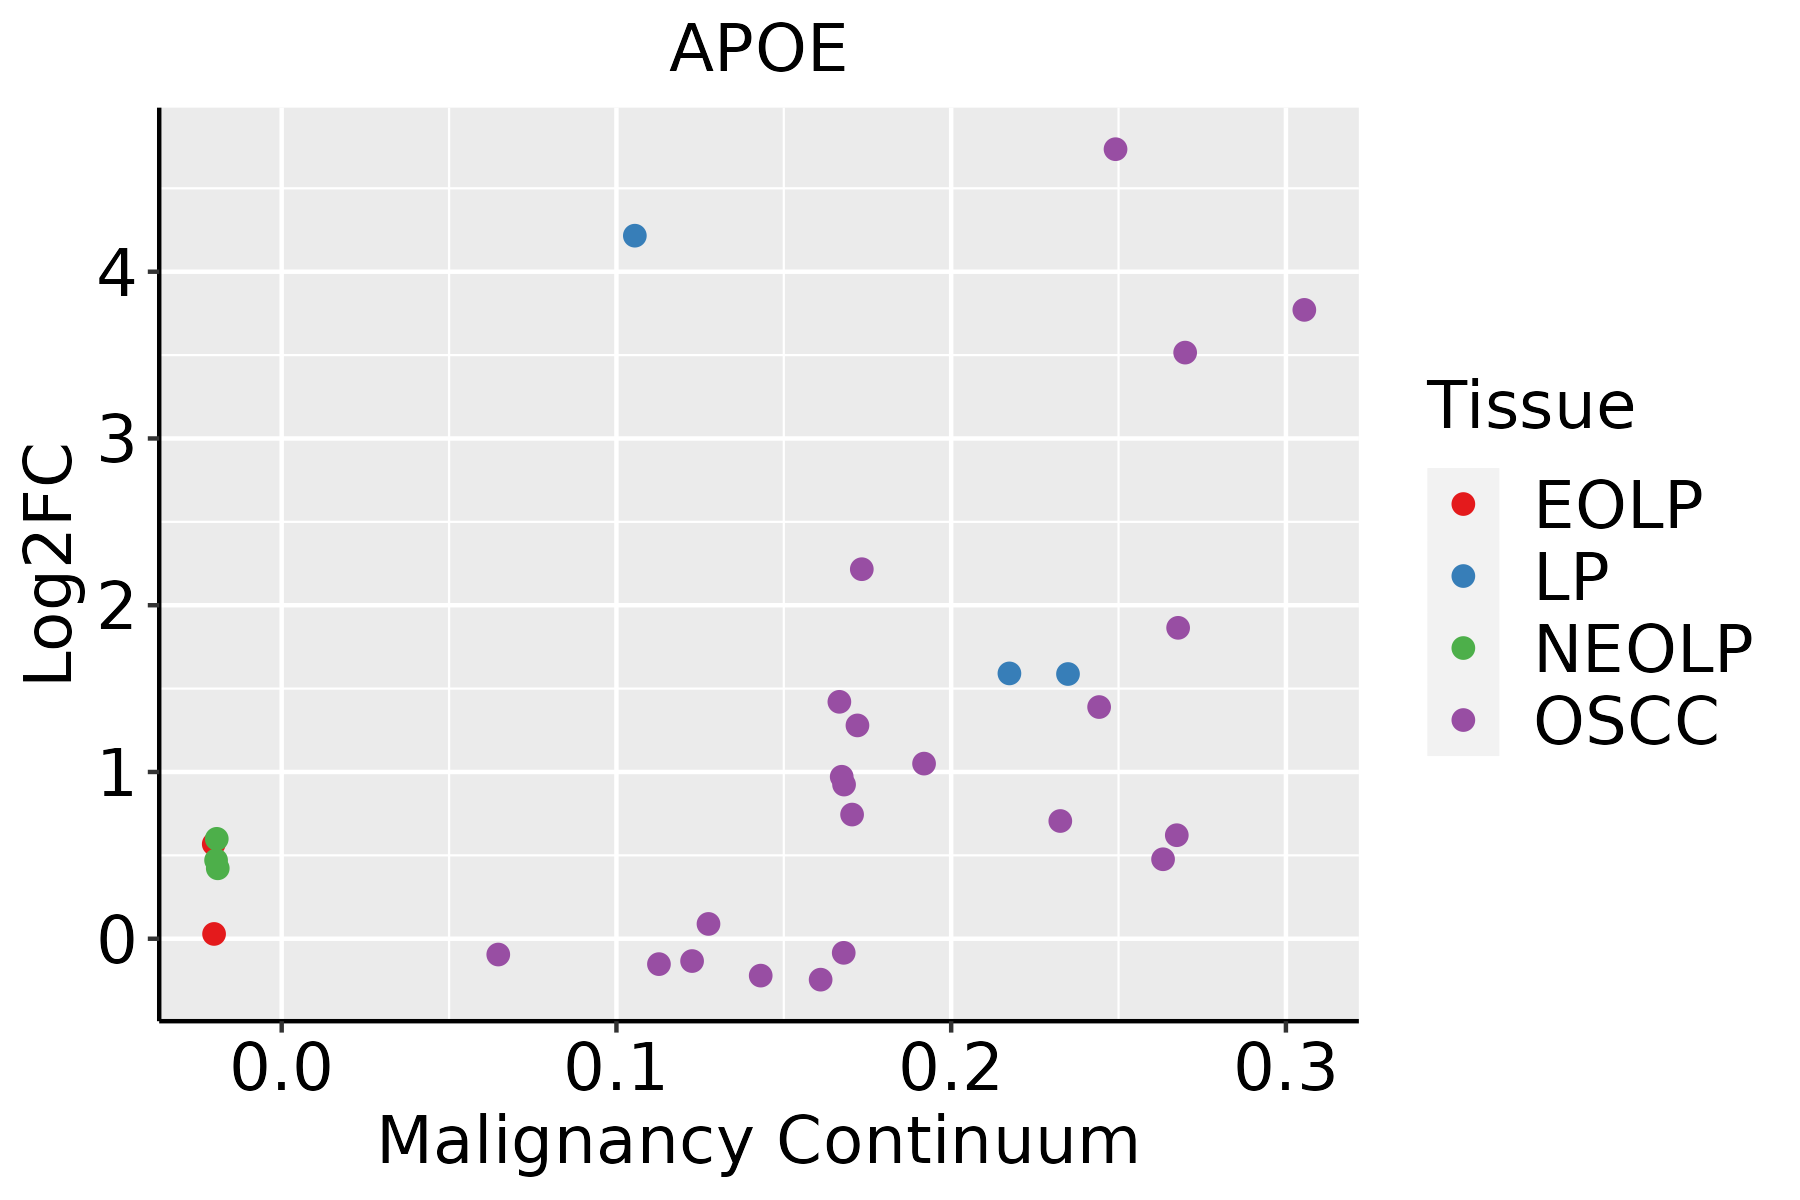 | EOLP: Erosive Oral lichen planus |
| LP: leukoplakia | ||
| NEOLP: Non-erosive oral lichen planus | ||
| OSCC: Oral squamous cell carcinoma | ||
| Prostate |  | BPH: Benign Prostatic Hyperplasia |
| Skin | 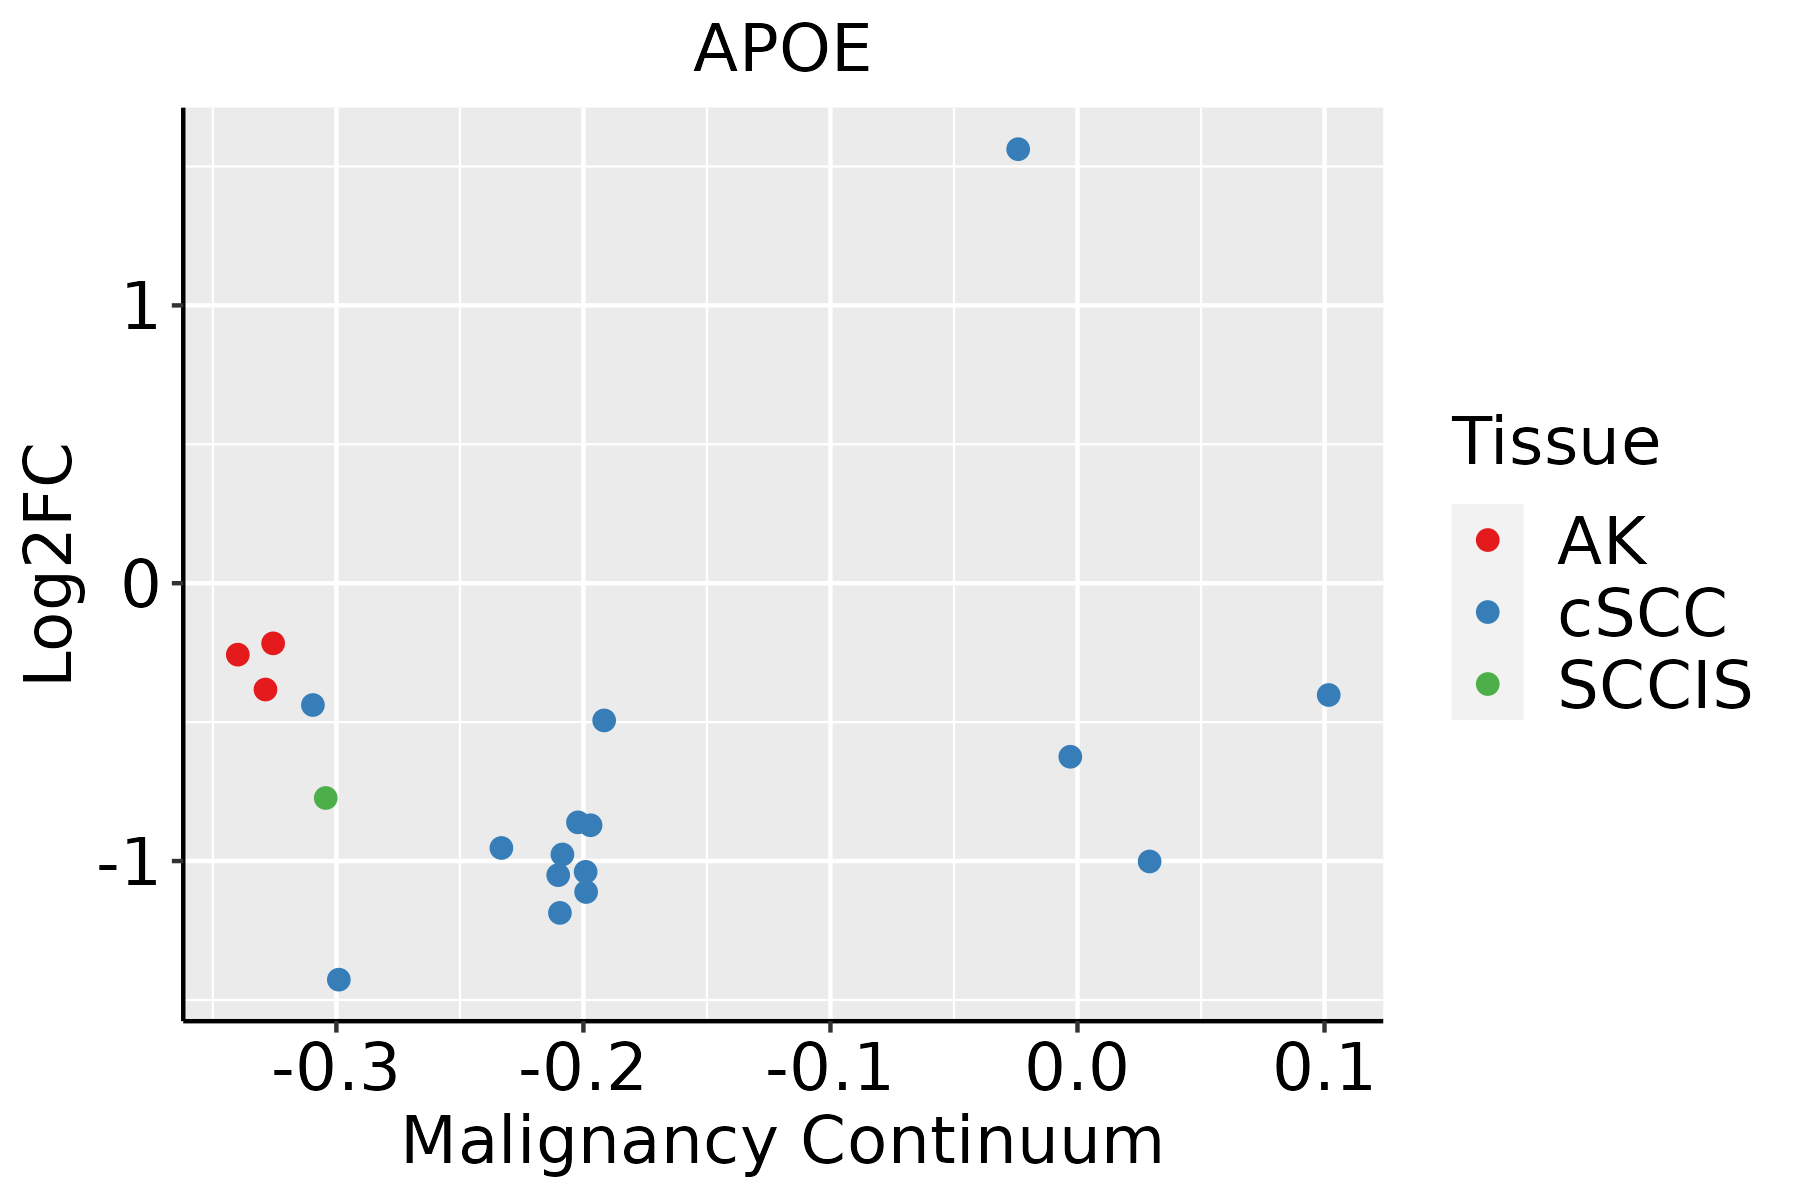 | AK: Actinic keratosis |
| cSCC: Cutaneous squamous cell carcinoma | ||
| SCCIS:squamous cell carcinoma in situ | ||
| Thyroid | 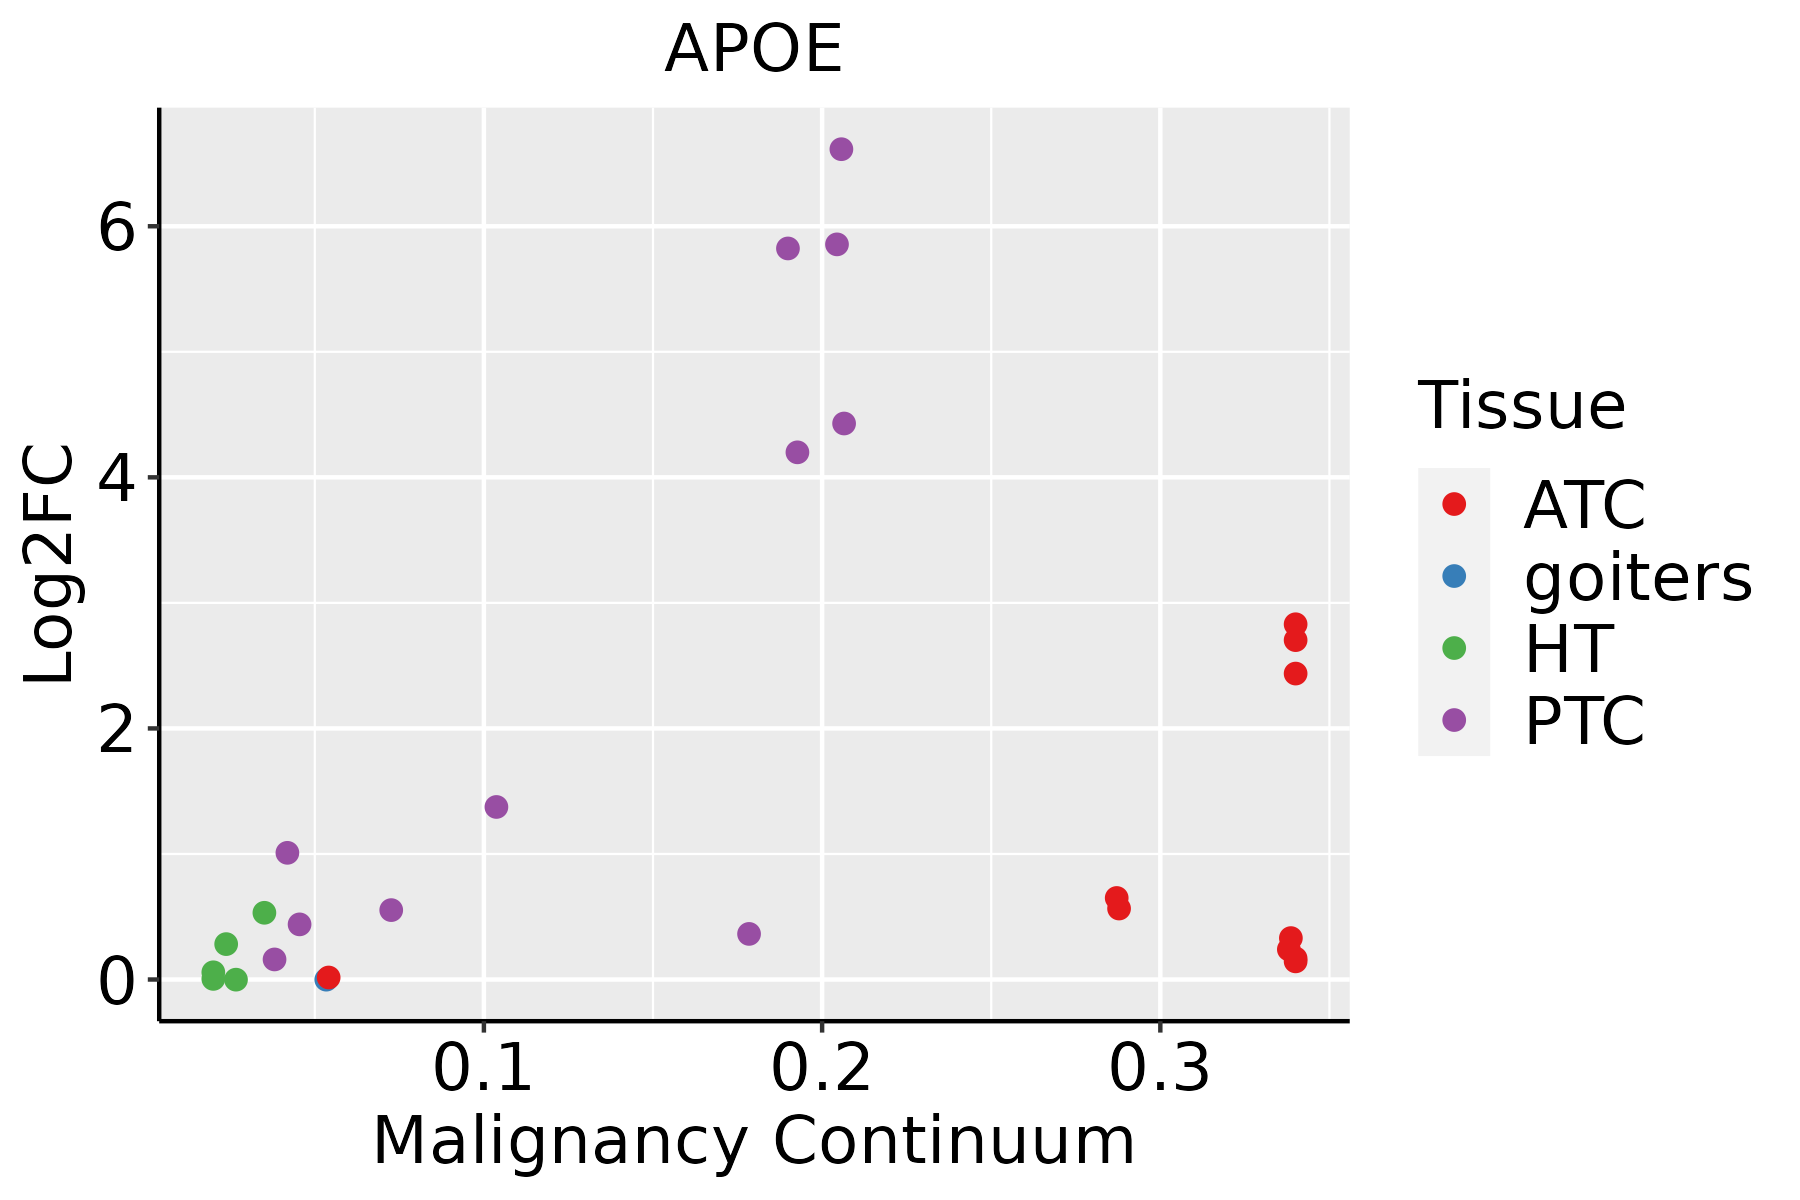 | ATC: Anaplastic thyroid cancer |
| HT: Hashimoto's thyroiditis | ||
| PTC: Papillary thyroid cancer |
| ∗log2FC in expression of this searched gene in stem-like cells from each diseased tissue sample relative to stem-like cells in normal samples in each tissue plotted against the malignancy continuum. Samples are colored based on if they are from different disease stage. |
Top |
Malignant transformation related pathway analysis |
| Find out the enriched GO biological processes and KEGG pathways involved in transition from healthy to precancer to cancer |
| Tissue | Disease Stage | Enriched GO biological Processes |
| Colorectum | AD |  |
| Colorectum | SER |  |
| Colorectum | MSS |  |
| Colorectum | MSI-H |  |
| Colorectum | FAP |  |
| ∗Top 15 enriched GO BP terms are showed in the bar plot of each disease state in each tissue. Each row represents a significant GO biological process which is colored according to the -log10(p.adjust). |
| Page: 1 2 3 4 5 6 7 8 9 |
| GO ID | Tissue | Disease Stage | Description | Gene Ratio | Bg Ratio | pvalue | p.adjust | Count |
| GO:004298711 | Prostate | Tumor | amyloid precursor protein catabolic process | 22/3246 | 68/18723 | 1.87e-03 | 1.10e-02 | 22 |
| GO:004866014 | Prostate | Tumor | regulation of smooth muscle cell proliferation | 47/3246 | 180/18723 | 1.95e-03 | 1.13e-02 | 47 |
| GO:003300211 | Prostate | Tumor | muscle cell proliferation | 61/3246 | 248/18723 | 2.26e-03 | 1.28e-02 | 61 |
| GO:00342051 | Prostate | Tumor | amyloid-beta formation | 19/3246 | 57/18723 | 2.54e-03 | 1.41e-02 | 19 |
| GO:004352315 | Prostate | Tumor | regulation of neuron apoptotic process | 53/3246 | 212/18723 | 2.92e-03 | 1.58e-02 | 53 |
| GO:004865914 | Prostate | Tumor | smooth muscle cell proliferation | 47/3246 | 184/18723 | 3.12e-03 | 1.64e-02 | 47 |
| GO:00609991 | Prostate | Tumor | positive regulation of dendritic spine development | 15/3246 | 42/18723 | 3.32e-03 | 1.73e-02 | 15 |
| GO:000836112 | Prostate | Tumor | regulation of cell size | 46/3246 | 181/18723 | 3.81e-03 | 1.94e-02 | 46 |
| GO:003134512 | Prostate | Tumor | negative regulation of cell projection organization | 47/3246 | 186/18723 | 3.91e-03 | 1.99e-02 | 47 |
| GO:00517028 | Prostate | Tumor | biological process involved in interaction with symbiont | 27/3246 | 94/18723 | 4.22e-03 | 2.11e-02 | 27 |
| GO:001097611 | Prostate | Tumor | positive regulation of neuron projection development | 42/3246 | 163/18723 | 4.24e-03 | 2.12e-02 | 42 |
| GO:0043114 | Prostate | Tumor | regulation of vascular permeability | 16/3246 | 47/18723 | 4.27e-03 | 2.13e-02 | 16 |
| GO:190495011 | Prostate | Tumor | negative regulation of establishment of protein localization | 35/3246 | 131/18723 | 4.63e-03 | 2.28e-02 | 35 |
| GO:007037113 | Prostate | Tumor | ERK1 and ERK2 cascade | 76/3246 | 330/18723 | 4.66e-03 | 2.29e-02 | 76 |
| GO:000759614 | Prostate | Tumor | blood coagulation | 53/3246 | 217/18723 | 4.89e-03 | 2.39e-02 | 53 |
| GO:005081714 | Prostate | Tumor | coagulation | 54/3246 | 222/18723 | 4.95e-03 | 2.42e-02 | 54 |
| GO:003280112 | Prostate | Tumor | receptor catabolic process | 11/3246 | 28/18723 | 4.97e-03 | 2.43e-02 | 11 |
| GO:00508901 | Prostate | Tumor | cognition | 69/3246 | 296/18723 | 5.03e-03 | 2.45e-02 | 69 |
| GO:005122411 | Prostate | Tumor | negative regulation of protein transport | 34/3246 | 127/18723 | 5.03e-03 | 2.45e-02 | 34 |
| GO:00192166 | Prostate | Tumor | regulation of lipid metabolic process | 76/3246 | 331/18723 | 5.04e-03 | 2.45e-02 | 76 |
| Page: 1 2 3 4 5 6 7 8 9 10 11 12 13 14 15 16 17 18 19 20 21 22 23 24 25 26 27 28 29 30 31 32 33 34 35 36 37 38 39 40 41 42 43 44 45 46 47 48 49 50 51 52 53 54 55 56 57 58 59 60 61 62 63 64 65 66 67 68 69 70 71 72 73 74 75 76 77 78 79 80 81 82 83 84 85 86 87 88 89 90 91 92 93 94 95 96 97 98 99 100 101 102 103 104 105 106 107 108 109 110 111 112 113 114 115 116 117 118 119 120 121 122 123 124 125 126 127 |
| Pathway ID | Tissue | Disease Stage | Description | Gene Ratio | Bg Ratio | pvalue | p.adjust | qvalue | Count |
| hsa0501043 | Breast | DCIS | Alzheimer disease | 105/846 | 384/8465 | 3.23e-23 | 1.49e-21 | 1.10e-21 | 105 |
| hsa0501053 | Breast | DCIS | Alzheimer disease | 105/846 | 384/8465 | 3.23e-23 | 1.49e-21 | 1.10e-21 | 105 |
| hsa0501020 | Endometrium | AEH | Alzheimer disease | 124/1197 | 384/8465 | 1.20e-20 | 3.91e-19 | 2.86e-19 | 124 |
| hsa05010110 | Endometrium | AEH | Alzheimer disease | 124/1197 | 384/8465 | 1.20e-20 | 3.91e-19 | 2.86e-19 | 124 |
| hsa0501025 | Endometrium | EEC | Alzheimer disease | 126/1237 | 384/8465 | 2.25e-20 | 7.40e-19 | 5.52e-19 | 126 |
| hsa0501035 | Endometrium | EEC | Alzheimer disease | 126/1237 | 384/8465 | 2.25e-20 | 7.40e-19 | 5.52e-19 | 126 |
| hsa05010210 | Esophagus | ESCC | Alzheimer disease | 263/4205 | 384/8465 | 1.80e-14 | 5.47e-13 | 2.80e-13 | 263 |
| hsa0501038 | Esophagus | ESCC | Alzheimer disease | 263/4205 | 384/8465 | 1.80e-14 | 5.47e-13 | 2.80e-13 | 263 |
| hsa049796 | Liver | NAFLD | Cholesterol metabolism | 20/1043 | 51/8465 | 9.73e-07 | 4.56e-05 | 3.67e-05 | 20 |
| hsa0497911 | Liver | NAFLD | Cholesterol metabolism | 20/1043 | 51/8465 | 9.73e-07 | 4.56e-05 | 3.67e-05 | 20 |
| hsa049792 | Liver | Cirrhotic | Cholesterol metabolism | 30/2530 | 51/8465 | 1.59e-05 | 1.39e-04 | 8.60e-05 | 30 |
| hsa049793 | Liver | Cirrhotic | Cholesterol metabolism | 30/2530 | 51/8465 | 1.59e-05 | 1.39e-04 | 8.60e-05 | 30 |
| hsa049794 | Liver | HCC | Cholesterol metabolism | 41/4020 | 51/8465 | 1.33e-06 | 1.35e-05 | 7.49e-06 | 41 |
| hsa049795 | Liver | HCC | Cholesterol metabolism | 41/4020 | 51/8465 | 1.33e-06 | 1.35e-05 | 7.49e-06 | 41 |
| hsa0501028 | Oral cavity | OSCC | Alzheimer disease | 244/3704 | 384/8465 | 1.18e-15 | 3.60e-14 | 1.83e-14 | 244 |
| hsa05010112 | Oral cavity | OSCC | Alzheimer disease | 244/3704 | 384/8465 | 1.18e-15 | 3.60e-14 | 1.83e-14 | 244 |
| hsa0501029 | Oral cavity | LP | Alzheimer disease | 197/2418 | 384/8465 | 6.66e-22 | 3.69e-20 | 2.38e-20 | 197 |
| hsa0501037 | Oral cavity | LP | Alzheimer disease | 197/2418 | 384/8465 | 6.66e-22 | 3.69e-20 | 2.38e-20 | 197 |
| hsa0501045 | Oral cavity | EOLP | Alzheimer disease | 87/1218 | 384/8465 | 5.79e-06 | 3.67e-05 | 2.16e-05 | 87 |
| hsa0501055 | Oral cavity | EOLP | Alzheimer disease | 87/1218 | 384/8465 | 5.79e-06 | 3.67e-05 | 2.16e-05 | 87 |
| Page: 1 2 |
Top |
Cell-cell communication analysis |
| Identification of potential cell-cell interactions between two cell types and their ligand-receptor pairs for different disease states |
| Ligand | Receptor | LRpair | Pathway | Tissue | Disease Stage |
| Page: 1 |
Top |
Single-cell gene regulatory network inference analysis |
| Find out the significant the regulons (TFs) and the target genes of each regulon across cell types for different disease states |
| TF | Cell Type | Tissue | Disease Stage | Target Gene | RSS | Regulon Activity |
| ∗The dot plots of a searched regulon are shown for all cell subpopulations in each disease state of each tissue based on the regulon specific score inferred using pySCENIC and by calculating the average expression. |
| Page: 1 |
Top |
Somatic mutation of malignant transformation related genes |
| Annotation of somatic variants for genes involved in malignant transformation |
| Hugo Symbol | Variant Class | Variant Classification | dbSNP RS | HGVSc | HGVSp | HGVSp Short | SWISSPROT | BIOTYPE | SIFT | PolyPhen | Tumor Sample Barcode | Tissue | Histology | Sex | Age | Stage | Therapy Types | Drugs | Outcome |
| APOE | SNV | Missense_Mutation | rs372938213 | c.350C>T | p.Ala117Val | p.A117V | P02649 | protein_coding | deleterious(0.03) | possibly_damaging(0.592) | TCGA-AO-A128-01 | Breast | breast invasive carcinoma | Female | <65 | I/II | Chemotherapy | doxorubicin | SD |
| APOE | SNV | Missense_Mutation | novel | c.685N>C | p.Gly229Arg | p.G229R | P02649 | protein_coding | tolerated(0.24) | benign(0.11) | TCGA-5M-AAT4-01 | Colorectum | colon adenocarcinoma | Male | >=65 | III/IV | Unknown | Unknown | PD |
| APOE | SNV | Missense_Mutation | c.128N>T | p.Arg43Leu | p.R43L | P02649 | protein_coding | deleterious(0) | benign(0.006) | TCGA-AA-A02Y-01 | Colorectum | colon adenocarcinoma | Male | >=65 | I/II | Unknown | Unknown | SD | |
| APOE | SNV | Missense_Mutation | c.371N>T | p.Ala124Val | p.A124V | P02649 | protein_coding | deleterious(0.01) | possibly_damaging(0.524) | TCGA-DM-A1HB-01 | Colorectum | colon adenocarcinoma | Male | >=65 | III/IV | Unknown | Unknown | SD | |
| APOE | SNV | Missense_Mutation | c.239C>T | p.Ala80Val | p.A80V | P02649 | protein_coding | tolerated(0.33) | benign(0) | TCGA-G4-6627-01 | Colorectum | colon adenocarcinoma | Male | >=65 | I/II | Unknown | Unknown | PD | |
| APOE | SNV | Missense_Mutation | novel | c.353N>T | p.Ala118Val | p.A118V | P02649 | protein_coding | tolerated(0.17) | possibly_damaging(0.842) | TCGA-AX-A3FT-01 | Endometrium | uterine corpus endometrioid carcinoma | Female | <65 | I/II | Unknown | Unknown | SD |
| APOE | SNV | Missense_Mutation | novel | c.53N>A | p.Ala18Asp | p.A18D | P02649 | protein_coding | deleterious(0) | possibly_damaging(0.453) | TCGA-QS-A8F1-01 | Endometrium | uterine corpus endometrioid carcinoma | Female | >=65 | III/IV | Chemotherapy | carboplatin | PD |
| APOE | SNV | Missense_Mutation | rs752790054 | c.167N>A | p.Arg56His | p.R56H | P02649 | protein_coding | deleterious(0.04) | benign(0.003) | TCGA-4R-AA8I-01 | Liver | liver hepatocellular carcinoma | Male | >=65 | I/II | Unknown | Unknown | PD |
| APOE | SNV | Missense_Mutation | rs762461580 | c.149G>A | p.Arg50His | p.R50H | P02649 | protein_coding | deleterious(0.02) | probably_damaging(0.997) | TCGA-XK-AAIW-01 | Prostate | prostate adenocarcinoma | Male | >=65 | 9 | Unknown | Unknown | PD |
| APOE | SNV | Missense_Mutation | novel | c.270G>T | p.Lys90Asn | p.K90N | P02649 | protein_coding | tolerated(0.39) | benign(0.09) | TCGA-XK-AAIW-01 | Prostate | prostate adenocarcinoma | Male | >=65 | 9 | Unknown | Unknown | PD |
| Page: 1 2 |
Top |
Related drugs of malignant transformation related genes |
| Identification of chemicals and drugs interact with genes involved in malignant transfromation |
| (DGIdb 4.0) |
| Entrez ID | Symbol | Category | Interaction Types | Drug Claim Name | Drug Name | PMIDs |
| 348 | APOE | DRUGGABLE GENOME | PREDNISONE | PREDNISONE | 3185288 | |
| 348 | APOE | DRUGGABLE GENOME | BUTHIONINE SULFOXIMINE | 12615656 | ||
| 348 | APOE | DRUGGABLE GENOME | LORAZEPAM | LORAZEPAM | 15699298 | |
| 348 | APOE | DRUGGABLE GENOME | hmg coa reductase inhibitors | |||
| 348 | APOE | DRUGGABLE GENOME | fenofibrate | FENOFIBRATE | 12042669 | |
| 348 | APOE | DRUGGABLE GENOME | VITAMIN E | 12076219 | ||
| 348 | APOE | DRUGGABLE GENOME | ritonavir | RITONAVIR | 17700364,15809899 | |
| 348 | APOE | DRUGGABLE GENOME | TRIAMCINOLONE | TRIAMCINOLONE | 9150415 | |
| 348 | APOE | DRUGGABLE GENOME | ACE INHIBITOR | 12105166,15585195 | ||
| 348 | APOE | DRUGGABLE GENOME | CORTICOSTEROIDS | 1903065 |
| Page: 1 2 3 4 |

Copyright 2023-Present -The University of Texas Health Science Center at Houston |