Schematic overview of the cellular and molecular mechanisms involved in the cancer progression, including the proposed cellular and molecular mechanisms in cancer cells trajectory. AT1: alveolar type 1 cells; AT2: alveolar type 2 cells; AAH: atypical adenomatous hyperplasia; AIS: adenocarcinoma in situ; MIA: minimally invasive adenocarcinoma; IA: invasive adenocarcinoma; EMT: epithelial-mesenchymal transition

Home

Download

Statistics

Help

Contact

Center for Computational Systems Medicine
leaf

Gene summary

leaf

Malignant transformation analysis

leaf

Malignant transformation related pathway analysis

leaf

Cell-cell communication analysis

leaf

Single-cell gene regulatory network inference analysis

leaf

Somatic mutation of malignant transformation related genes

leaf

Related drugs of malignant transformation related genes

Gene: WTAP

Gene summary for WTAP

check button Gene summary.

Gene informationSpeciesHuman
Gene symbol

WTAP

Gene ID

9589

Gene nameWT1 associated protein
Gene AliasMum2
Cytomap6q25.3
Gene Typeprotein-coding
GO ID

GO:0000375

UniProtAcc

Q15007


Top

Malignant transformation analysis

check button Identification of the aberrant gene expression in precancerous and cancerous lesions by comparing the gene expression of stem-like cells in diseased tissues with normal stem cells
check button Malignant transformation involving gene list.
Entrez IDSymbolReplicatesSpeciesOrganTissueAdj P-valueLog2FCMalignancy
9589WTAPGSM4909285HumanBreastIDC4.20e-09-4.47e-010.21
9589WTAPGSM4909286HumanBreastIDC2.78e-08-2.13e-010.1081
9589WTAPGSM4909288HumanBreastIDC1.46e-03-4.52e-010.0988
9589WTAPGSM4909291HumanBreastIDC1.46e-14-6.05e-010.1753
9589WTAPGSM4909292HumanBreastIDC2.24e-05-7.57e-010.1236
9589WTAPGSM4909293HumanBreastIDC7.75e-04-2.96e-010.1581
9589WTAPGSM4909294HumanBreastIDC3.32e-12-5.67e-010.2022
9589WTAPGSM4909296HumanBreastIDC3.72e-36-7.32e-010.1524
9589WTAPGSM4909297HumanBreastIDC9.34e-19-3.45e-010.1517
9589WTAPGSM4909298HumanBreastIDC4.93e-07-3.86e-010.1551
9589WTAPGSM4909299HumanBreastIDC3.74e-04-3.22e-010.035
9589WTAPGSM4909301HumanBreastIDC5.13e-08-4.64e-010.1577
9589WTAPGSM4909302HumanBreastIDC5.26e-25-5.93e-010.1545
9589WTAPGSM4909304HumanBreastIDC2.32e-06-4.15e-010.1636
9589WTAPGSM4909305HumanBreastIDC4.28e-02-2.33e-010.0436
9589WTAPGSM4909306HumanBreastIDC4.09e-10-4.35e-010.1564
9589WTAPGSM4909307HumanBreastIDC2.37e-17-5.72e-010.1569
9589WTAPGSM4909308HumanBreastIDC8.16e-11-4.18e-010.158
9589WTAPGSM4909309HumanBreastIDC1.21e-13-4.67e-010.0483
9589WTAPGSM4909311HumanBreastIDC1.47e-40-7.04e-010.1534
Page: 1 2 3 4 5 6 7 8 9 10 11 

check button Transcriptomic changes along malignancy continuum.
TissueExpression DynamicsAbbreviation
BreastThe image shows the transcriptomic changes along malignancy continuum.log2FC in expression of this searched gene in stem-like cells from each diseased tissue sample relative to stem-like cells in normal samples in each tissue plotted against the malignancy continuum. Samples are colored based on if they are from different disease stage.
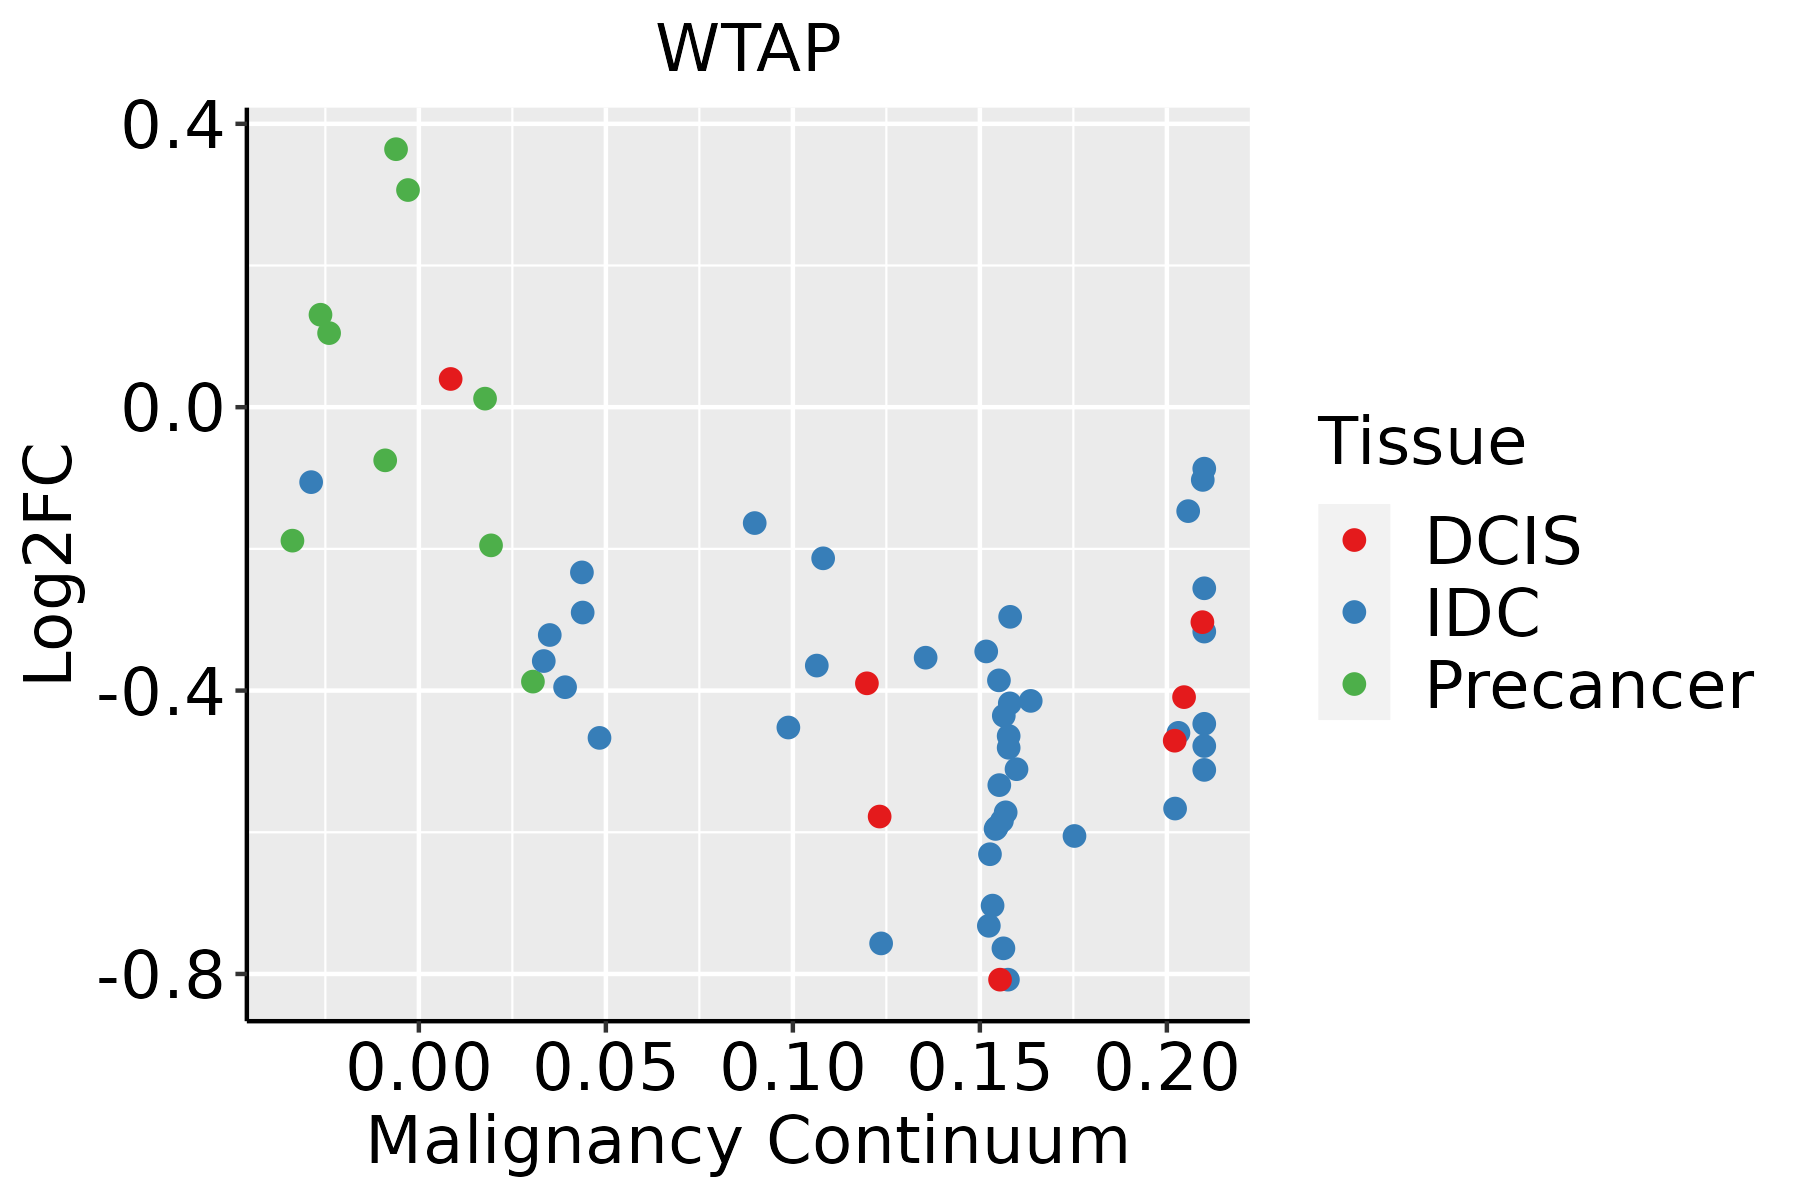
IDC: Invasive ductal carcinoma
DCIS: Ductal carcinoma in situ
Precancer(BRCA1-mut): Precancerous lesion from BRCA1 mutation carriers
EndometriumThe image shows the transcriptomic changes along malignancy continuum.log2FC in expression of this searched gene in stem-like cells from each diseased tissue sample relative to stem-like cells in normal samples in each tissue plotted against the malignancy continuum. Samples are colored based on if they are from different disease stage.
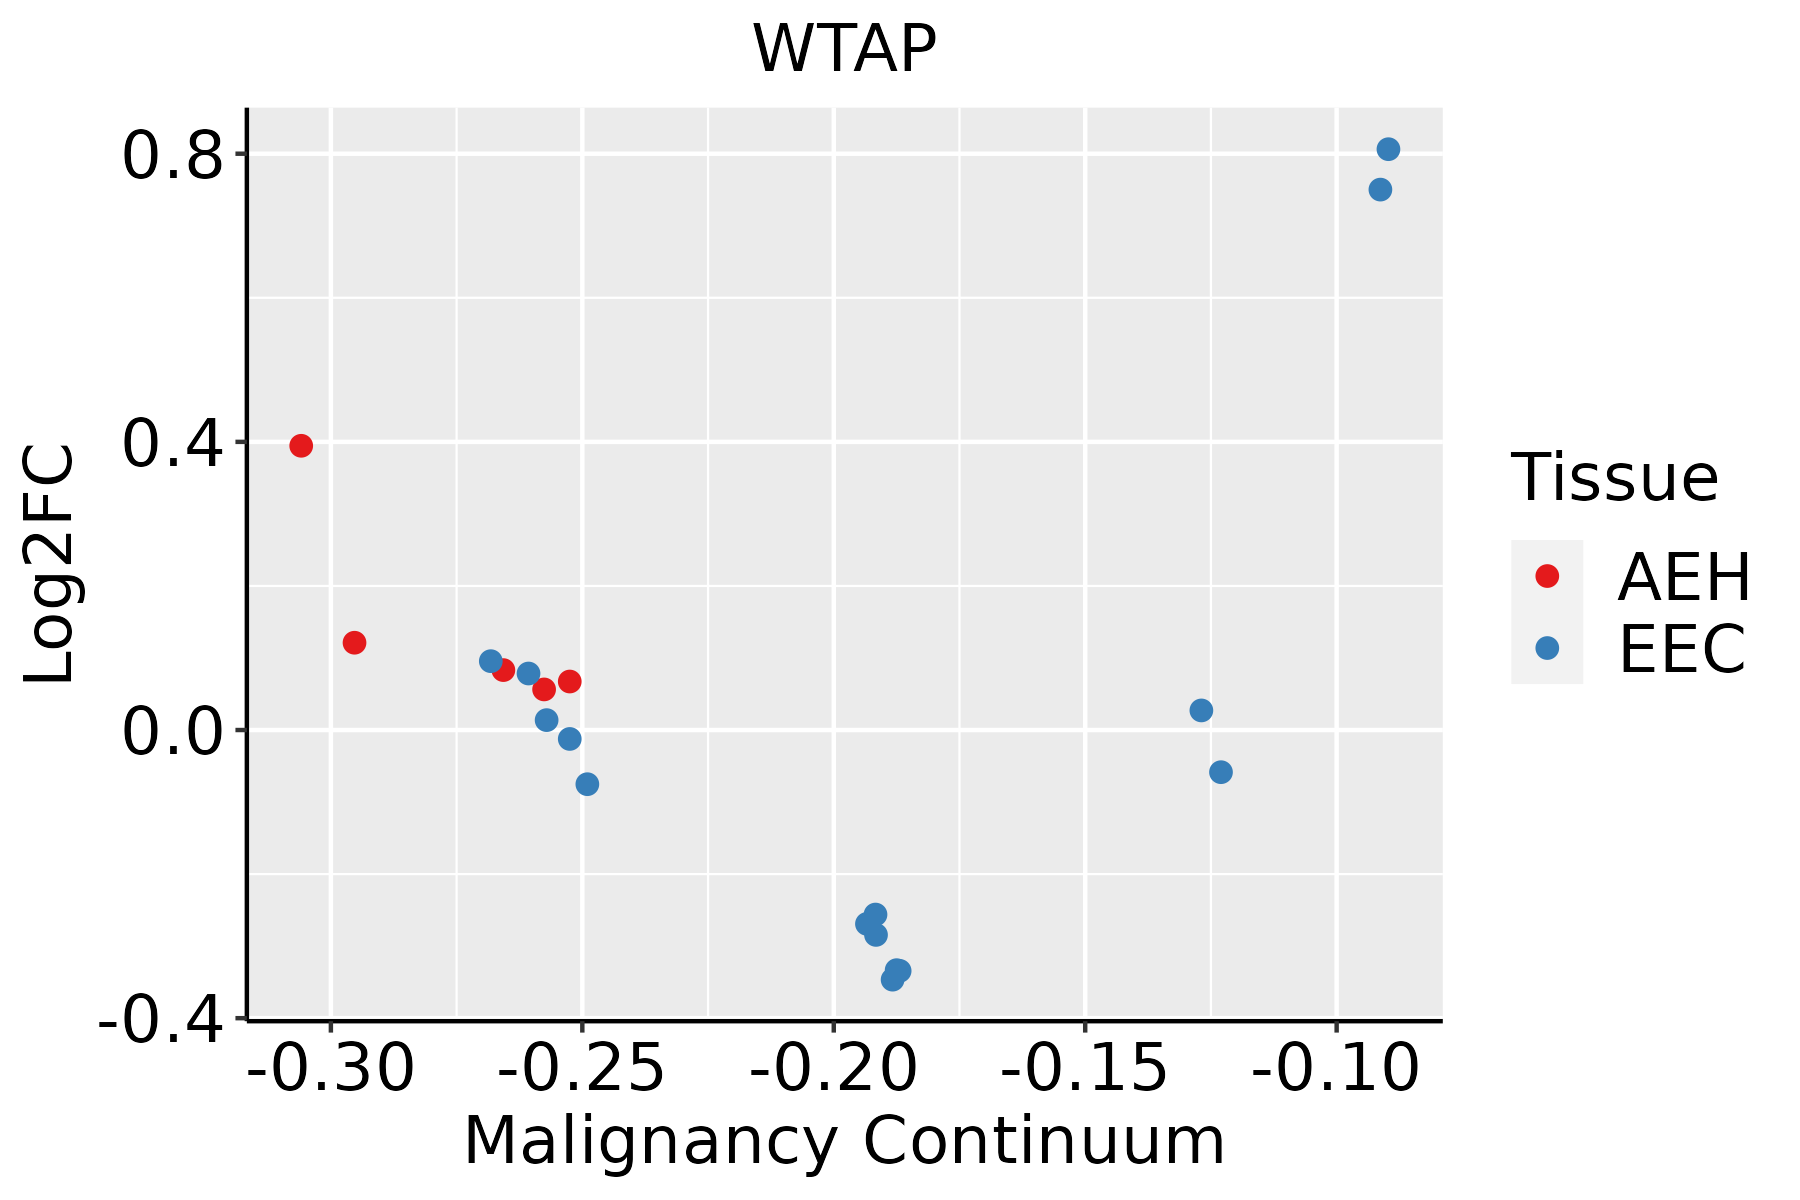
AEH: Atypical endometrial hyperplasia
EEC: Endometrioid Cancer
EsophagusThe image shows the transcriptomic changes along malignancy continuum.log2FC in expression of this searched gene in stem-like cells from each diseased tissue sample relative to stem-like cells in normal samples in each tissue plotted against the malignancy continuum. Samples are colored based on if they are from different disease stage.
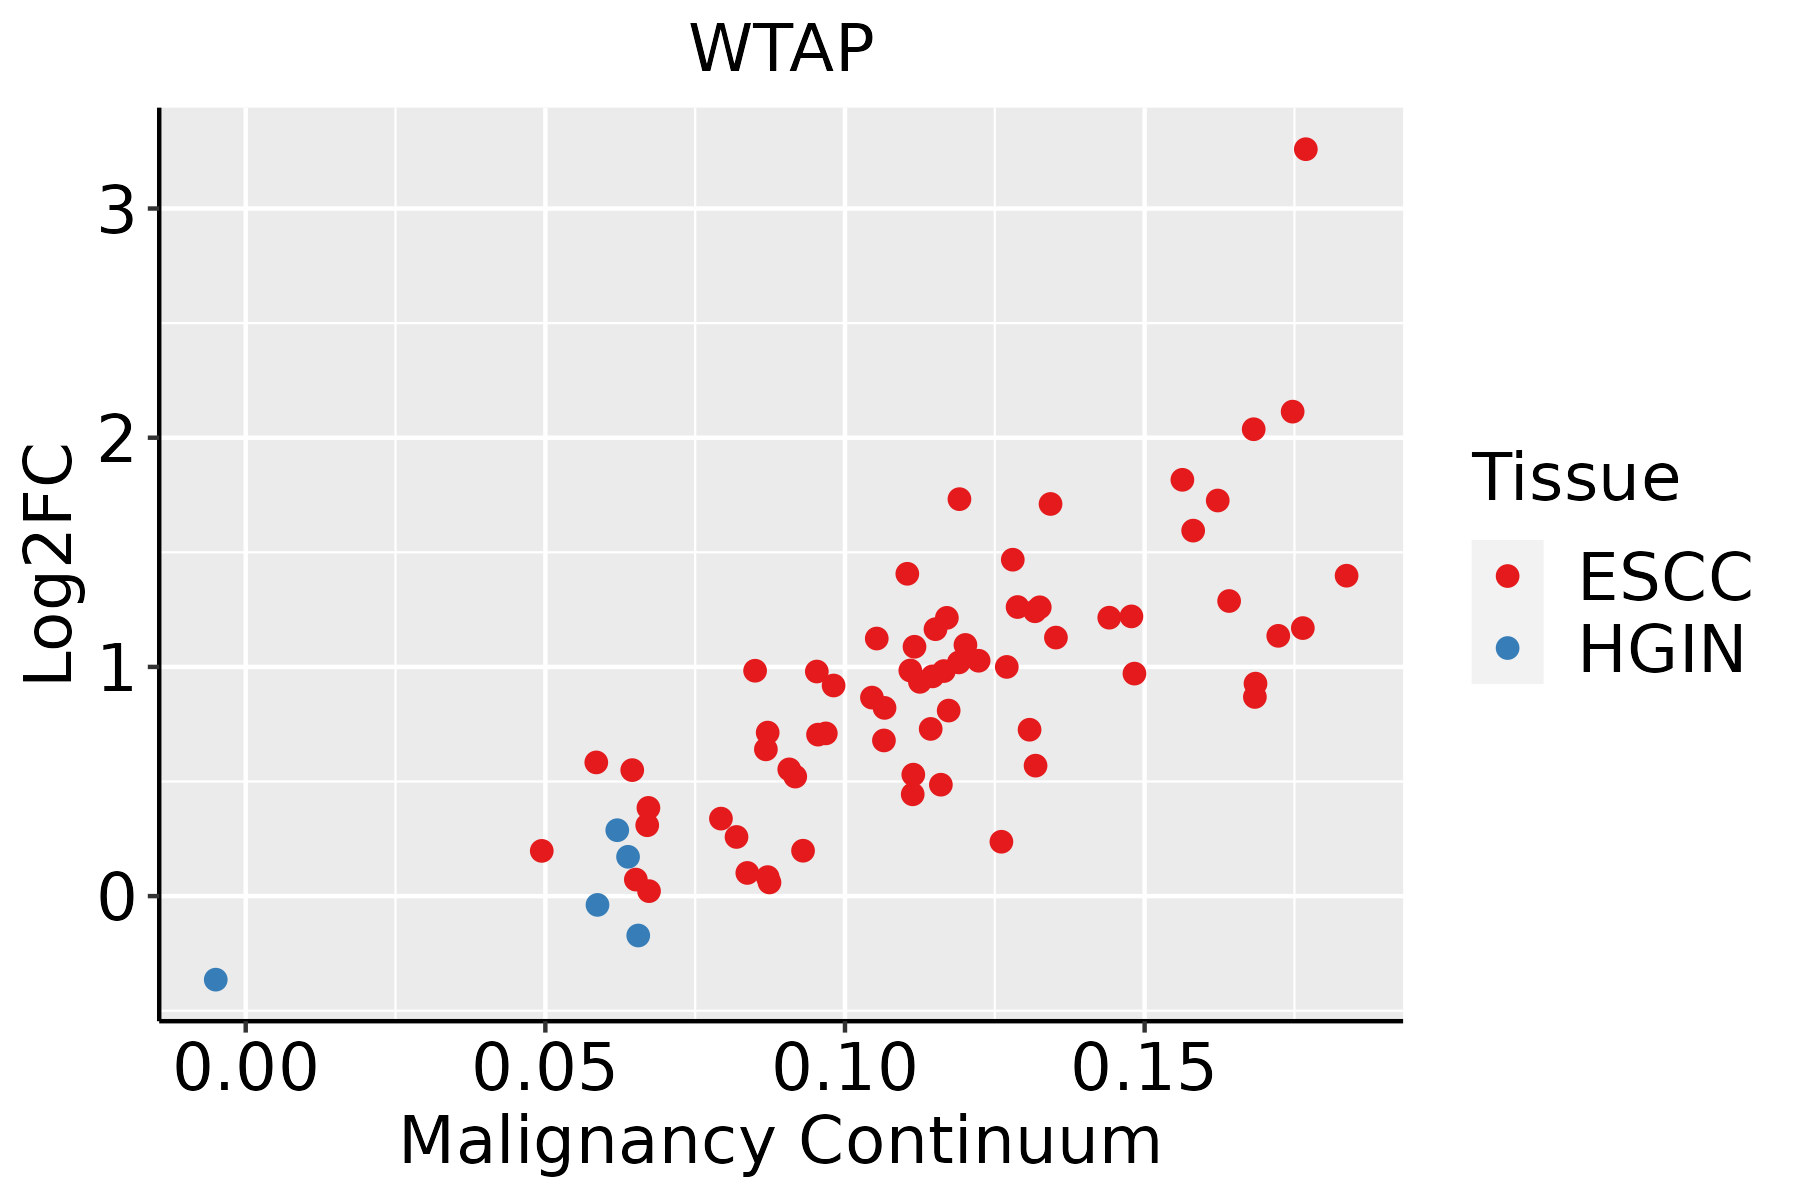
ESCC: Esophageal squamous cell carcinoma
HGIN: High-grade intraepithelial neoplasias
LGIN: Low-grade intraepithelial neoplasias
LiverThe image shows the transcriptomic changes along malignancy continuum.log2FC in expression of this searched gene in stem-like cells from each diseased tissue sample relative to stem-like cells in normal samples in each tissue plotted against the malignancy continuum. Samples are colored based on if they are from different disease stage.
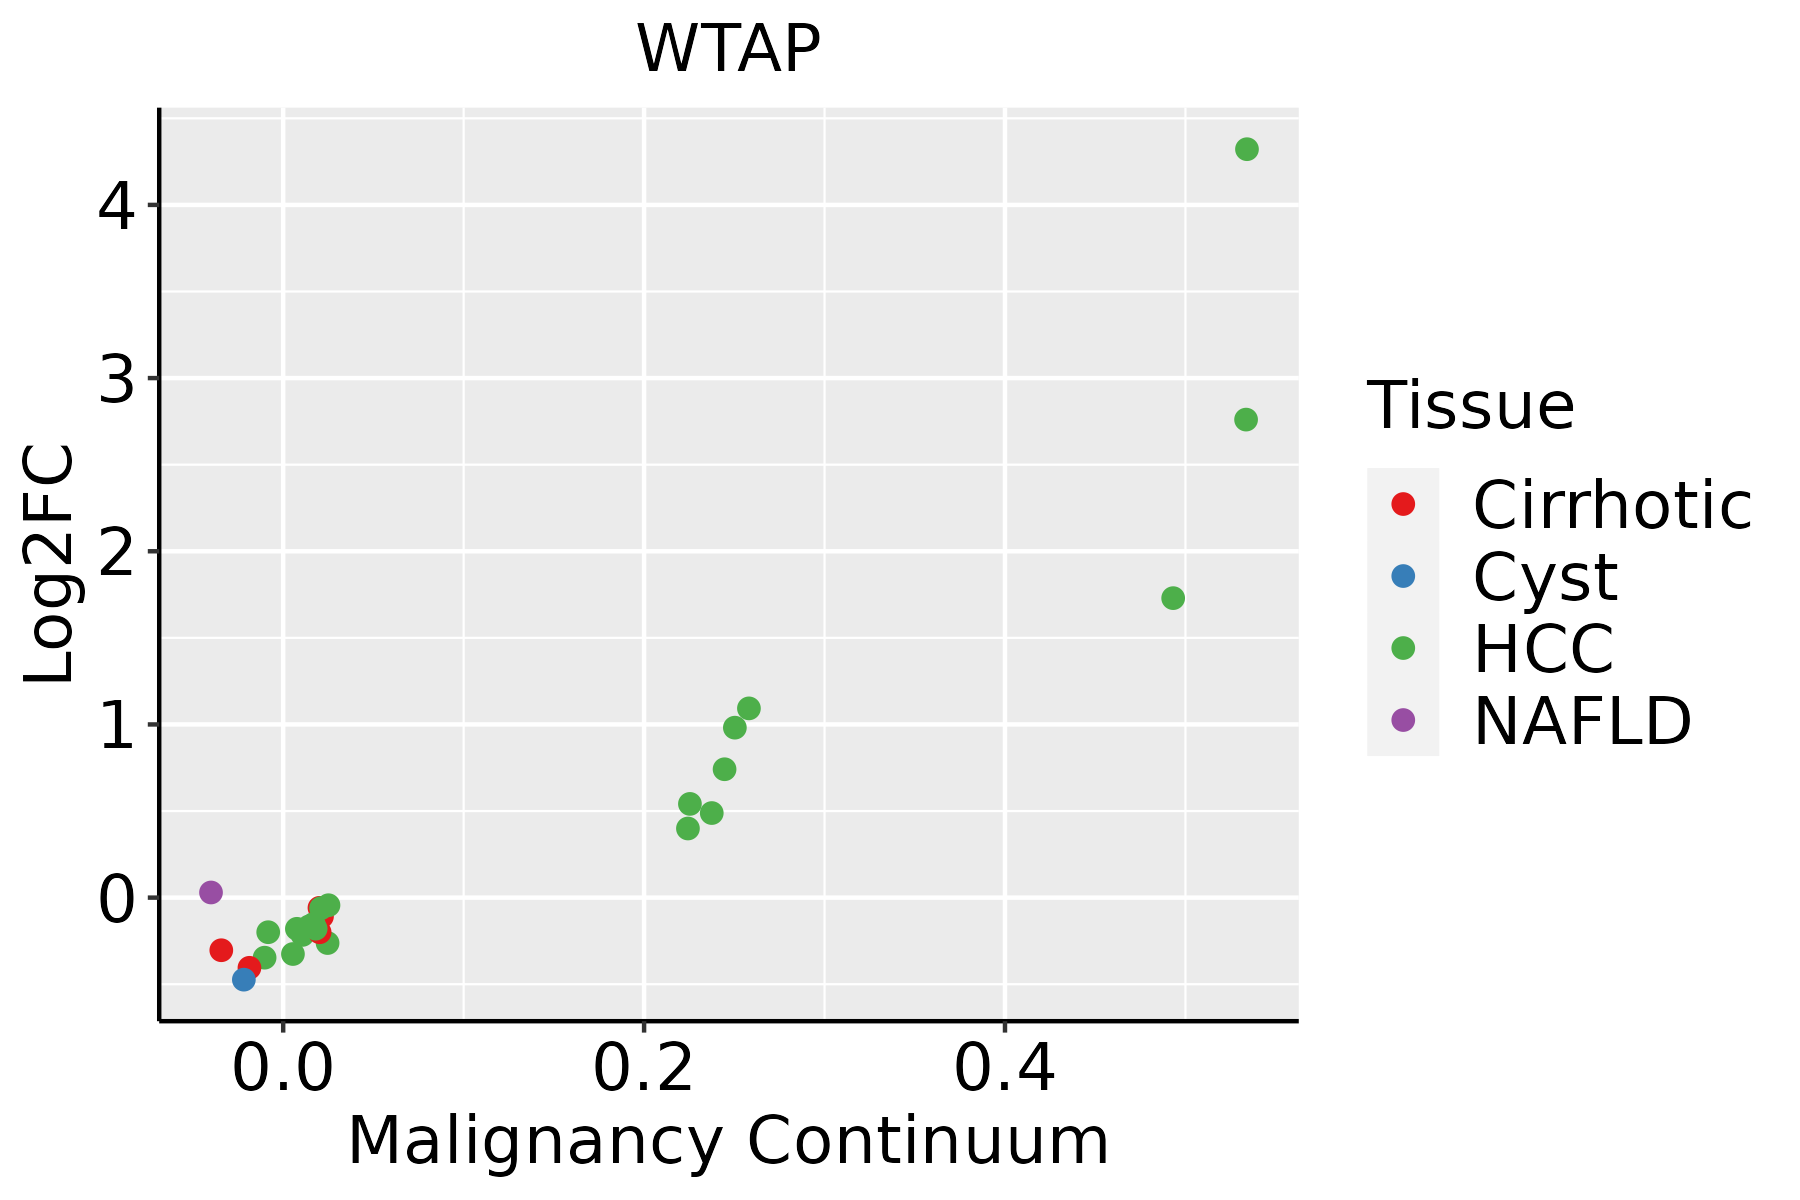
HCC: Hepatocellular carcinoma
NAFLD: Non-alcoholic fatty liver disease
LungThe image shows the transcriptomic changes along malignancy continuum.log2FC in expression of this searched gene in stem-like cells from each diseased tissue sample relative to stem-like cells in normal samples in each tissue plotted against the malignancy continuum. Samples are colored based on if they are from different disease stage.
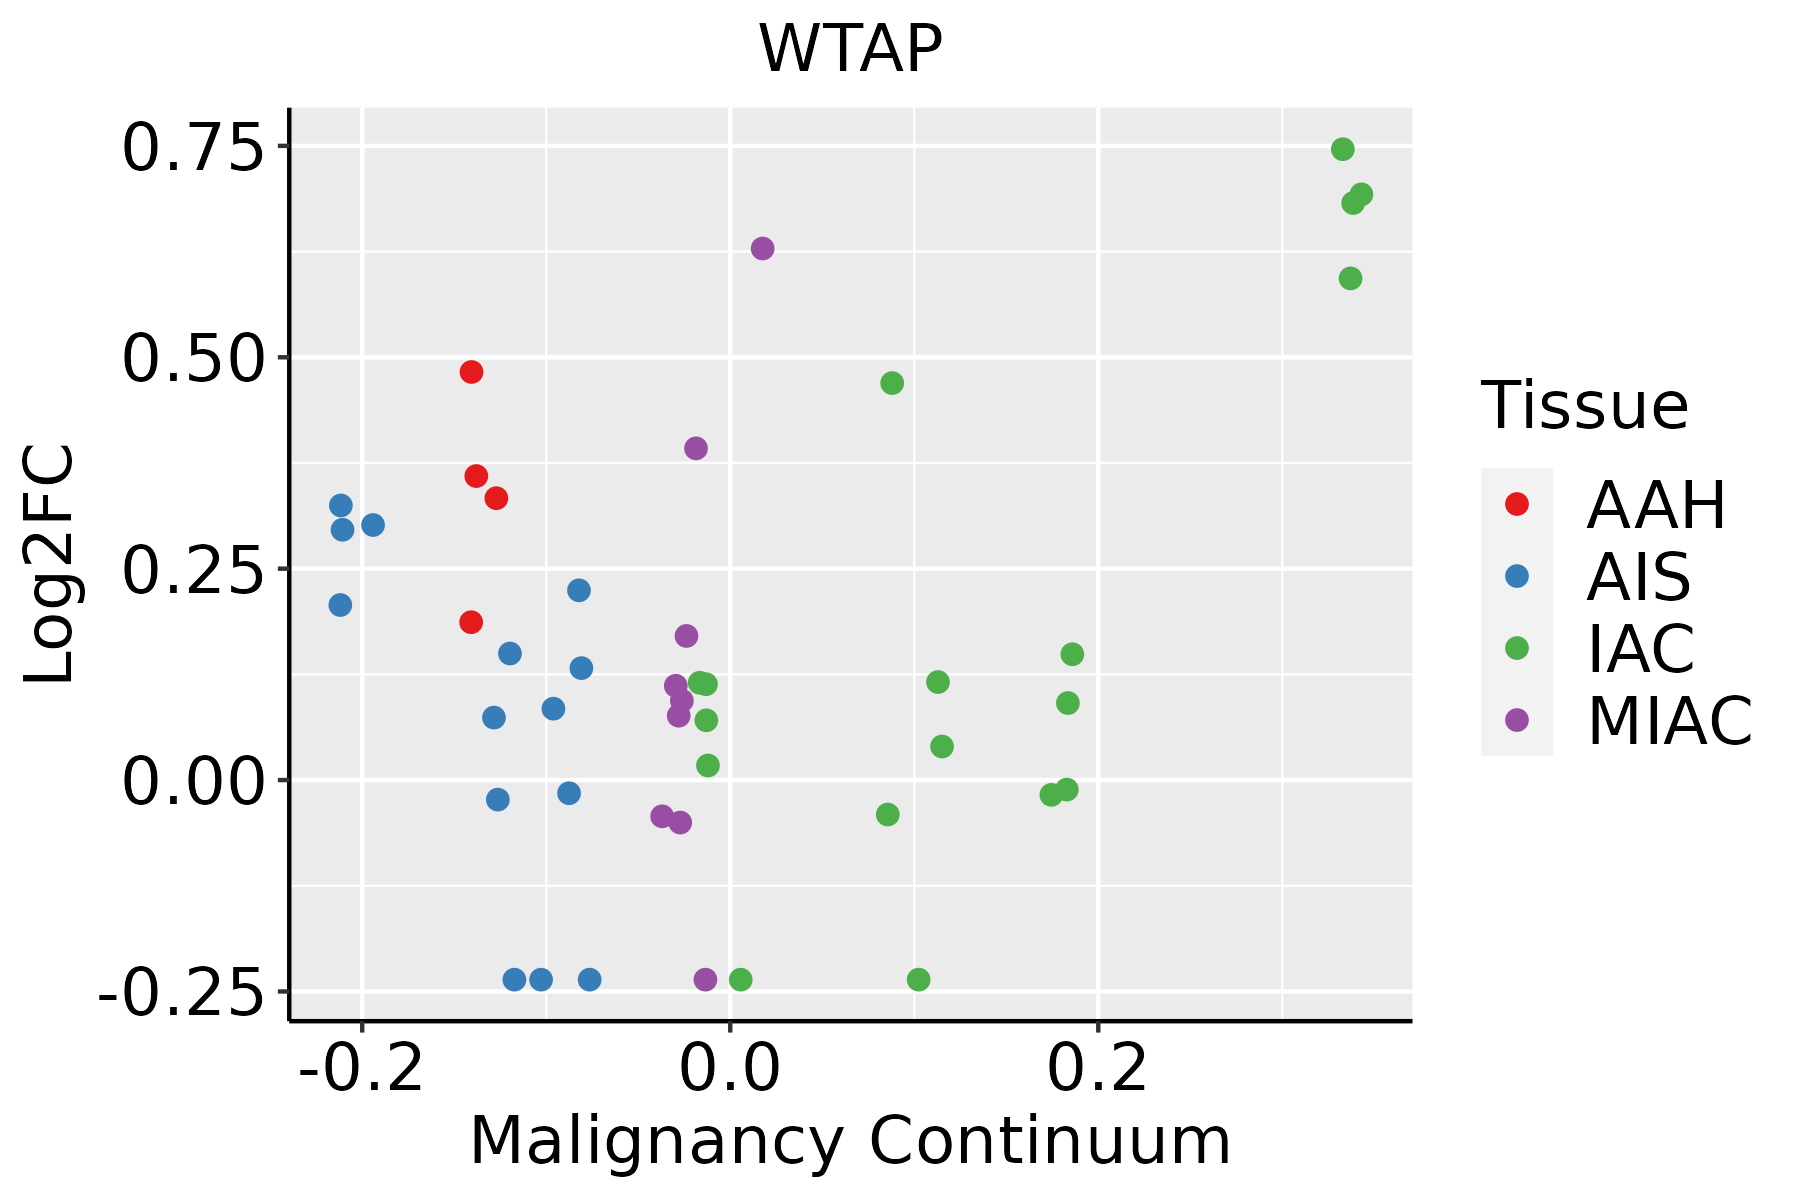
AAH: Atypical adenomatous hyperplasia
AIS: Adenocarcinoma in situ
IAC: Invasive lung adenocarcinoma
MIA: Minimally invasive adenocarcinoma
Oral CavityThe image shows the transcriptomic changes along malignancy continuum.log2FC in expression of this searched gene in stem-like cells from each diseased tissue sample relative to stem-like cells in normal samples in each tissue plotted against the malignancy continuum. Samples are colored based on if they are from different disease stage.
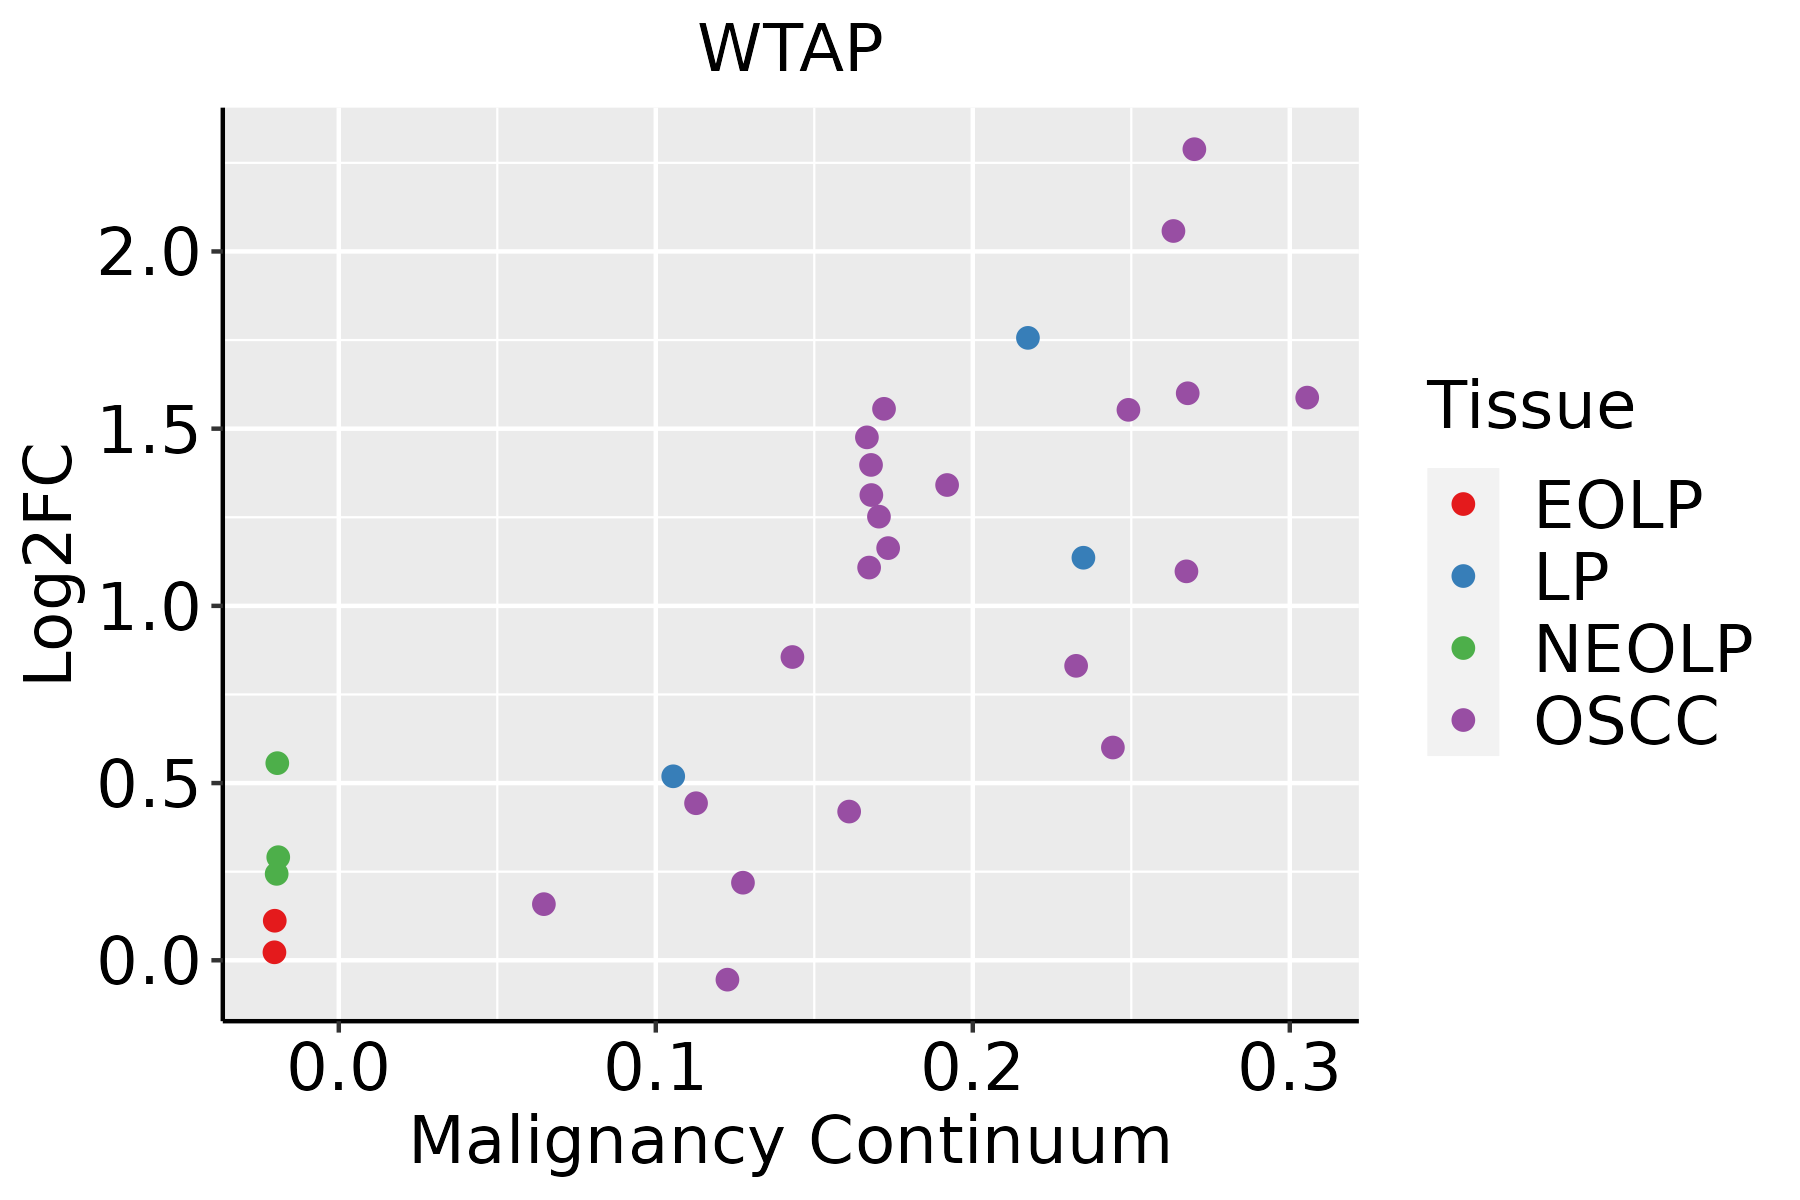
EOLP: Erosive Oral lichen planus
LP: leukoplakia
NEOLP: Non-erosive oral lichen planus
OSCC: Oral squamous cell carcinoma
ProstateThe image shows the transcriptomic changes along malignancy continuum.log2FC in expression of this searched gene in stem-like cells from each diseased tissue sample relative to stem-like cells in normal samples in each tissue plotted against the malignancy continuum. Samples are colored based on if they are from different disease stage.
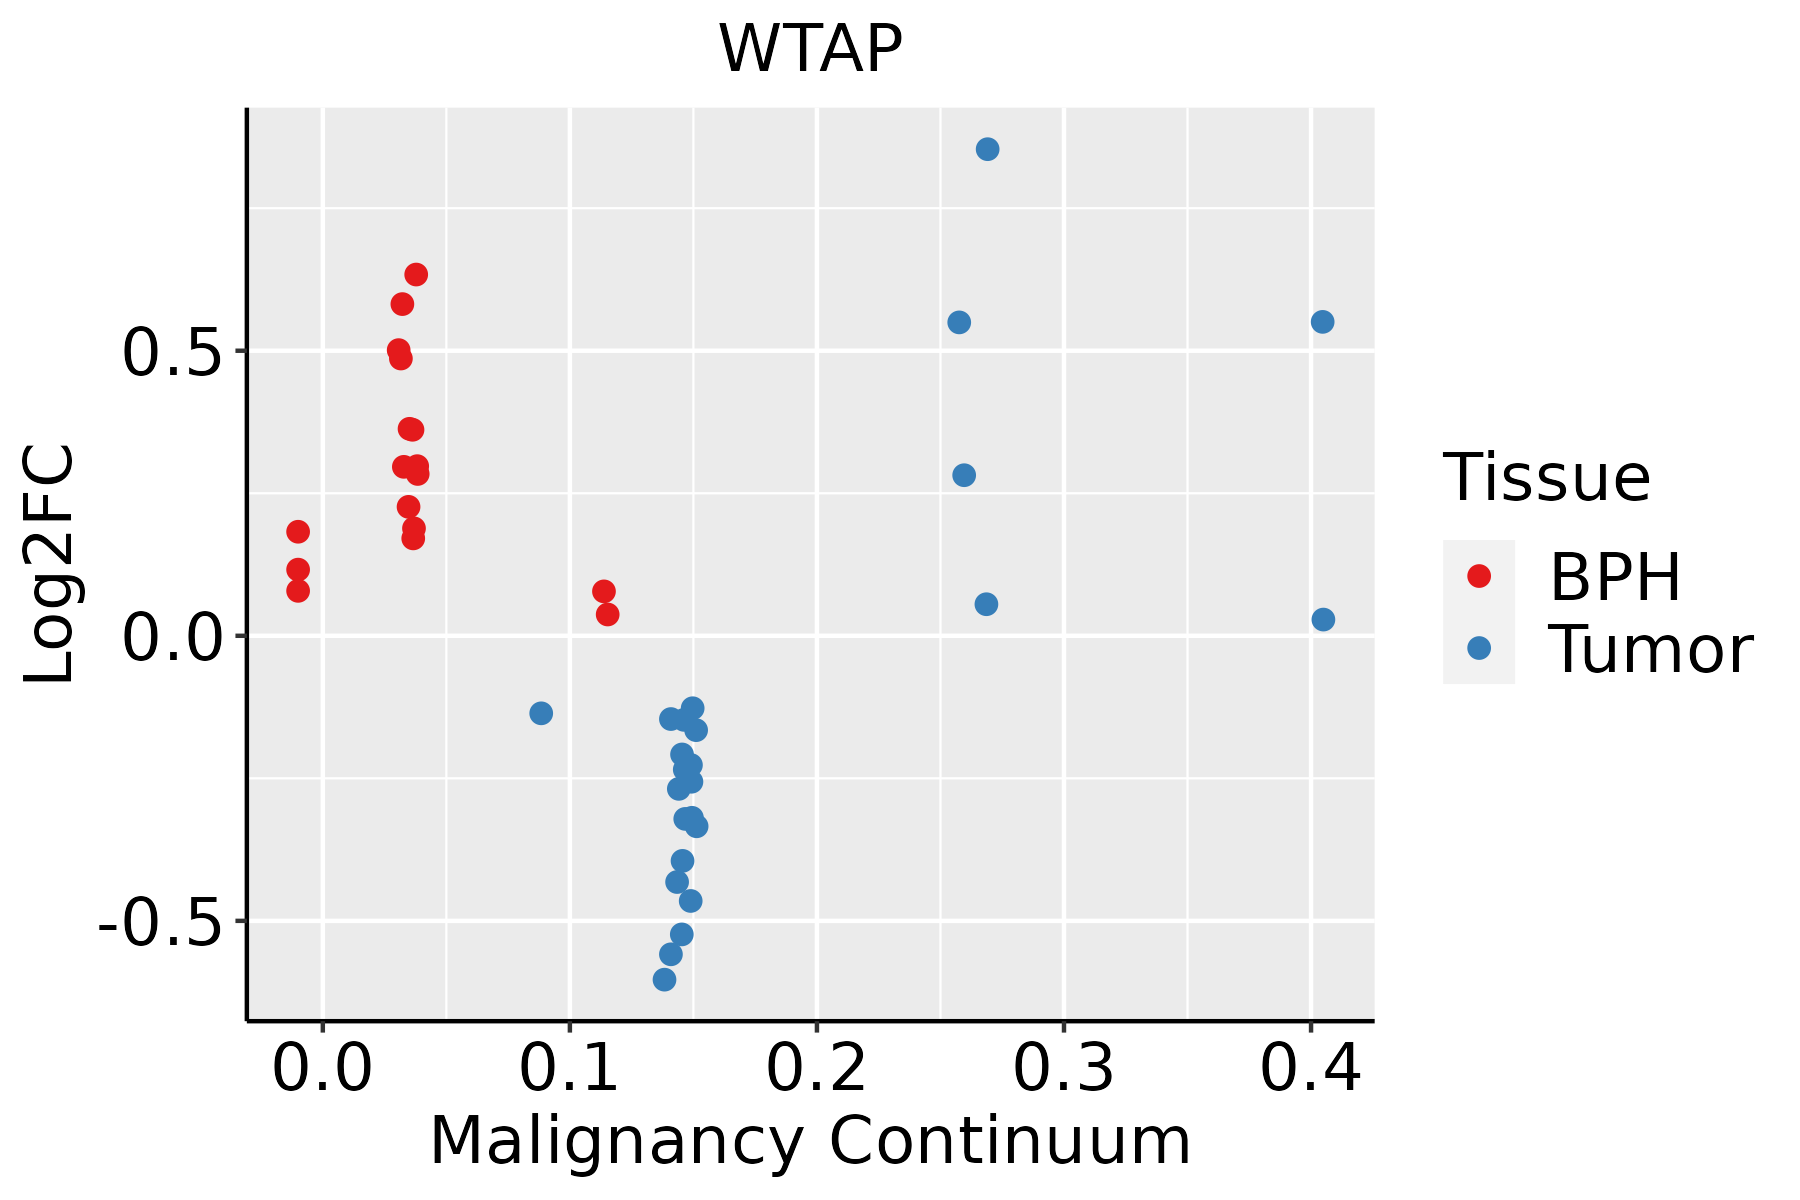
BPH: Benign Prostatic Hyperplasia
SkinThe image shows the transcriptomic changes along malignancy continuum.log2FC in expression of this searched gene in stem-like cells from each diseased tissue sample relative to stem-like cells in normal samples in each tissue plotted against the malignancy continuum. Samples are colored based on if they are from different disease stage.
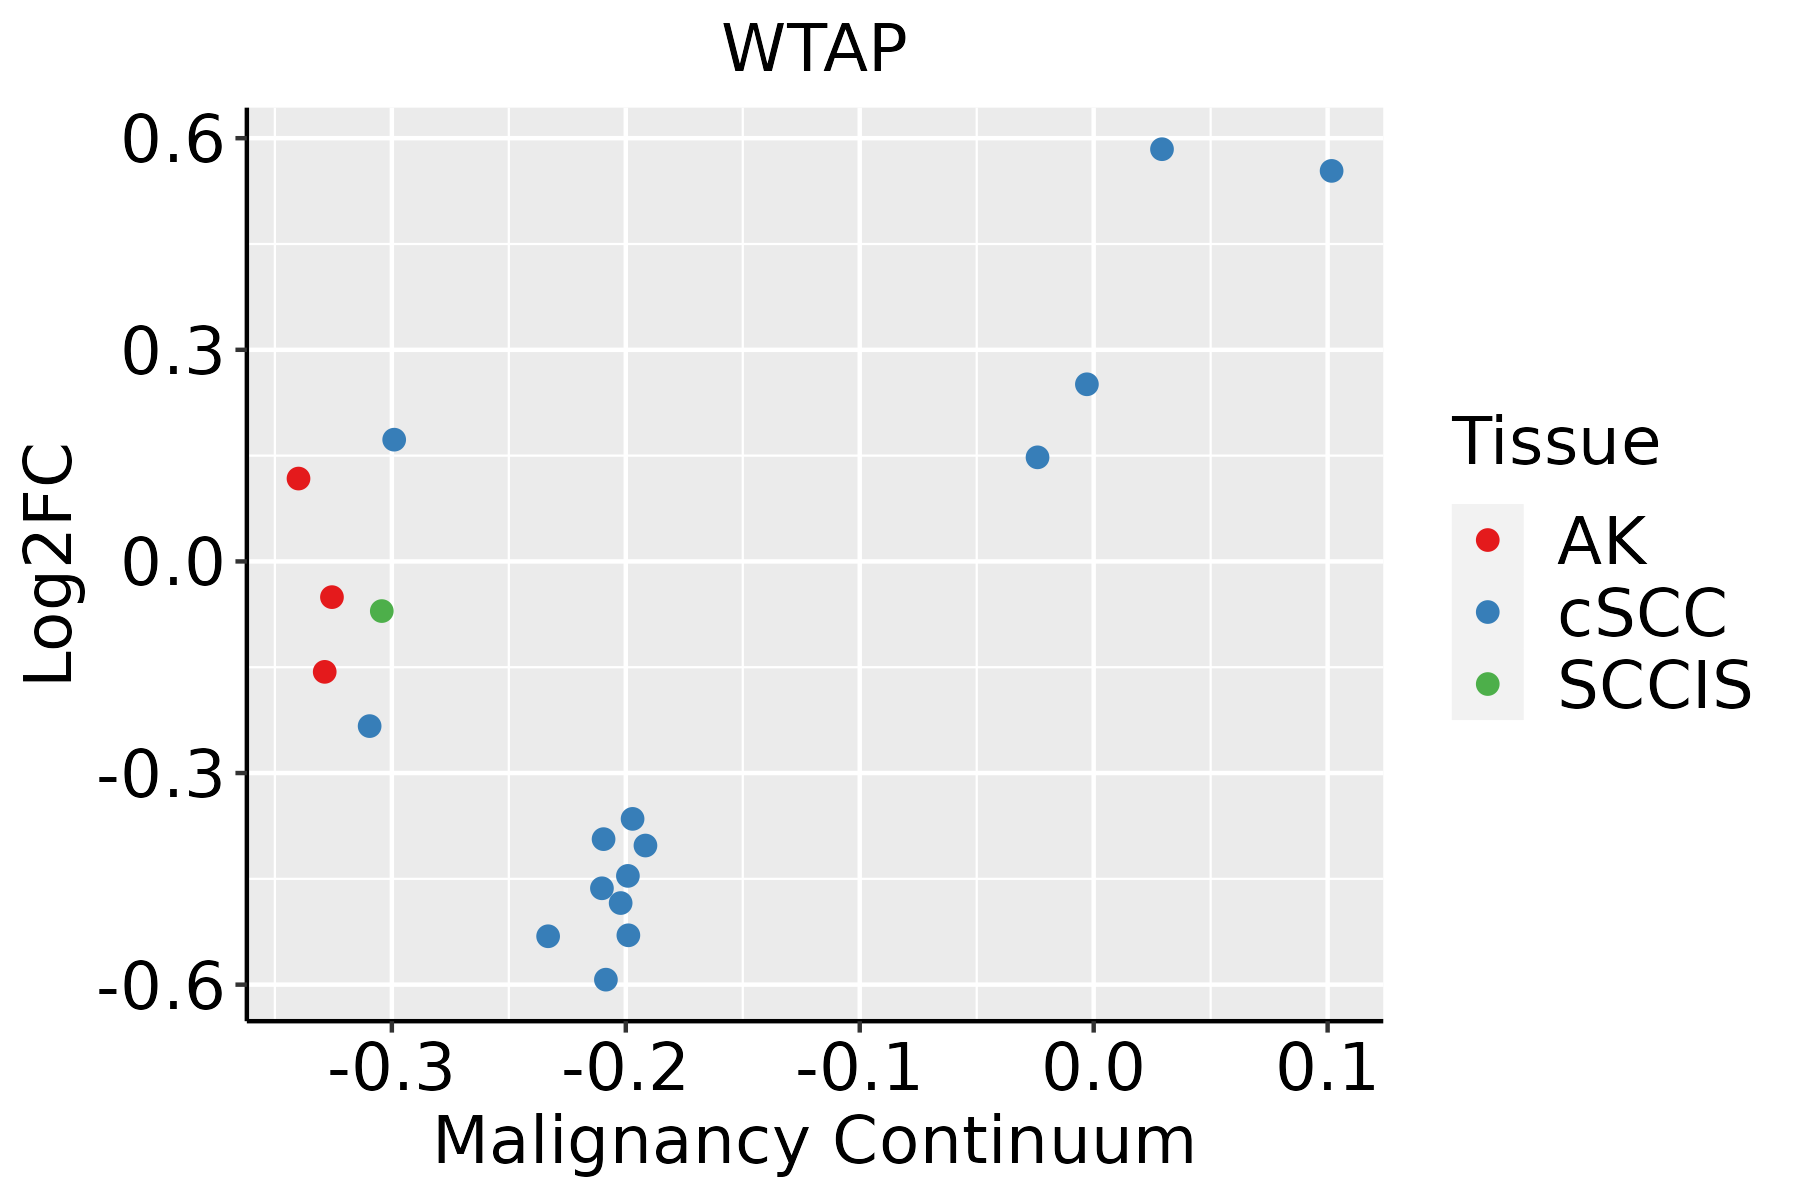
AK: Actinic keratosis
cSCC: Cutaneous squamous cell carcinoma
SCCIS:squamous cell carcinoma in situ
ThyroidThe image shows the transcriptomic changes along malignancy continuum.log2FC in expression of this searched gene in stem-like cells from each diseased tissue sample relative to stem-like cells in normal samples in each tissue plotted against the malignancy continuum. Samples are colored based on if they are from different disease stage.ATC: Anaplastic thyroid cancer
HT: Hashimoto's thyroiditis
PTC: Papillary thyroid cancer
∗log2FC in expression of this searched gene in stem-like cells from each diseased tissue sample relative to stem-like cells in normal samples in each tissue plotted against the malignancy continuum. Samples are colored based on if they are from different disease stage.

Top

Malignant transformation related pathway analysis

check buttonFind out the enriched GO biological processes and KEGG pathways involved in transition from healthy to precancer to cancer
check button Figure of enriched GO biological processes.
TissueDisease StageEnriched GO biological Processes
ColorectumADGO analysis - Figure of enriched GO biological processes: Top 15 enriched GO BP terms are showed in the bar plot of each disease state in each tissue. Each row represents a significant GO biological process which is colored according to the -log10(p.adjust).
ColorectumSERGO analysis - Figure of enriched GO biological processes: Top 15 enriched GO BP terms are showed in the bar plot of each disease state in each tissue. Each row represents a significant GO biological process which is colored according to the -log10(p.adjust).
ColorectumMSSGO analysis - Figure of enriched GO biological processes: Top 15 enriched GO BP terms are showed in the bar plot of each disease state in each tissue. Each row represents a significant GO biological process which is colored according to the -log10(p.adjust).
ColorectumMSI-HGO analysis - Figure of enriched GO biological processes: Top 15 enriched GO BP terms are showed in the bar plot of each disease state in each tissue. Each row represents a significant GO biological process which is colored according to the -log10(p.adjust).
ColorectumFAPGO analysis - Figure of enriched GO biological processes: Top 15 enriched GO BP terms are showed in the bar plot of each disease state in each tissue. Each row represents a significant GO biological process which is colored according to the -log10(p.adjust).
∗Top 15 enriched GO BP terms are showed in the bar plot of each disease state in each tissue. Each row represents a significant GO biological process which is colored according to the -log10(p.adjust).
Page: 1 2 3 4 5 6 7 8 9 

check button Enriched GO biological processes.
GO IDTissueDisease StageDescriptionGene RatioBg Ratiopvaluep.adjustCount
GO:000037517ProstateBPHRNA splicing, via transesterification reactions114/3107324/187232.19e-164.53e-14114
GO:000037717ProstateBPHRNA splicing, via transesterification reactions with bulged adenosine as nucleophile112/3107320/187236.21e-161.07e-13112
GO:000039817ProstateBPHmRNA splicing, via spliceosome112/3107320/187236.21e-161.07e-13112
GO:004802418ProstateBPHregulation of mRNA splicing, via spliceosome51/3107101/187233.74e-155.26e-1351
GO:000038010ProstateBPHalternative mRNA splicing, via spliceosome35/310777/187232.89e-091.13e-0735
GO:000038110ProstateBPHregulation of alternative mRNA splicing, via spliceosome29/310760/187231.16e-083.81e-0729
GO:000838019ProstateTumorRNA splicing153/3246434/187239.15e-205.79e-17153
GO:190331117ProstateTumorregulation of mRNA metabolic process111/3246288/187236.66e-182.30e-15111
GO:004348419ProstateTumorregulation of RNA splicing70/3246148/187233.22e-171.05e-1470
GO:000037518ProstateTumorRNA splicing, via transesterification reactions119/3246324/187233.40e-171.06e-14119
GO:000037718ProstateTumorRNA splicing, via transesterification reactions with bulged adenosine as nucleophile117/3246320/187239.31e-172.22e-14117
GO:000039818ProstateTumormRNA splicing, via spliceosome117/3246320/187239.31e-172.22e-14117
GO:005068416ProstateTumorregulation of mRNA processing64/3246137/187231.55e-152.75e-1364
GO:004802419ProstateTumorregulation of mRNA splicing, via spliceosome51/3246101/187232.29e-142.97e-1251
GO:000038015ProstateTumoralternative mRNA splicing, via spliceosome35/324677/187239.41e-093.55e-0735
GO:000038115ProstateTumorregulation of alternative mRNA splicing, via spliceosome29/324660/187233.18e-081.02e-0629
GO:000838027SkinAKRNA splicing111/1910434/187231.85e-205.49e-17111
GO:190331125SkinAKregulation of mRNA metabolic process81/1910288/187237.27e-188.61e-1581
GO:004348428SkinAKregulation of RNA splicing54/1910148/187239.66e-189.53e-1554
GO:000037526SkinAKRNA splicing, via transesterification reactions85/1910324/187231.16e-167.62e-1485
Page: 1 2 3 4 5 6 7 8 9 10 11 12 

check button Enriched KEGG pathways.
Pathway IDTissueDisease StageDescriptionGene RatioBg Ratiopvaluep.adjustqvalueCount
Page: 1 

Top

Cell-cell communication analysis

check buttonIdentification of potential cell-cell interactions between two cell types and their ligand-receptor pairs for different disease states
LigandReceptorLRpairPathwayTissueDisease Stage
Page: 1 

Top

Single-cell gene regulatory network inference analysis

check buttonFind out the significant the regulons (TFs) and the target genes of each regulon across cell types for different disease states
TFCell TypeTissueDisease StageTarget GeneRSSRegulon Activity
∗The dot plots of a searched regulon are shown for all cell subpopulations in each disease state of each tissue based on the regulon specific score inferred using pySCENIC and by calculating the average expression.
Page: 1 

Top

Somatic mutation of malignant transformation related genes

check buttonAnnotation of somatic variants for genes involved in malignant transformation
Hugo SymbolVariant ClassVariant ClassificationdbSNP RSHGVScHGVSpHGVSp ShortSWISSPROTBIOTYPESIFTPolyPhenTumor Sample BarcodeTissueHistologySexAgeStageTherapy TypesDrugsOutcome
WTAPSNVMissense_Mutationc.152N>Cp.Asp51Alap.D51AQ15007protein_codingtolerated(0.07)possibly_damaging(0.78)TCGA-A2-A04P-01Breastbreast invasive carcinomaFemale<65III/IVChemotherapytaxolPD
WTAPSNVMissense_Mutationc.236G>Ap.Arg79Glnp.R79QQ15007protein_codingdeleterious(0.04)benign(0.38)TCGA-A8-A07R-01Breastbreast invasive carcinomaFemale>=65III/IVAncillaryzoledronicSD
WTAPSNVMissense_Mutationrs375840138c.1001N>Tp.Ala334Valp.A334VQ15007protein_codingtolerated_low_confidence(0.33)benign(0)TCGA-D8-A1J8-01Breastbreast invasive carcinomaFemale>=65I/IIHormone TherapynolvadexSD
WTAPSNVMissense_Mutationc.485N>Cp.Arg162Prop.R162PQ15007protein_codingdeleterious(0)possibly_damaging(0.899)TCGA-D8-A1XB-01Breastbreast invasive carcinomaFemale<65I/IIUnknownUnknownSD
WTAPSNVMissense_Mutationrs369657864c.932A>Gp.Asn311Serp.N311SQ15007protein_codingtolerated_low_confidence(0.51)benign(0.025)TCGA-XX-A89A-01Breastbreast invasive carcinomaFemale>=65I/IIUnknownUnknownSD
WTAPinsertionNonsense_Mutationnovelc.573_574insCCAACTGCACTCCAGCCTGGGCTACAGAGTGAGACTCCATCCTAAp.Lys191_Lys192insProThrAlaLeuGlnProGlyLeuGlnSerGluThrProSerTerp.K191_K192insPTALQPGLQSETPS*Q15007protein_codingTCGA-A2-A04P-01Breastbreast invasive carcinomaFemale<65III/IVChemotherapytaxolPD
WTAPinsertionFrame_Shift_Insnovelc.929_930insCTTGCTTTGTGGCAGGCACp.Asn311LeufsTer7p.N311Lfs*7Q15007protein_codingTCGA-A8-A06X-01Breastbreast invasive carcinomaFemale>=65I/IIUnknownUnknownSD
WTAPinsertionFrame_Shift_Insnovelc.931_932insAAGAAACATTTTTCAATGTTp.Asn311LysfsTer26p.N311Kfs*26Q15007protein_codingTCGA-A8-A06X-01Breastbreast invasive carcinomaFemale>=65I/IIUnknownUnknownSD
WTAPSNVMissense_Mutationnovelc.1082A>Gp.Asp361Glyp.D361GQ15007protein_codingdeleterious_low_confidence(0.01)benign(0.084)TCGA-2W-A8YY-01Cervixcervical & endocervical cancerFemale<65I/IIChemotherapycisplatinCR
WTAPSNVMissense_Mutationc.448N>Cp.Asp150Hisp.D150HQ15007protein_codingdeleterious(0.03)probably_damaging(0.98)TCGA-DG-A2KK-01Cervixcervical & endocervical cancerFemale<65III/IVChemotherapycisplatinSD
Page: 1 2 3 4 5 

Top

Related drugs of malignant transformation related genes

check buttonIdentification of chemicals and drugs interact with genes involved in malignant transfromation
(DGIdb 4.0)
Entrez IDSymbolCategoryInteraction TypesDrug Claim NameDrug NamePMIDs
Page: 1