
|
|||||
|
 | |
| |
| |
| |
| |
| |
|
Gene: WDR4 |
Gene summary for WDR4 |
| Gene information | Species | Human | Gene symbol | WDR4 | Gene ID | 10785 |
| Gene name | WD repeat domain 4 | |
| Gene Alias | GAMOS6 | |
| Cytomap | 21q22.3 | |
| Gene Type | protein-coding | GO ID | GO:0001510 | UniProtAcc | P57081 |
Top |
Malignant transformation analysis |
| Identification of the aberrant gene expression in precancerous and cancerous lesions by comparing the gene expression of stem-like cells in diseased tissues with normal stem cells |
| Entrez ID | Symbol | Replicates | Species | Organ | Tissue | Adj P-value | Log2FC | Malignancy |
| 10785 | WDR4 | LZE8T | Human | Esophagus | ESCC | 1.10e-02 | 1.68e-01 | 0.067 |
| 10785 | WDR4 | LZE24T | Human | Esophagus | ESCC | 2.32e-20 | 4.57e-01 | 0.0596 |
| 10785 | WDR4 | P2T-E | Human | Esophagus | ESCC | 6.47e-06 | 9.31e-02 | 0.1177 |
| 10785 | WDR4 | P4T-E | Human | Esophagus | ESCC | 1.06e-14 | 3.06e-01 | 0.1323 |
| 10785 | WDR4 | P5T-E | Human | Esophagus | ESCC | 1.01e-13 | 2.66e-01 | 0.1327 |
| 10785 | WDR4 | P9T-E | Human | Esophagus | ESCC | 3.05e-07 | 1.61e-01 | 0.1131 |
| 10785 | WDR4 | P10T-E | Human | Esophagus | ESCC | 5.46e-16 | 3.29e-01 | 0.116 |
| 10785 | WDR4 | P11T-E | Human | Esophagus | ESCC | 3.25e-05 | 2.30e-01 | 0.1426 |
| 10785 | WDR4 | P12T-E | Human | Esophagus | ESCC | 2.29e-10 | 2.69e-01 | 0.1122 |
| 10785 | WDR4 | P15T-E | Human | Esophagus | ESCC | 4.01e-11 | 2.52e-01 | 0.1149 |
| 10785 | WDR4 | P16T-E | Human | Esophagus | ESCC | 5.03e-05 | 1.15e-01 | 0.1153 |
| 10785 | WDR4 | P17T-E | Human | Esophagus | ESCC | 2.60e-06 | 2.63e-01 | 0.1278 |
| 10785 | WDR4 | P19T-E | Human | Esophagus | ESCC | 3.75e-07 | 4.41e-01 | 0.1662 |
| 10785 | WDR4 | P20T-E | Human | Esophagus | ESCC | 2.32e-06 | 1.56e-01 | 0.1124 |
| 10785 | WDR4 | P21T-E | Human | Esophagus | ESCC | 5.65e-31 | 6.67e-01 | 0.1617 |
| 10785 | WDR4 | P22T-E | Human | Esophagus | ESCC | 1.78e-09 | 1.84e-01 | 0.1236 |
| 10785 | WDR4 | P23T-E | Human | Esophagus | ESCC | 7.44e-14 | 2.75e-01 | 0.108 |
| 10785 | WDR4 | P24T-E | Human | Esophagus | ESCC | 4.27e-08 | 2.39e-01 | 0.1287 |
| 10785 | WDR4 | P26T-E | Human | Esophagus | ESCC | 1.08e-09 | 2.43e-01 | 0.1276 |
| 10785 | WDR4 | P27T-E | Human | Esophagus | ESCC | 1.77e-05 | 1.94e-01 | 0.1055 |
| Page: 1 2 3 4 |
| Tissue | Expression Dynamics | Abbreviation |
| Esophagus | 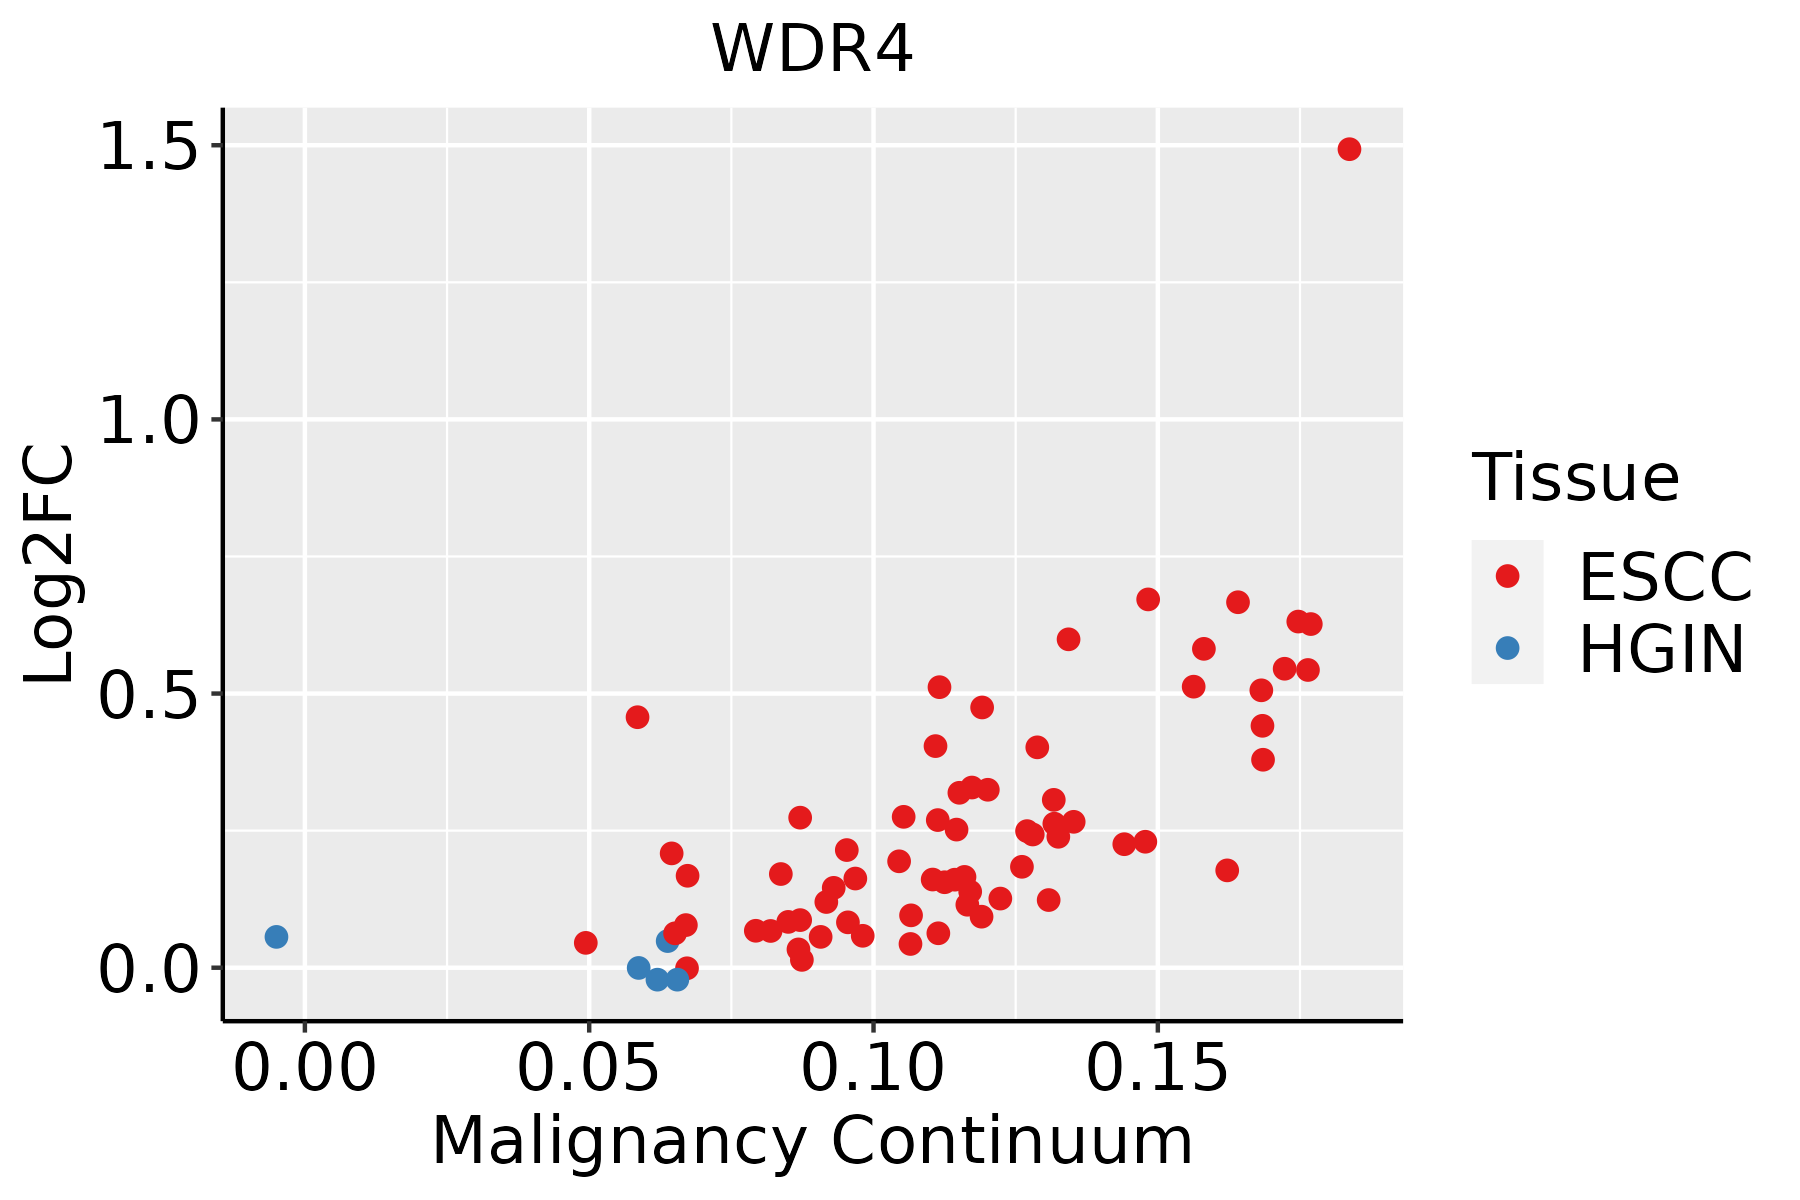 | ESCC: Esophageal squamous cell carcinoma |
| HGIN: High-grade intraepithelial neoplasias | ||
| LGIN: Low-grade intraepithelial neoplasias | ||
| Oral Cavity | 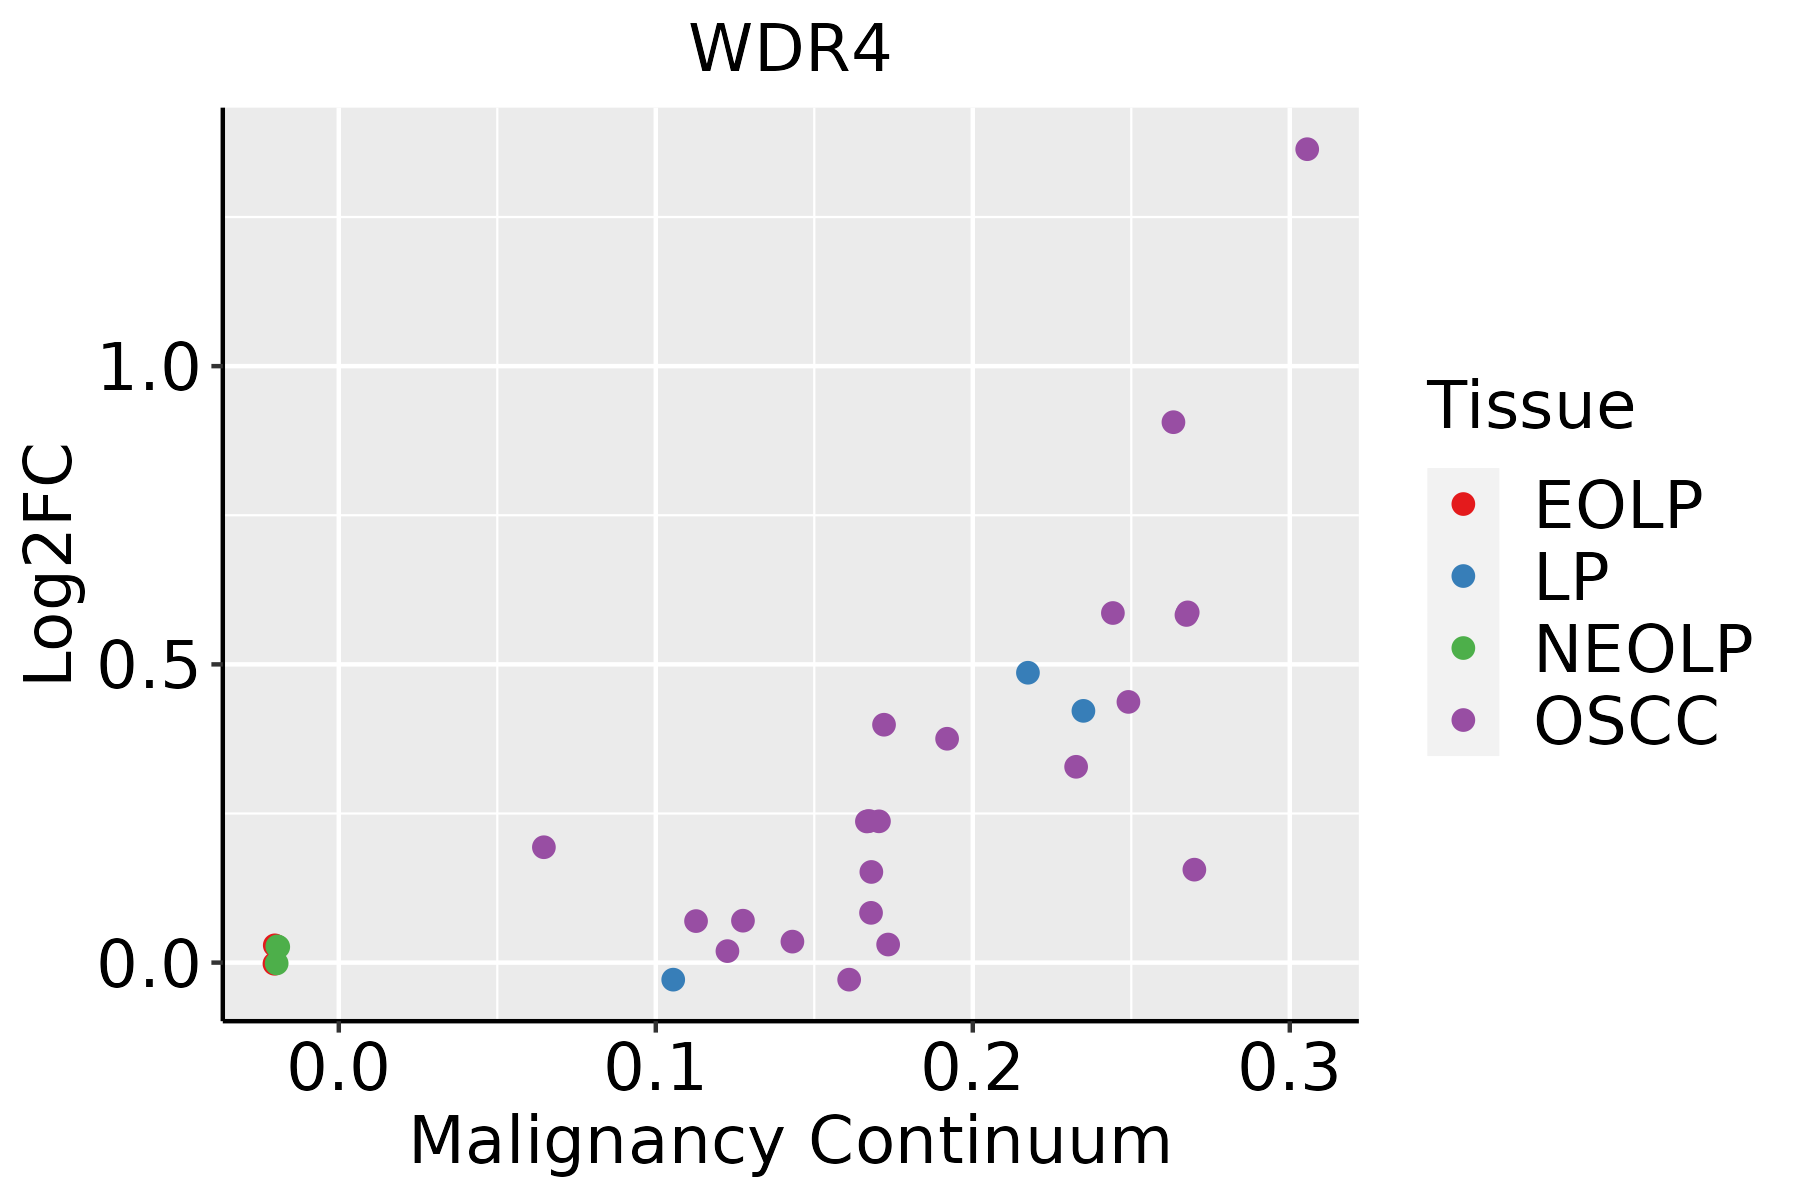 | EOLP: Erosive Oral lichen planus |
| LP: leukoplakia | ||
| NEOLP: Non-erosive oral lichen planus | ||
| OSCC: Oral squamous cell carcinoma | ||
| Skin |  | AK: Actinic keratosis |
| cSCC: Cutaneous squamous cell carcinoma | ||
| SCCIS:squamous cell carcinoma in situ |
| ∗log2FC in expression of this searched gene in stem-like cells from each diseased tissue sample relative to stem-like cells in normal samples in each tissue plotted against the malignancy continuum. Samples are colored based on if they are from different disease stage. |
Top |
Malignant transformation related pathway analysis |
| Find out the enriched GO biological processes and KEGG pathways involved in transition from healthy to precancer to cancer |
| Tissue | Disease Stage | Enriched GO biological Processes |
| Colorectum | AD |  |
| Colorectum | SER |  |
| Colorectum | MSS |  |
| Colorectum | MSI-H |  |
| Colorectum | FAP |  |
| ∗Top 15 enriched GO BP terms are showed in the bar plot of each disease state in each tissue. Each row represents a significant GO biological process which is colored according to the -log10(p.adjust). |
| Page: 1 2 3 4 5 6 7 8 9 |
| GO ID | Tissue | Disease Stage | Description | Gene Ratio | Bg Ratio | pvalue | p.adjust | Count |
| GO:002261312 | Liver | Cirrhotic | ribonucleoprotein complex biogenesis | 231/4634 | 463/18723 | 3.28e-32 | 6.86e-29 | 231 |
| GO:004225412 | Liver | Cirrhotic | ribosome biogenesis | 154/4634 | 299/18723 | 1.18e-23 | 6.72e-21 | 154 |
| GO:000636412 | Liver | Cirrhotic | rRNA processing | 115/4634 | 225/18723 | 1.12e-17 | 1.64e-15 | 115 |
| GO:00160724 | Liver | Cirrhotic | rRNA metabolic process | 119/4634 | 236/18723 | 1.19e-17 | 1.70e-15 | 119 |
| GO:00224117 | Liver | Cirrhotic | cellular component disassembly | 182/4634 | 443/18723 | 1.59e-14 | 1.54e-12 | 182 |
| GO:001623611 | Liver | Cirrhotic | macroautophagy | 129/4634 | 291/18723 | 1.75e-13 | 1.41e-11 | 129 |
| GO:00344701 | Liver | Cirrhotic | ncRNA processing | 158/4634 | 395/18723 | 1.09e-11 | 6.96e-10 | 158 |
| GO:19030084 | Liver | Cirrhotic | organelle disassembly | 59/4634 | 114/18723 | 4.82e-10 | 2.27e-08 | 59 |
| GO:004259412 | Liver | Cirrhotic | response to starvation | 87/4634 | 197/18723 | 1.85e-09 | 7.78e-08 | 87 |
| GO:004227412 | Liver | Cirrhotic | ribosomal small subunit biogenesis | 42/4634 | 73/18723 | 2.34e-09 | 9.73e-08 | 42 |
| GO:003166712 | Liver | Cirrhotic | response to nutrient levels | 174/4634 | 474/18723 | 3.08e-09 | 1.27e-07 | 174 |
| GO:00070332 | Liver | Cirrhotic | vacuole organization | 80/4634 | 180/18723 | 5.73e-09 | 2.25e-07 | 80 |
| GO:007149612 | Liver | Cirrhotic | cellular response to external stimulus | 123/4634 | 320/18723 | 3.27e-08 | 1.10e-06 | 123 |
| GO:00346603 | Liver | Cirrhotic | ncRNA metabolic process | 173/4634 | 485/18723 | 3.64e-08 | 1.21e-06 | 173 |
| GO:00004225 | Liver | Cirrhotic | autophagy of mitochondrion | 43/4634 | 81/18723 | 4.02e-08 | 1.31e-06 | 43 |
| GO:00617265 | Liver | Cirrhotic | mitochondrion disassembly | 43/4634 | 81/18723 | 4.02e-08 | 1.31e-06 | 43 |
| GO:00316686 | Liver | Cirrhotic | cellular response to extracellular stimulus | 96/4634 | 246/18723 | 4.55e-07 | 1.05e-05 | 96 |
| GO:00092675 | Liver | Cirrhotic | cellular response to starvation | 67/4634 | 156/18723 | 4.58e-07 | 1.05e-05 | 67 |
| GO:00316695 | Liver | Cirrhotic | cellular response to nutrient levels | 85/4634 | 215/18723 | 1.08e-06 | 2.20e-05 | 85 |
| GO:0000045 | Liver | Cirrhotic | autophagosome assembly | 43/4634 | 99/18723 | 3.56e-05 | 4.32e-04 | 43 |
| Page: 1 2 3 4 5 6 7 8 9 10 11 12 13 14 15 16 17 18 19 20 21 22 23 24 25 26 27 28 |
| Pathway ID | Tissue | Disease Stage | Description | Gene Ratio | Bg Ratio | pvalue | p.adjust | qvalue | Count |
| Page: 1 |
Top |
Cell-cell communication analysis |
| Identification of potential cell-cell interactions between two cell types and their ligand-receptor pairs for different disease states |
| Ligand | Receptor | LRpair | Pathway | Tissue | Disease Stage |
| Page: 1 |
Top |
Single-cell gene regulatory network inference analysis |
| Find out the significant the regulons (TFs) and the target genes of each regulon across cell types for different disease states |
| TF | Cell Type | Tissue | Disease Stage | Target Gene | RSS | Regulon Activity |
| ∗The dot plots of a searched regulon are shown for all cell subpopulations in each disease state of each tissue based on the regulon specific score inferred using pySCENIC and by calculating the average expression. |
| Page: 1 |
Top |
Somatic mutation of malignant transformation related genes |
| Annotation of somatic variants for genes involved in malignant transformation |
| Hugo Symbol | Variant Class | Variant Classification | dbSNP RS | HGVSc | HGVSp | HGVSp Short | SWISSPROT | BIOTYPE | SIFT | PolyPhen | Tumor Sample Barcode | Tissue | Histology | Sex | Age | Stage | Therapy Types | Drugs | Outcome |
| WDR4 | SNV | Missense_Mutation | c.504N>T | p.Lys168Asn | p.K168N | P57081 | protein_coding | deleterious(0) | probably_damaging(0.999) | TCGA-A2-A25C-01 | Breast | breast invasive carcinoma | Female | <65 | I/II | Chemotherapy | taxotere | SD | |
| WDR4 | insertion | Frame_Shift_Ins | novel | c.197_198insCTCCCAAACT | p.Thr68GlnfsTer17 | p.T68Qfs*17 | P57081 | protein_coding | TCGA-AN-A0FF-01 | Breast | breast invasive carcinoma | Female | <65 | I/II | Unknown | Unknown | SD | ||
| WDR4 | insertion | In_Frame_Ins | novel | c.195_196insACCTCAGGTGATCCGCTGGCCTCG | p.Leu65_Ala66insThrSerGlyAspProLeuAlaSer | p.L65_A66insTSGDPLAS | P57081 | protein_coding | TCGA-AN-A0FF-01 | Breast | breast invasive carcinoma | Female | <65 | I/II | Unknown | Unknown | SD | ||
| WDR4 | insertion | In_Frame_Ins | novel | c.306_307insCCACCTTCCTCTTCGCTGTCCTTCCCTGTG | p.Ala102_Arg103insProProSerSerSerLeuSerPheProVal | p.A102_R103insPPSSSLSFPV | P57081 | protein_coding | TCGA-BH-A0HU-01 | Breast | breast invasive carcinoma | Female | <65 | I/II | Chemotherapy | docetaxel | SD | ||
| WDR4 | deletion | Frame_Shift_Del | novel | c.735delN | p.Ala246ArgfsTer88 | p.A246Rfs*88 | P57081 | protein_coding | TCGA-D8-A27V-01 | Breast | breast invasive carcinoma | Female | <65 | I/II | Hormone Therapy | tamoxiphen | SD | ||
| WDR4 | SNV | Missense_Mutation | rs144346351 | c.238G>A | p.Asp80Asn | p.D80N | P57081 | protein_coding | deleterious(0) | probably_damaging(0.975) | TCGA-A6-6141-01 | Colorectum | colon adenocarcinoma | Male | <65 | I/II | Chemotherapy | 5-fu | SD |
| WDR4 | SNV | Missense_Mutation | rs543569485 | c.604N>A | p.Gly202Arg | p.G202R | P57081 | protein_coding | tolerated(0.16) | benign(0.021) | TCGA-AA-A01R-01 | Colorectum | colon adenocarcinoma | Male | <65 | III/IV | Chemotherapy | 5-fluorouracil | PD |
| WDR4 | SNV | Missense_Mutation | novel | c.1096G>A | p.Asp366Asn | p.D366N | P57081 | protein_coding | deleterious(0.01) | probably_damaging(0.924) | TCGA-AA-A02Y-01 | Colorectum | colon adenocarcinoma | Male | >=65 | I/II | Unknown | Unknown | SD |
| WDR4 | SNV | Missense_Mutation | c.14T>C | p.Val5Ala | p.V5A | P57081 | protein_coding | tolerated_low_confidence(1) | benign(0) | TCGA-D5-5539-01 | Colorectum | colon adenocarcinoma | Male | <65 | III/IV | Chemotherapy | 5-fu | PD | |
| WDR4 | deletion | Frame_Shift_Del | c.724delN | p.Gln242ArgfsTer92 | p.Q242Rfs*92 | P57081 | protein_coding | TCGA-G4-6588-01 | Colorectum | colon adenocarcinoma | Female | <65 | I/II | Unknown | Unknown | SD |
| Page: 1 2 3 4 |
Top |
Related drugs of malignant transformation related genes |
| Identification of chemicals and drugs interact with genes involved in malignant transfromation |
| (DGIdb 4.0) |
| Entrez ID | Symbol | Category | Interaction Types | Drug Claim Name | Drug Name | PMIDs |
| Page: 1 |

Copyright 2023-Present -The University of Texas Health Science Center at Houston |