
|
|||||
|
 | |
| |
| |
| |
| |
| |
|
Gene: UFD1 |
Gene summary for UFD1 |
| Gene information | Species | Human | Gene symbol | UFD1 | Gene ID | 7353 |
| Gene name | ubiquitin recognition factor in ER associated degradation 1 | |
| Gene Alias | UFD1L | |
| Cytomap | 22q11.21 | |
| Gene Type | protein-coding | GO ID | GO:0001501 | UniProtAcc | Q92890 |
Top |
Malignant transformation analysis |
| Identification of the aberrant gene expression in precancerous and cancerous lesions by comparing the gene expression of stem-like cells in diseased tissues with normal stem cells |
| Entrez ID | Symbol | Replicates | Species | Organ | Tissue | Adj P-value | Log2FC | Malignancy |
| 7353 | UFD1 | HTA11_2487_2000001011 | Human | Colorectum | SER | 4.75e-02 | 3.02e-01 | -0.1808 |
| 7353 | UFD1 | HTA11_1938_2000001011 | Human | Colorectum | AD | 3.01e-11 | 5.68e-01 | -0.0811 |
| 7353 | UFD1 | HTA11_347_2000001011 | Human | Colorectum | AD | 7.12e-07 | 2.96e-01 | -0.1954 |
| 7353 | UFD1 | HTA11_411_2000001011 | Human | Colorectum | SER | 3.12e-03 | 5.95e-01 | -0.2602 |
| 7353 | UFD1 | HTA11_2112_2000001011 | Human | Colorectum | SER | 1.06e-02 | 5.36e-01 | -0.2196 |
| 7353 | UFD1 | HTA11_83_2000001011 | Human | Colorectum | SER | 2.56e-03 | 4.30e-01 | -0.1526 |
| 7353 | UFD1 | HTA11_696_2000001011 | Human | Colorectum | AD | 3.58e-08 | 3.60e-01 | -0.1464 |
| 7353 | UFD1 | HTA11_1391_2000001011 | Human | Colorectum | AD | 4.04e-09 | 4.21e-01 | -0.059 |
| 7353 | UFD1 | HTA11_2992_2000001011 | Human | Colorectum | SER | 6.84e-03 | 3.83e-01 | -0.1706 |
| 7353 | UFD1 | HTA11_5212_2000001011 | Human | Colorectum | AD | 2.41e-03 | 3.74e-01 | -0.2061 |
| 7353 | UFD1 | HTA11_7696_3000711011 | Human | Colorectum | AD | 1.12e-03 | 2.38e-01 | 0.0674 |
| 7353 | UFD1 | HTA11_99999970781_79442 | Human | Colorectum | MSS | 8.13e-03 | -1.23e-01 | 0.294 |
| 7353 | UFD1 | HTA11_99999974143_84620 | Human | Colorectum | MSS | 1.71e-02 | -1.23e-01 | 0.3005 |
| 7353 | UFD1 | AEH-subject1 | Human | Endometrium | AEH | 1.87e-06 | 1.65e-01 | -0.3059 |
| 7353 | UFD1 | AEH-subject2 | Human | Endometrium | AEH | 5.86e-05 | 1.68e-01 | -0.2525 |
| 7353 | UFD1 | AEH-subject3 | Human | Endometrium | AEH | 4.06e-07 | 1.89e-01 | -0.2576 |
| 7353 | UFD1 | AEH-subject4 | Human | Endometrium | AEH | 2.95e-10 | 2.70e-01 | -0.2657 |
| 7353 | UFD1 | AEH-subject5 | Human | Endometrium | AEH | 3.72e-11 | 1.99e-01 | -0.2953 |
| 7353 | UFD1 | EEC-subject1 | Human | Endometrium | EEC | 8.77e-08 | 1.91e-01 | -0.2682 |
| 7353 | UFD1 | EEC-subject2 | Human | Endometrium | EEC | 3.99e-06 | 1.71e-01 | -0.2607 |
| Page: 1 2 3 4 |
| Tissue | Expression Dynamics | Abbreviation |
| Colorectum (GSE201348) |  | FAP: Familial adenomatous polyposis |
| CRC: Colorectal cancer | ||
| Colorectum (HTA11) |  | AD: Adenomas |
| SER: Sessile serrated lesions | ||
| MSI-H: Microsatellite-high colorectal cancer | ||
| MSS: Microsatellite stable colorectal cancer | ||
| Endometrium | 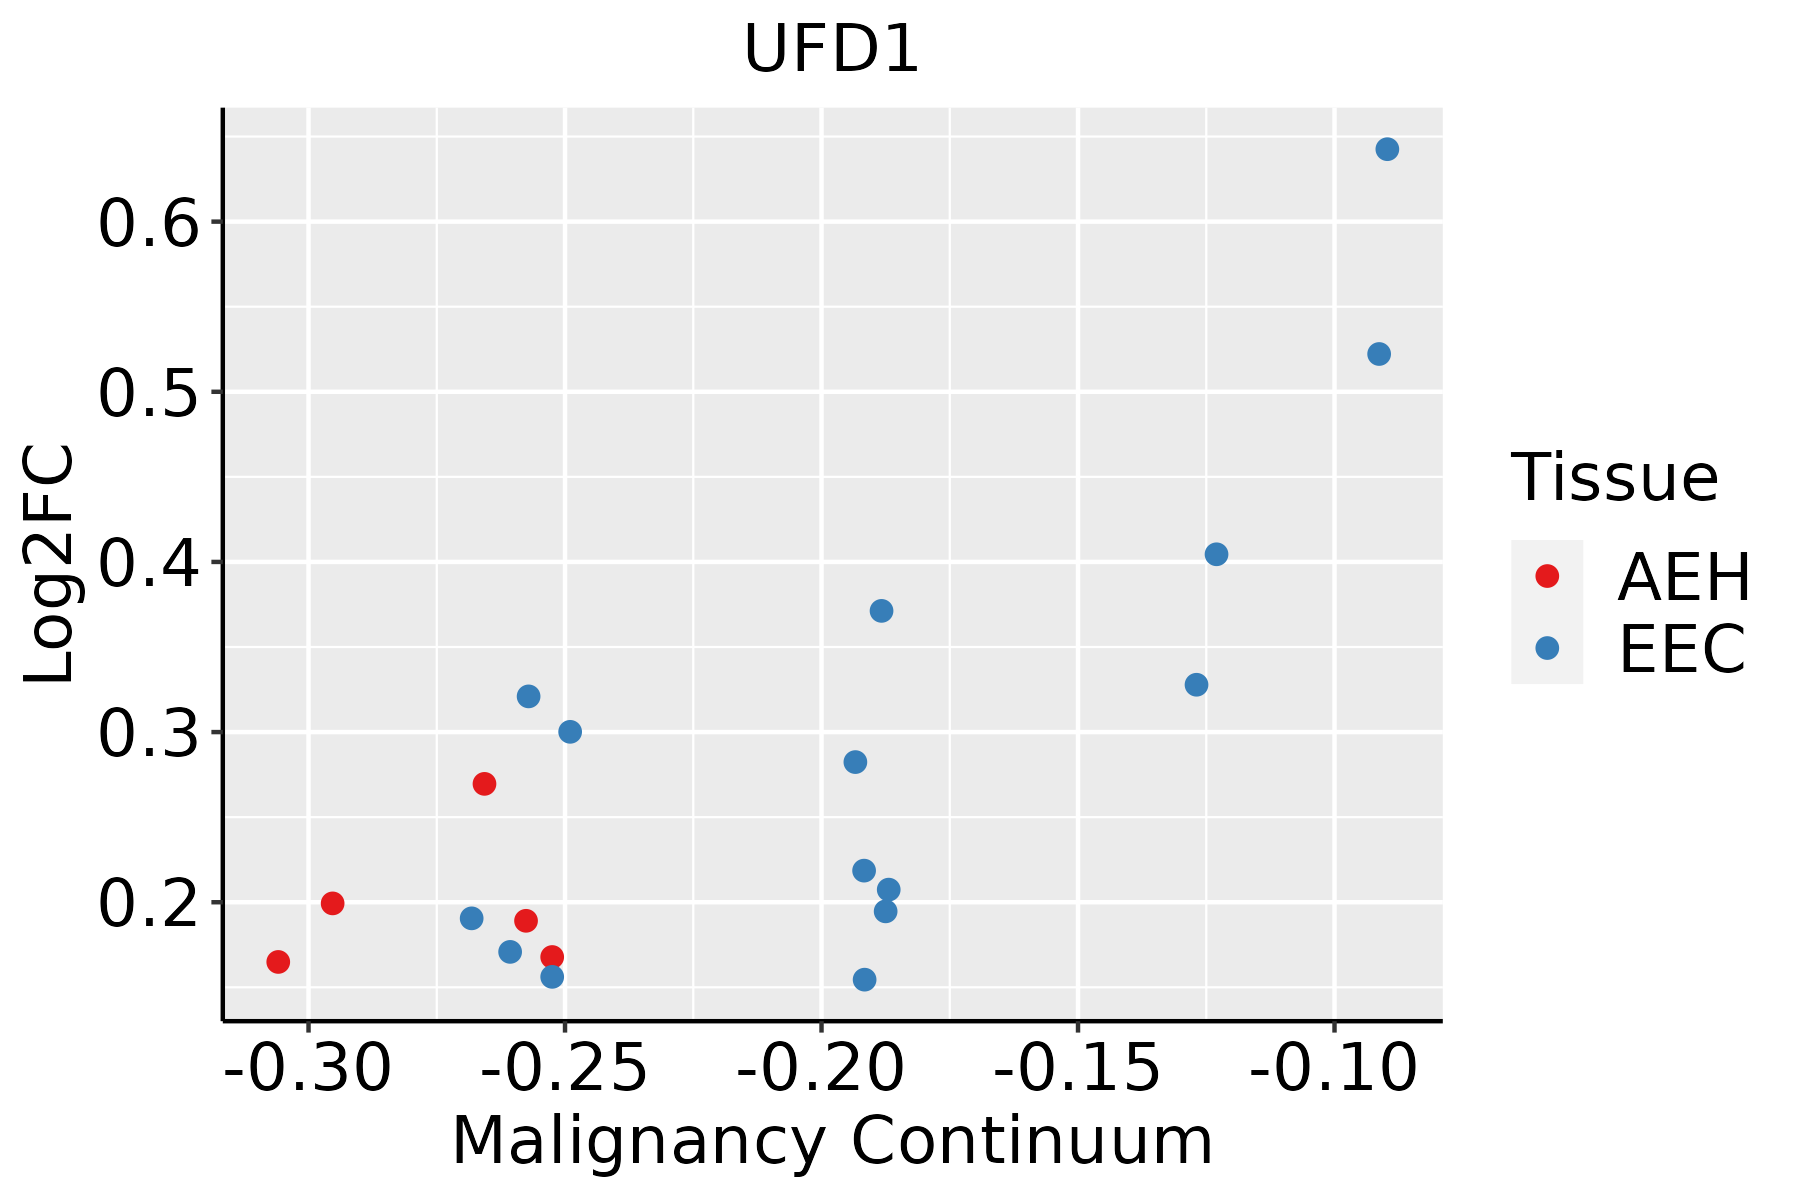 | AEH: Atypical endometrial hyperplasia |
| EEC: Endometrioid Cancer | ||
| Esophagus | 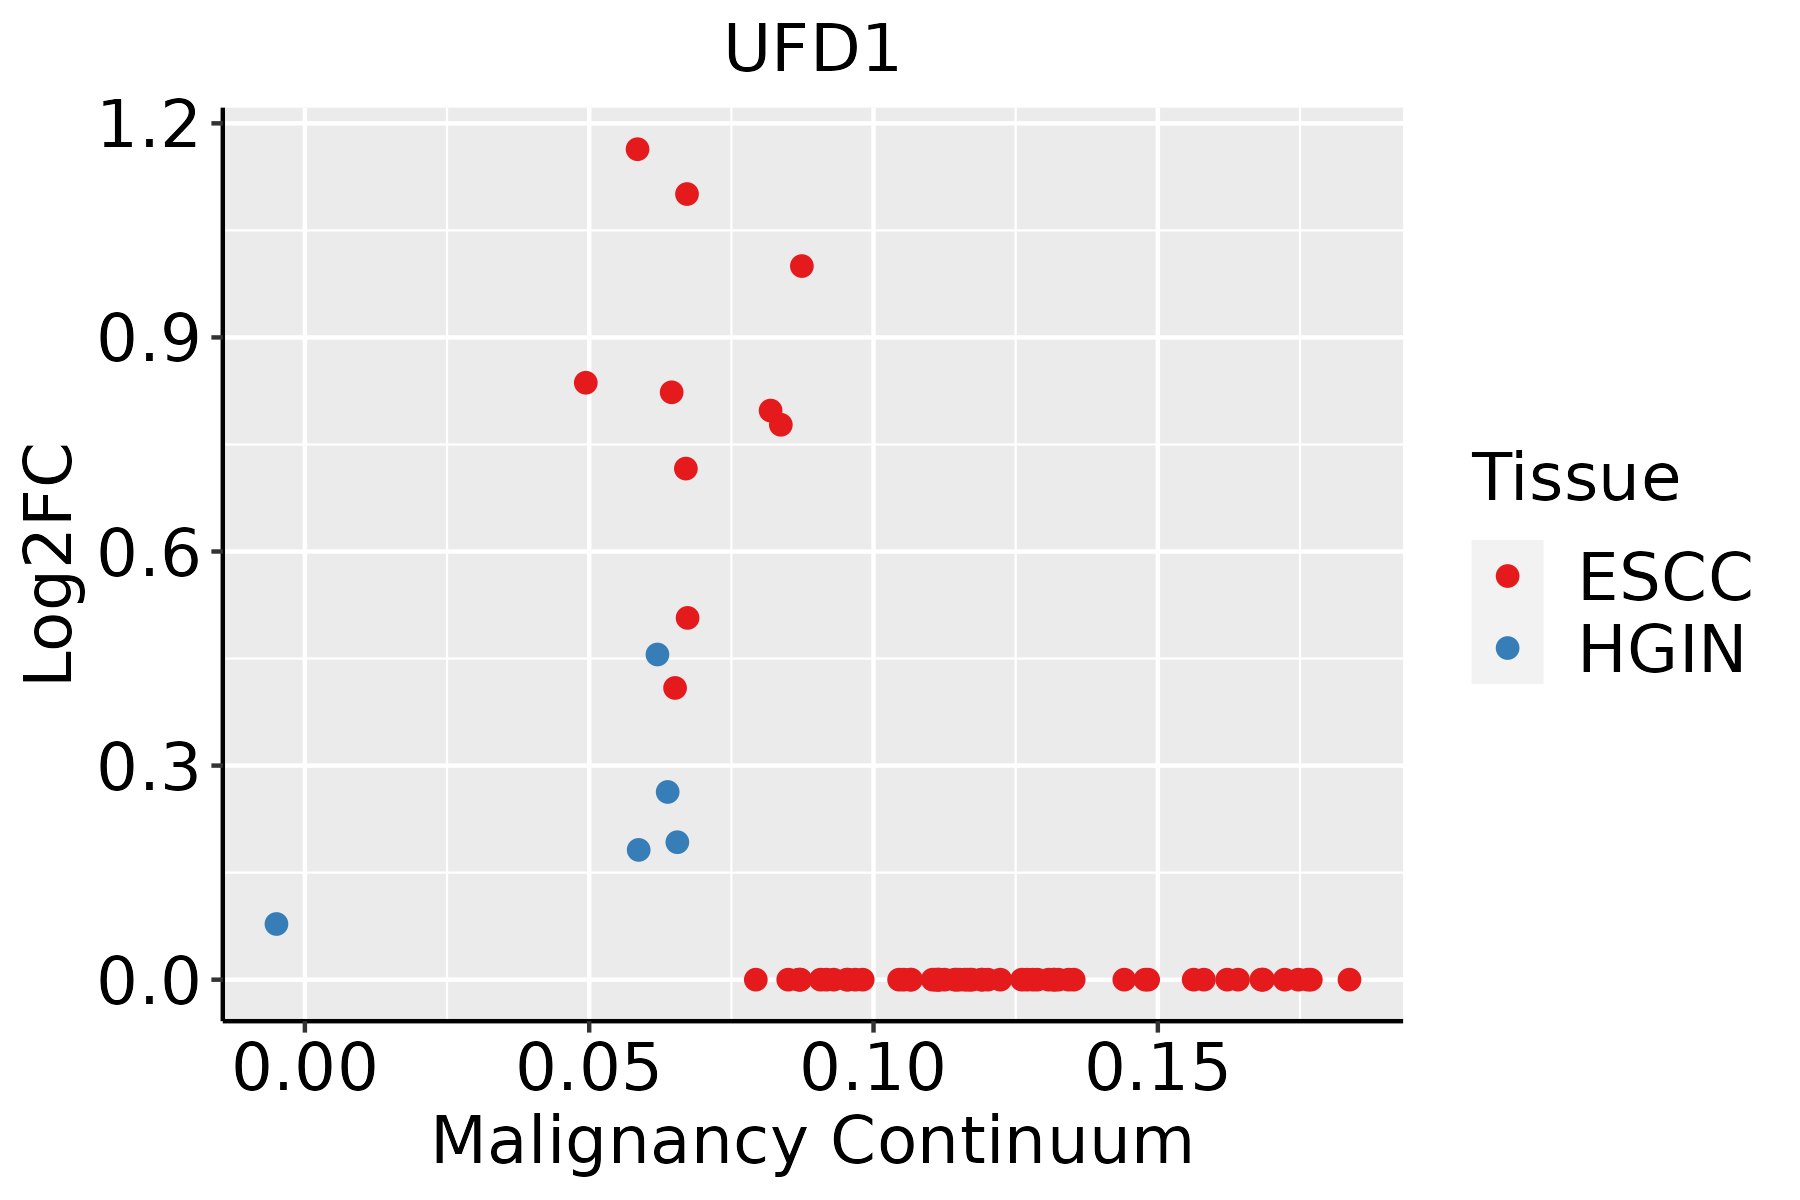 | ESCC: Esophageal squamous cell carcinoma |
| HGIN: High-grade intraepithelial neoplasias | ||
| LGIN: Low-grade intraepithelial neoplasias | ||
| Liver | 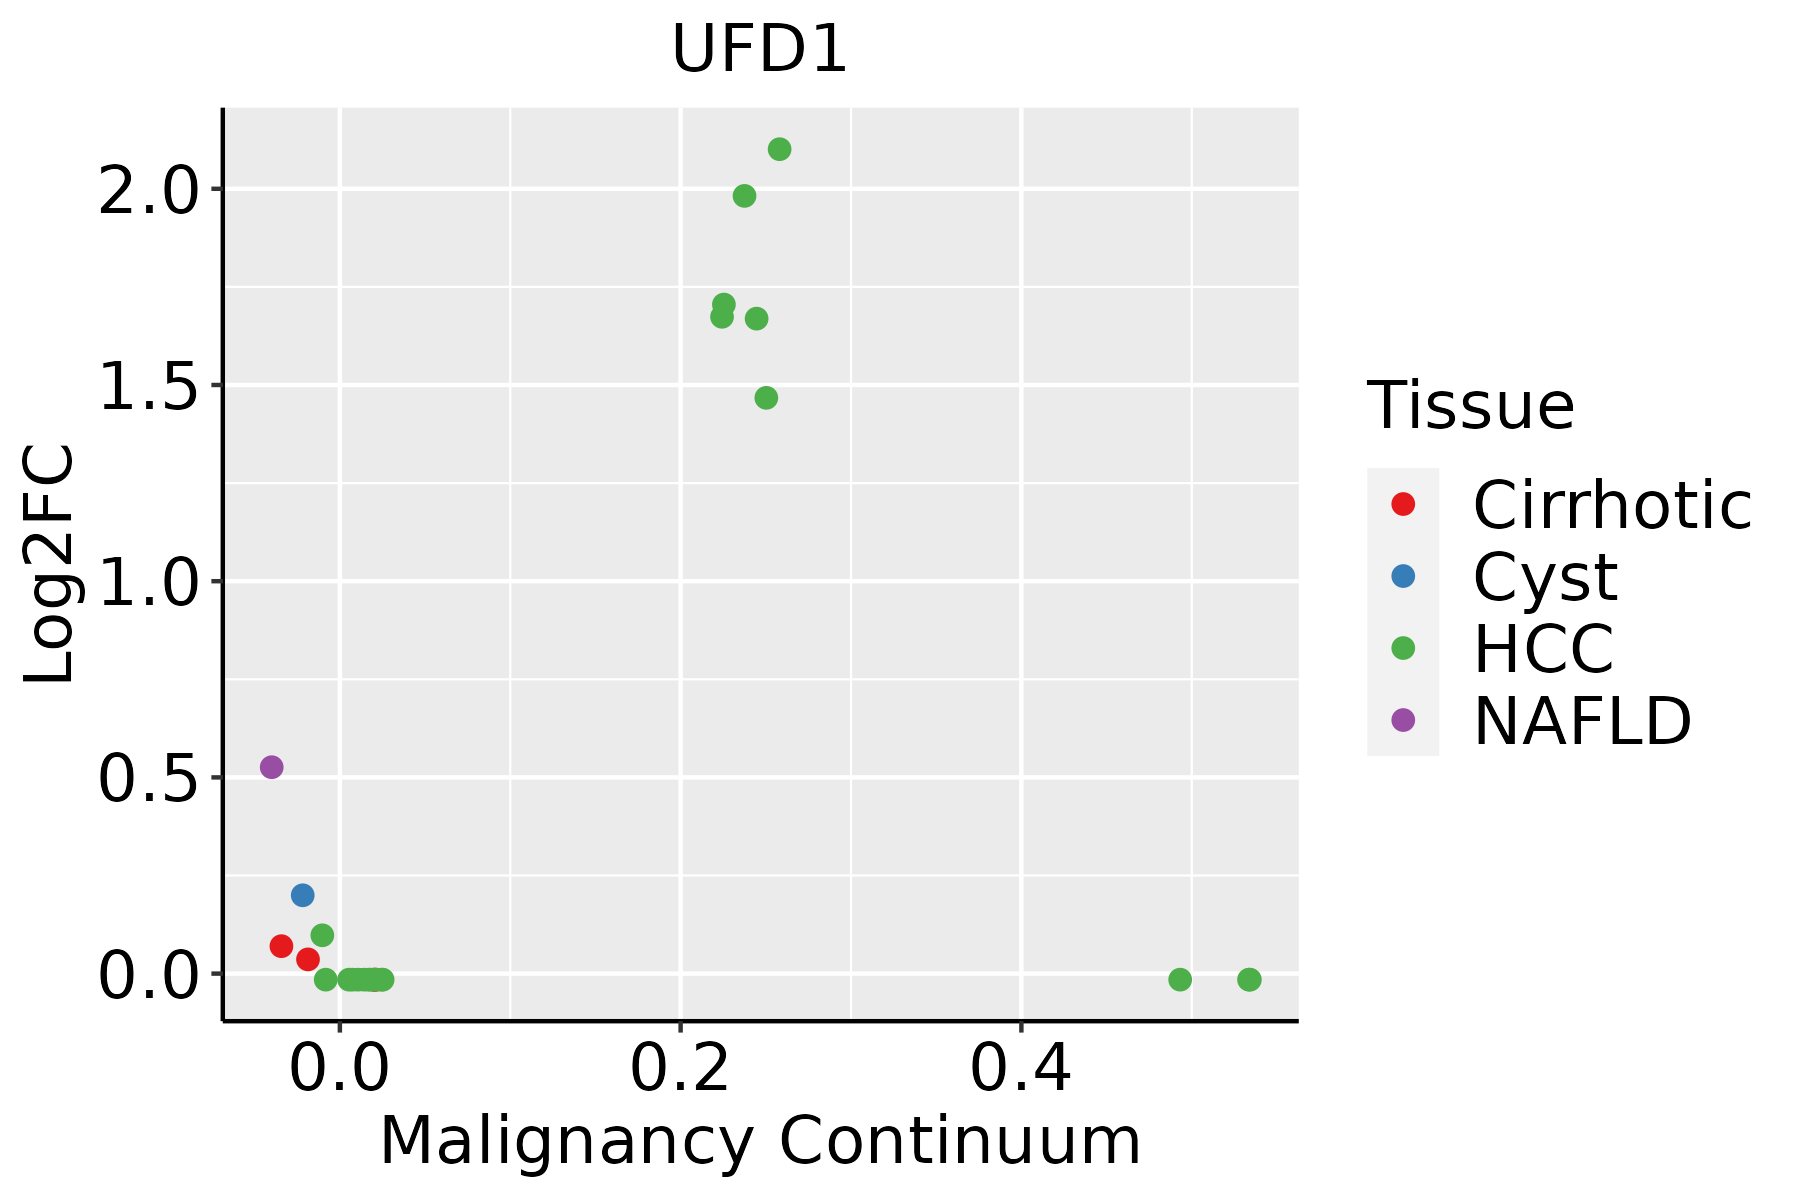 | HCC: Hepatocellular carcinoma |
| NAFLD: Non-alcoholic fatty liver disease | ||
| Thyroid | 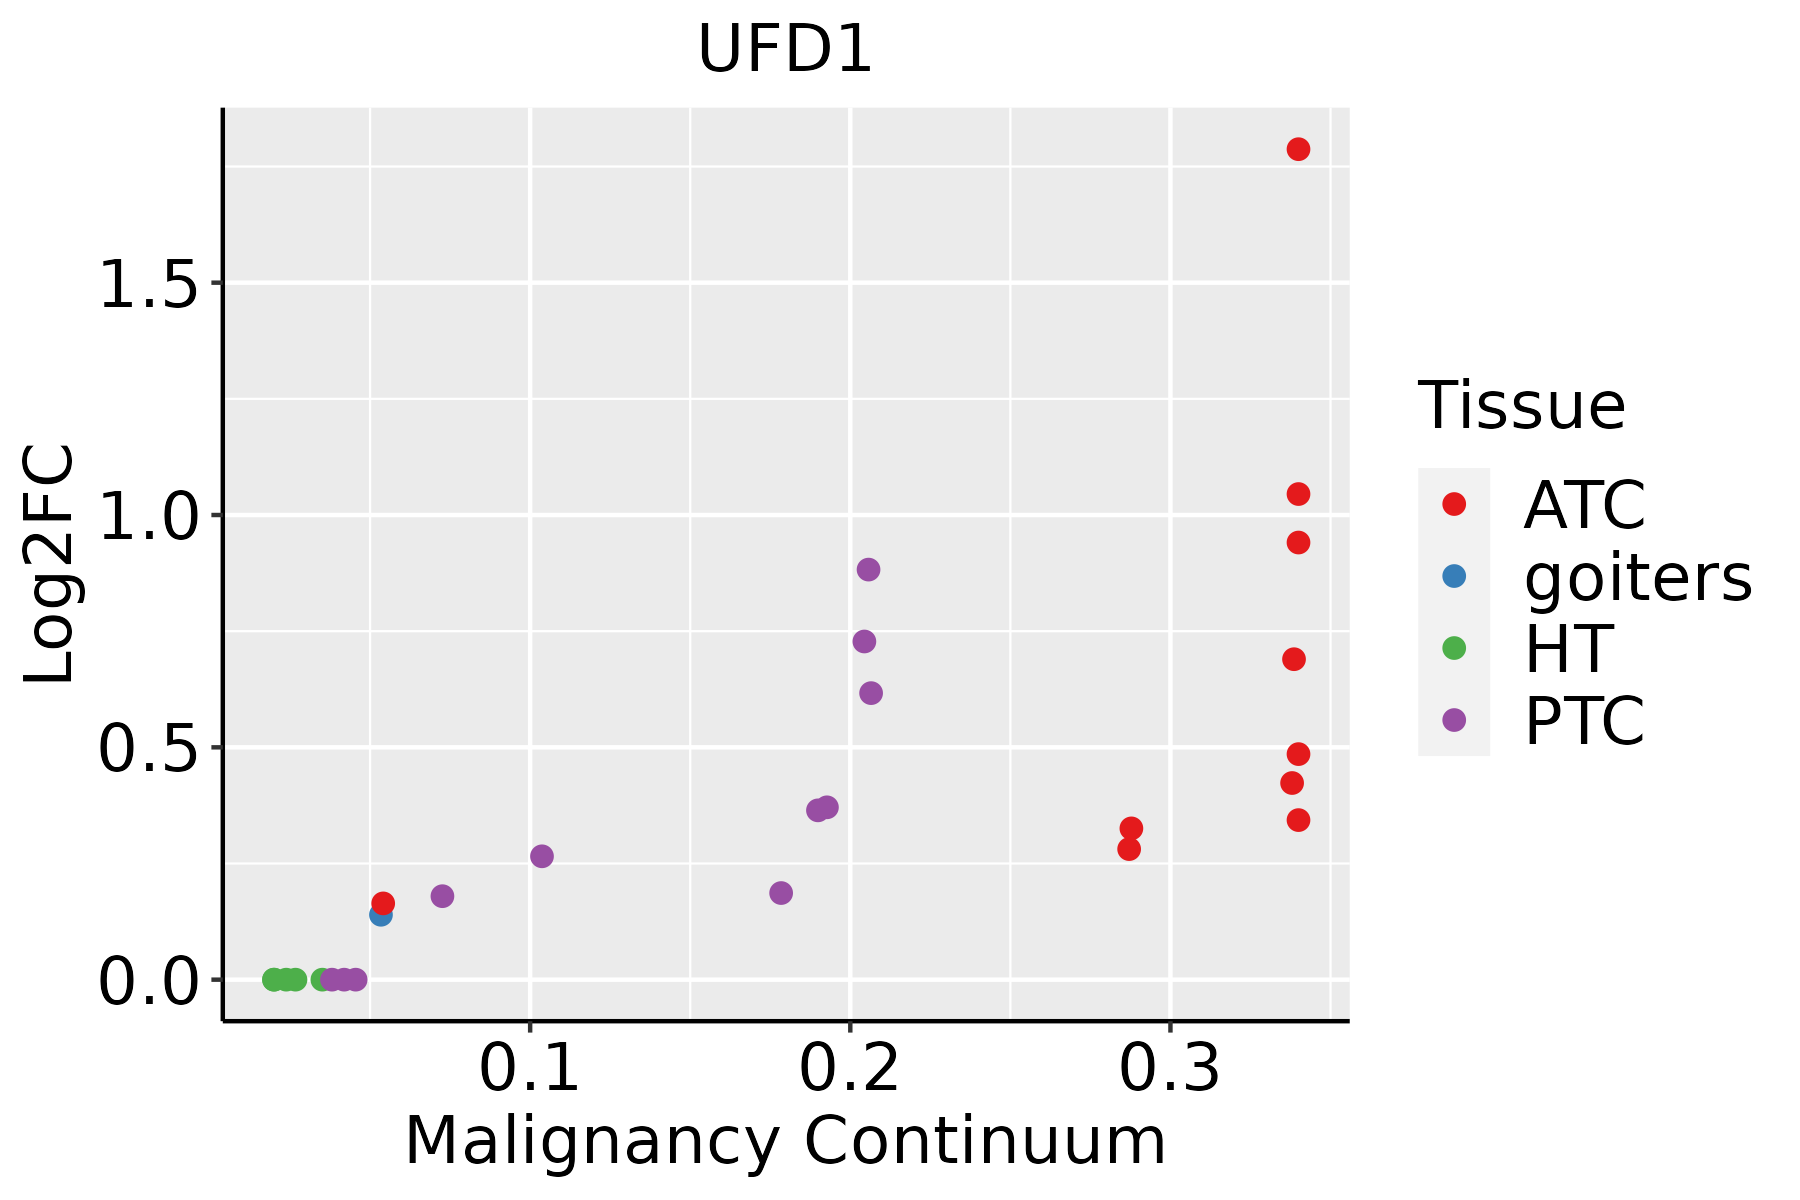 | ATC: Anaplastic thyroid cancer |
| HT: Hashimoto's thyroiditis | ||
| PTC: Papillary thyroid cancer |
| ∗log2FC in expression of this searched gene in stem-like cells from each diseased tissue sample relative to stem-like cells in normal samples in each tissue plotted against the malignancy continuum. Samples are colored based on if they are from different disease stage. |
Top |
Malignant transformation related pathway analysis |
| Find out the enriched GO biological processes and KEGG pathways involved in transition from healthy to precancer to cancer |
| Tissue | Disease Stage | Enriched GO biological Processes |
| Colorectum | AD |  |
| Colorectum | SER |  |
| Colorectum | MSS |  |
| Colorectum | MSI-H |  |
| Colorectum | FAP |  |
| ∗Top 15 enriched GO BP terms are showed in the bar plot of each disease state in each tissue. Each row represents a significant GO biological process which is colored according to the -log10(p.adjust). |
| Page: 1 2 3 4 5 6 7 8 9 |
| GO ID | Tissue | Disease Stage | Description | Gene Ratio | Bg Ratio | pvalue | p.adjust | Count |
| GO:00717123 | Liver | HCC | ER-associated misfolded protein catabolic process | 12/7958 | 12/18723 | 3.46e-05 | 3.45e-04 | 12 |
| GO:0032479 | Liver | HCC | regulation of type I interferon production | 60/7958 | 95/18723 | 3.84e-05 | 3.80e-04 | 60 |
| GO:0032606 | Liver | HCC | type I interferon production | 60/7958 | 95/18723 | 3.84e-05 | 3.80e-04 | 60 |
| GO:0039531 | Liver | HCC | regulation of viral-induced cytoplasmic pattern recognition receptor signaling pathway | 20/7958 | 24/18723 | 4.92e-05 | 4.70e-04 | 20 |
| GO:00028321 | Liver | HCC | negative regulation of response to biotic stimulus | 66/7958 | 108/18723 | 7.24e-05 | 6.50e-04 | 66 |
| GO:00028312 | Liver | HCC | regulation of response to biotic stimulus | 173/7958 | 327/18723 | 8.55e-05 | 7.48e-04 | 173 |
| GO:00395351 | Liver | HCC | regulation of RIG-I signaling pathway | 17/7958 | 20/18723 | 1.18e-04 | 9.87e-04 | 17 |
| GO:0050687 | Liver | HCC | negative regulation of defense response to virus | 18/7958 | 24/18723 | 1.27e-03 | 6.92e-03 | 18 |
| GO:00622072 | Liver | HCC | regulation of pattern recognition receptor signaling pathway | 59/7958 | 105/18723 | 3.18e-03 | 1.47e-02 | 59 |
| GO:0050688 | Liver | HCC | regulation of defense response to virus | 41/7958 | 69/18723 | 3.38e-03 | 1.54e-02 | 41 |
| GO:0050777 | Liver | HCC | negative regulation of immune response | 101/7958 | 194/18723 | 4.40e-03 | 1.90e-02 | 101 |
| GO:0039532 | Liver | HCC | negative regulation of viral-induced cytoplasmic pattern recognition receptor signaling pathway | 9/7958 | 11/18723 | 9.51e-03 | 3.60e-02 | 9 |
| GO:0010498113 | Thyroid | PTC | proteasomal protein catabolic process | 297/5968 | 490/18723 | 4.58e-40 | 9.63e-37 | 297 |
| GO:0043161113 | Thyroid | PTC | proteasome-mediated ubiquitin-dependent protein catabolic process | 254/5968 | 412/18723 | 3.91e-36 | 4.54e-33 | 254 |
| GO:0034976113 | Thyroid | PTC | response to endoplasmic reticulum stress | 161/5968 | 256/18723 | 1.14e-24 | 3.27e-22 | 161 |
| GO:0035966113 | Thyroid | PTC | response to topologically incorrect protein | 101/5968 | 159/18723 | 2.00e-16 | 1.66e-14 | 101 |
| GO:00365038 | Thyroid | PTC | ERAD pathway | 71/5968 | 107/18723 | 2.37e-13 | 1.22e-11 | 71 |
| GO:003043315 | Thyroid | PTC | ubiquitin-dependent ERAD pathway | 59/5968 | 85/18723 | 1.30e-12 | 5.91e-11 | 59 |
| GO:0035967113 | Thyroid | PTC | cellular response to topologically incorrect protein | 73/5968 | 116/18723 | 5.62e-12 | 2.41e-10 | 73 |
| GO:003052228 | Thyroid | PTC | intracellular receptor signaling pathway | 126/5968 | 265/18723 | 6.31e-08 | 1.31e-06 | 126 |
| Page: 1 2 3 4 5 6 7 8 9 10 11 12 |
| Pathway ID | Tissue | Disease Stage | Description | Gene Ratio | Bg Ratio | pvalue | p.adjust | qvalue | Count |
| hsa04141 | Colorectum | AD | Protein processing in endoplasmic reticulum | 80/2092 | 174/8465 | 5.96e-10 | 1.25e-08 | 7.96e-09 | 80 |
| hsa041411 | Colorectum | AD | Protein processing in endoplasmic reticulum | 80/2092 | 174/8465 | 5.96e-10 | 1.25e-08 | 7.96e-09 | 80 |
| hsa041412 | Colorectum | SER | Protein processing in endoplasmic reticulum | 60/1580 | 174/8465 | 4.20e-07 | 7.33e-06 | 5.32e-06 | 60 |
| hsa041413 | Colorectum | SER | Protein processing in endoplasmic reticulum | 60/1580 | 174/8465 | 4.20e-07 | 7.33e-06 | 5.32e-06 | 60 |
| hsa041414 | Colorectum | MSS | Protein processing in endoplasmic reticulum | 75/1875 | 174/8465 | 3.78e-10 | 8.44e-09 | 5.17e-09 | 75 |
| hsa041415 | Colorectum | MSS | Protein processing in endoplasmic reticulum | 75/1875 | 174/8465 | 3.78e-10 | 8.44e-09 | 5.17e-09 | 75 |
| hsa0414126 | Endometrium | AEH | Protein processing in endoplasmic reticulum | 62/1197 | 174/8465 | 5.97e-13 | 1.39e-11 | 1.01e-11 | 62 |
| hsa04141111 | Endometrium | AEH | Protein processing in endoplasmic reticulum | 62/1197 | 174/8465 | 5.97e-13 | 1.39e-11 | 1.01e-11 | 62 |
| hsa0414127 | Endometrium | EEC | Protein processing in endoplasmic reticulum | 64/1237 | 174/8465 | 2.17e-13 | 5.09e-12 | 3.80e-12 | 64 |
| hsa0414136 | Endometrium | EEC | Protein processing in endoplasmic reticulum | 64/1237 | 174/8465 | 2.17e-13 | 5.09e-12 | 3.80e-12 | 64 |
| hsa0414139 | Esophagus | HGIN | Protein processing in endoplasmic reticulum | 67/1383 | 174/8465 | 1.06e-12 | 2.16e-11 | 1.72e-11 | 67 |
| hsa04141114 | Esophagus | HGIN | Protein processing in endoplasmic reticulum | 67/1383 | 174/8465 | 1.06e-12 | 2.16e-11 | 1.72e-11 | 67 |
| hsa04141211 | Esophagus | ESCC | Protein processing in endoplasmic reticulum | 147/4205 | 174/8465 | 3.29e-22 | 1.10e-19 | 5.64e-20 | 147 |
| hsa04141310 | Esophagus | ESCC | Protein processing in endoplasmic reticulum | 147/4205 | 174/8465 | 3.29e-22 | 1.10e-19 | 5.64e-20 | 147 |
| Page: 1 |
Top |
Cell-cell communication analysis |
| Identification of potential cell-cell interactions between two cell types and their ligand-receptor pairs for different disease states |
| Ligand | Receptor | LRpair | Pathway | Tissue | Disease Stage |
| Page: 1 |
Top |
Single-cell gene regulatory network inference analysis |
| Find out the significant the regulons (TFs) and the target genes of each regulon across cell types for different disease states |
| TF | Cell Type | Tissue | Disease Stage | Target Gene | RSS | Regulon Activity |
| ∗The dot plots of a searched regulon are shown for all cell subpopulations in each disease state of each tissue based on the regulon specific score inferred using pySCENIC and by calculating the average expression. |
| Page: 1 |
Top |
Somatic mutation of malignant transformation related genes |
| Annotation of somatic variants for genes involved in malignant transformation |
| Hugo Symbol | Variant Class | Variant Classification | dbSNP RS | HGVSc | HGVSp | HGVSp Short | SWISSPROT | BIOTYPE | SIFT | PolyPhen | Tumor Sample Barcode | Tissue | Histology | Sex | Age | Stage | Therapy Types | Drugs | Outcome |
| Page: 1 |
Top |
Related drugs of malignant transformation related genes |
| Identification of chemicals and drugs interact with genes involved in malignant transfromation |
| (DGIdb 4.0) |
| Entrez ID | Symbol | Category | Interaction Types | Drug Claim Name | Drug Name | PMIDs |
| Page: 1 |

Copyright 2023-Present -The University of Texas Health Science Center at Houston |