
|
|||||
|
 | |
| |
| |
| |
| |
| |
|
Gene: UFC1 |
Gene summary for UFC1 |
| Gene information | Species | Human | Gene symbol | UFC1 | Gene ID | 51506 |
| Gene name | ubiquitin-fold modifier conjugating enzyme 1 | |
| Gene Alias | HSPC155 | |
| Cytomap | 1q23.3 | |
| Gene Type | protein-coding | GO ID | GO:0006464 | UniProtAcc | Q9Y3C8 |
Top |
Malignant transformation analysis |
| Identification of the aberrant gene expression in precancerous and cancerous lesions by comparing the gene expression of stem-like cells in diseased tissues with normal stem cells |
| Entrez ID | Symbol | Replicates | Species | Organ | Tissue | Adj P-value | Log2FC | Malignancy |
| 51506 | UFC1 | CA_HPV_1 | Human | Cervix | CC | 3.16e-05 | -1.54e-01 | 0.0264 |
| 51506 | UFC1 | CA_HPV_3 | Human | Cervix | CC | 1.02e-05 | 1.01e-01 | 0.0414 |
| 51506 | UFC1 | CCI_1 | Human | Cervix | CC | 2.02e-04 | -5.13e-01 | 0.528 |
| 51506 | UFC1 | CCI_2 | Human | Cervix | CC | 3.29e-02 | -4.84e-01 | 0.5249 |
| 51506 | UFC1 | CCI_3 | Human | Cervix | CC | 1.08e-06 | -5.39e-01 | 0.516 |
| 51506 | UFC1 | CCII_1 | Human | Cervix | CC | 2.03e-19 | -6.31e-01 | 0.3249 |
| 51506 | UFC1 | Tumor | Human | Cervix | CC | 2.32e-05 | -2.66e-01 | 0.1241 |
| 51506 | UFC1 | sample3 | Human | Cervix | CC | 1.10e-09 | -3.16e-01 | 0.1387 |
| 51506 | UFC1 | L1 | Human | Cervix | CC | 1.32e-07 | 1.39e-03 | 0.0802 |
| 51506 | UFC1 | T1 | Human | Cervix | CC | 2.30e-03 | -3.24e-01 | 0.0918 |
| 51506 | UFC1 | T3 | Human | Cervix | CC | 3.23e-10 | -3.49e-01 | 0.1389 |
| 51506 | UFC1 | HTA11_3410_2000001011 | Human | Colorectum | AD | 2.92e-07 | 2.43e-01 | 0.0155 |
| 51506 | UFC1 | HTA11_2487_2000001011 | Human | Colorectum | SER | 9.04e-10 | 4.72e-01 | -0.1808 |
| 51506 | UFC1 | HTA11_2951_2000001011 | Human | Colorectum | AD | 3.17e-03 | 5.67e-01 | 0.0216 |
| 51506 | UFC1 | HTA11_1938_2000001011 | Human | Colorectum | AD | 1.12e-14 | 7.38e-01 | -0.0811 |
| 51506 | UFC1 | HTA11_78_2000001011 | Human | Colorectum | AD | 3.77e-07 | 3.38e-01 | -0.1088 |
| 51506 | UFC1 | HTA11_347_2000001011 | Human | Colorectum | AD | 1.02e-32 | 7.18e-01 | -0.1954 |
| 51506 | UFC1 | HTA11_411_2000001011 | Human | Colorectum | SER | 1.28e-07 | 9.60e-01 | -0.2602 |
| 51506 | UFC1 | HTA11_2112_2000001011 | Human | Colorectum | SER | 1.94e-08 | 7.12e-01 | -0.2196 |
| 51506 | UFC1 | HTA11_3361_2000001011 | Human | Colorectum | AD | 1.17e-05 | 3.97e-01 | -0.1207 |
| Page: 1 2 3 4 5 6 7 8 9 10 11 12 |
| Tissue | Expression Dynamics | Abbreviation |
| Cervix | 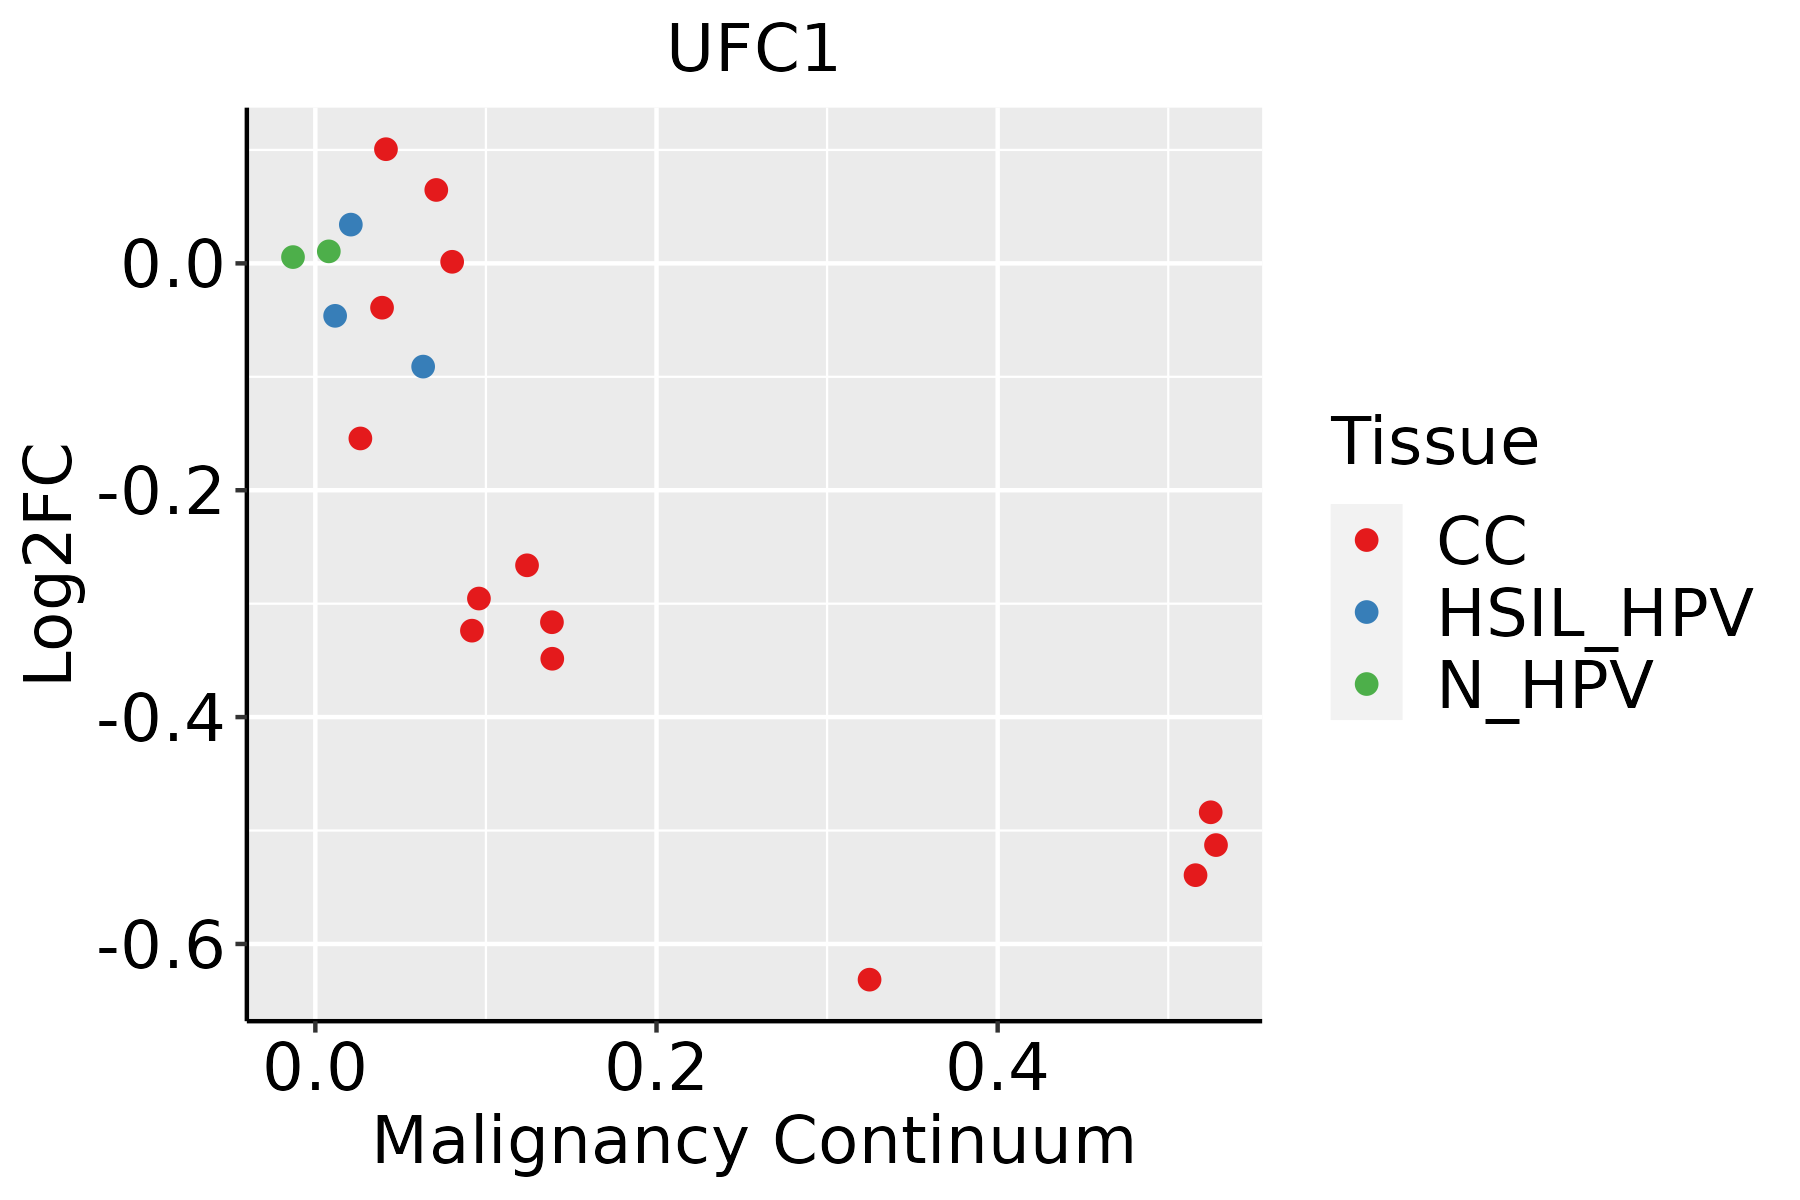 | CC: Cervix cancer |
| HSIL_HPV: HPV-infected high-grade squamous intraepithelial lesions | ||
| N_HPV: HPV-infected normal cervix | ||
| Colorectum (GSE201348) | 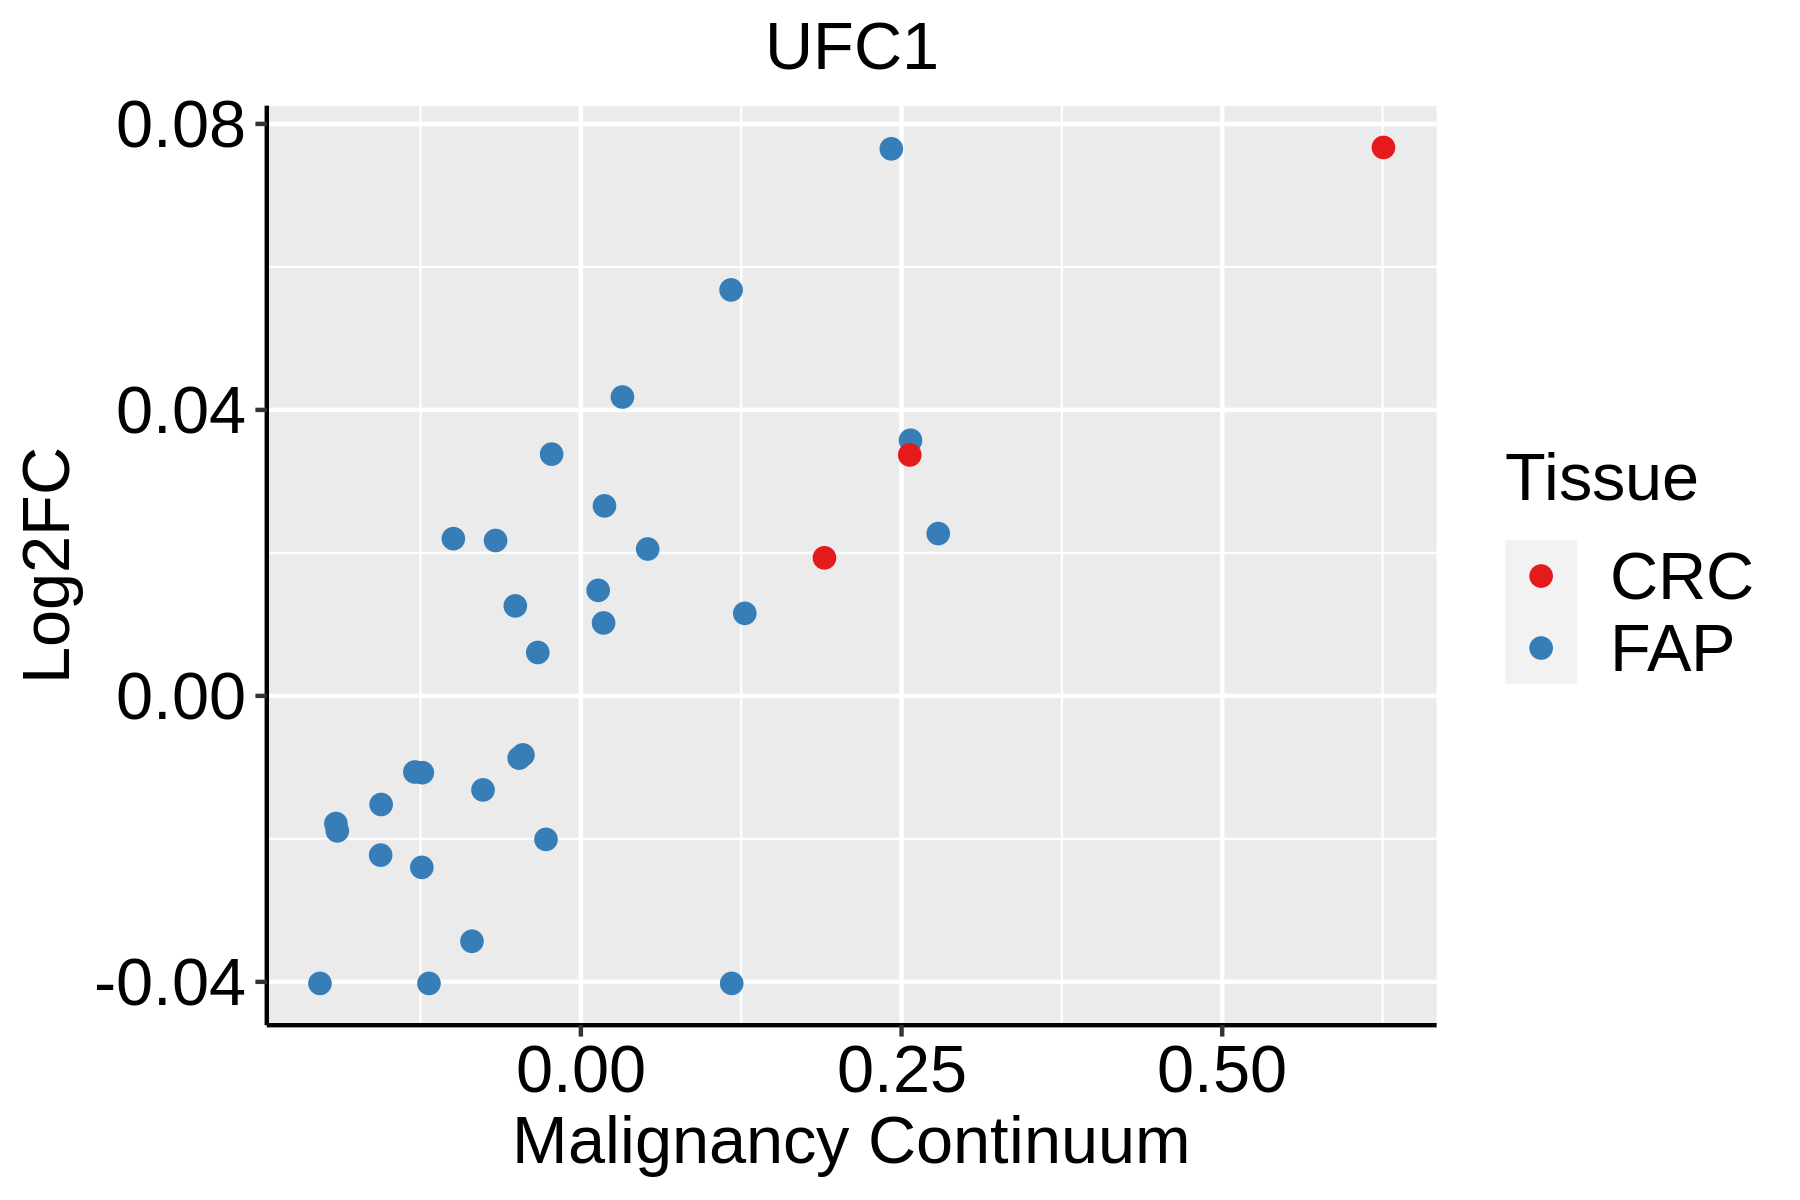 | FAP: Familial adenomatous polyposis |
| CRC: Colorectal cancer | ||
| Colorectum (HTA11) |  | AD: Adenomas |
| SER: Sessile serrated lesions | ||
| MSI-H: Microsatellite-high colorectal cancer | ||
| MSS: Microsatellite stable colorectal cancer | ||
| Endometrium |  | AEH: Atypical endometrial hyperplasia |
| EEC: Endometrioid Cancer | ||
| Esophagus |  | ESCC: Esophageal squamous cell carcinoma |
| HGIN: High-grade intraepithelial neoplasias | ||
| LGIN: Low-grade intraepithelial neoplasias | ||
| GC |  | CAG: Chronic atrophic gastritis |
| CAG with IM: Chronic atrophic gastritis with intestinal metaplasia | ||
| CSG: Chronic superficial gastritis | ||
| GC: Gastric cancer | ||
| SIM: Severe intestinal metaplasia | ||
| WIM: Wild intestinal metaplasia | ||
| Liver | 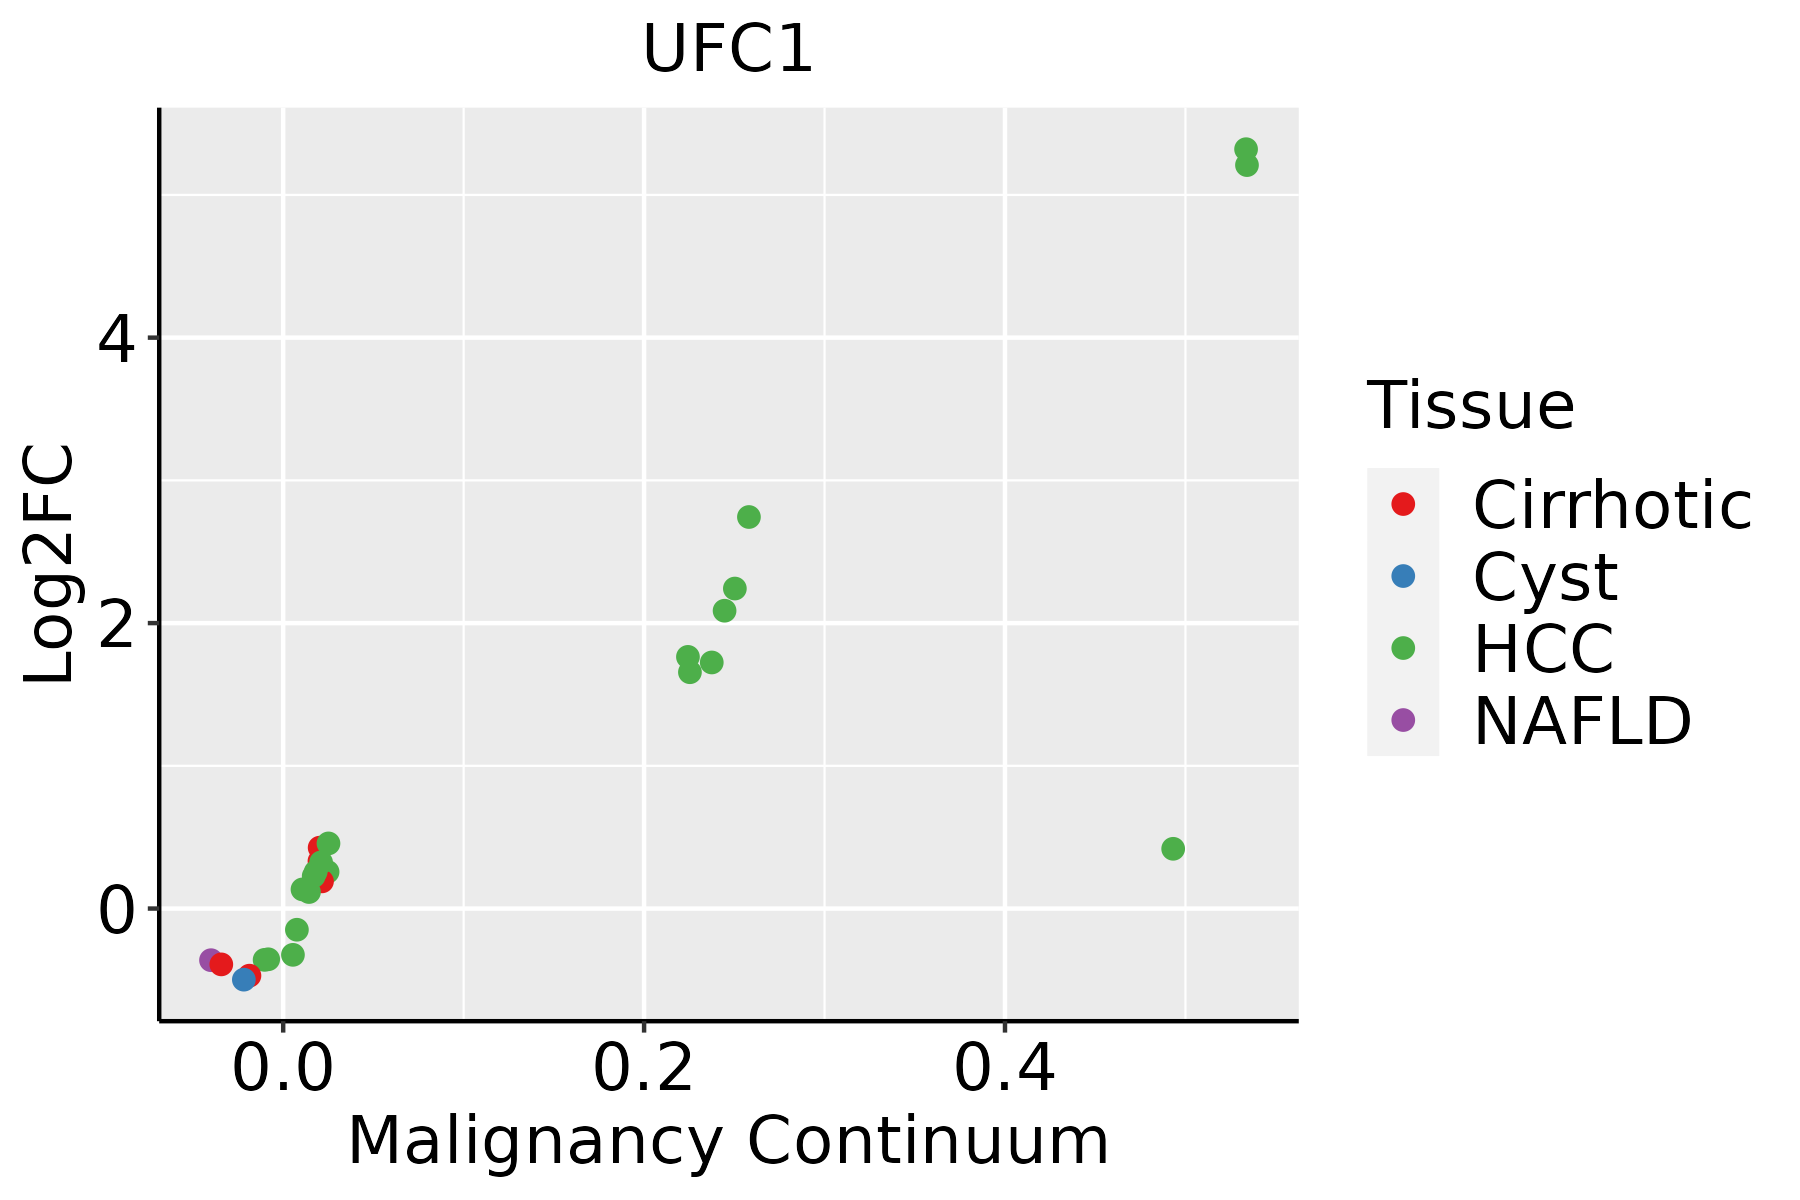 | HCC: Hepatocellular carcinoma |
| NAFLD: Non-alcoholic fatty liver disease | ||
| Oral Cavity | 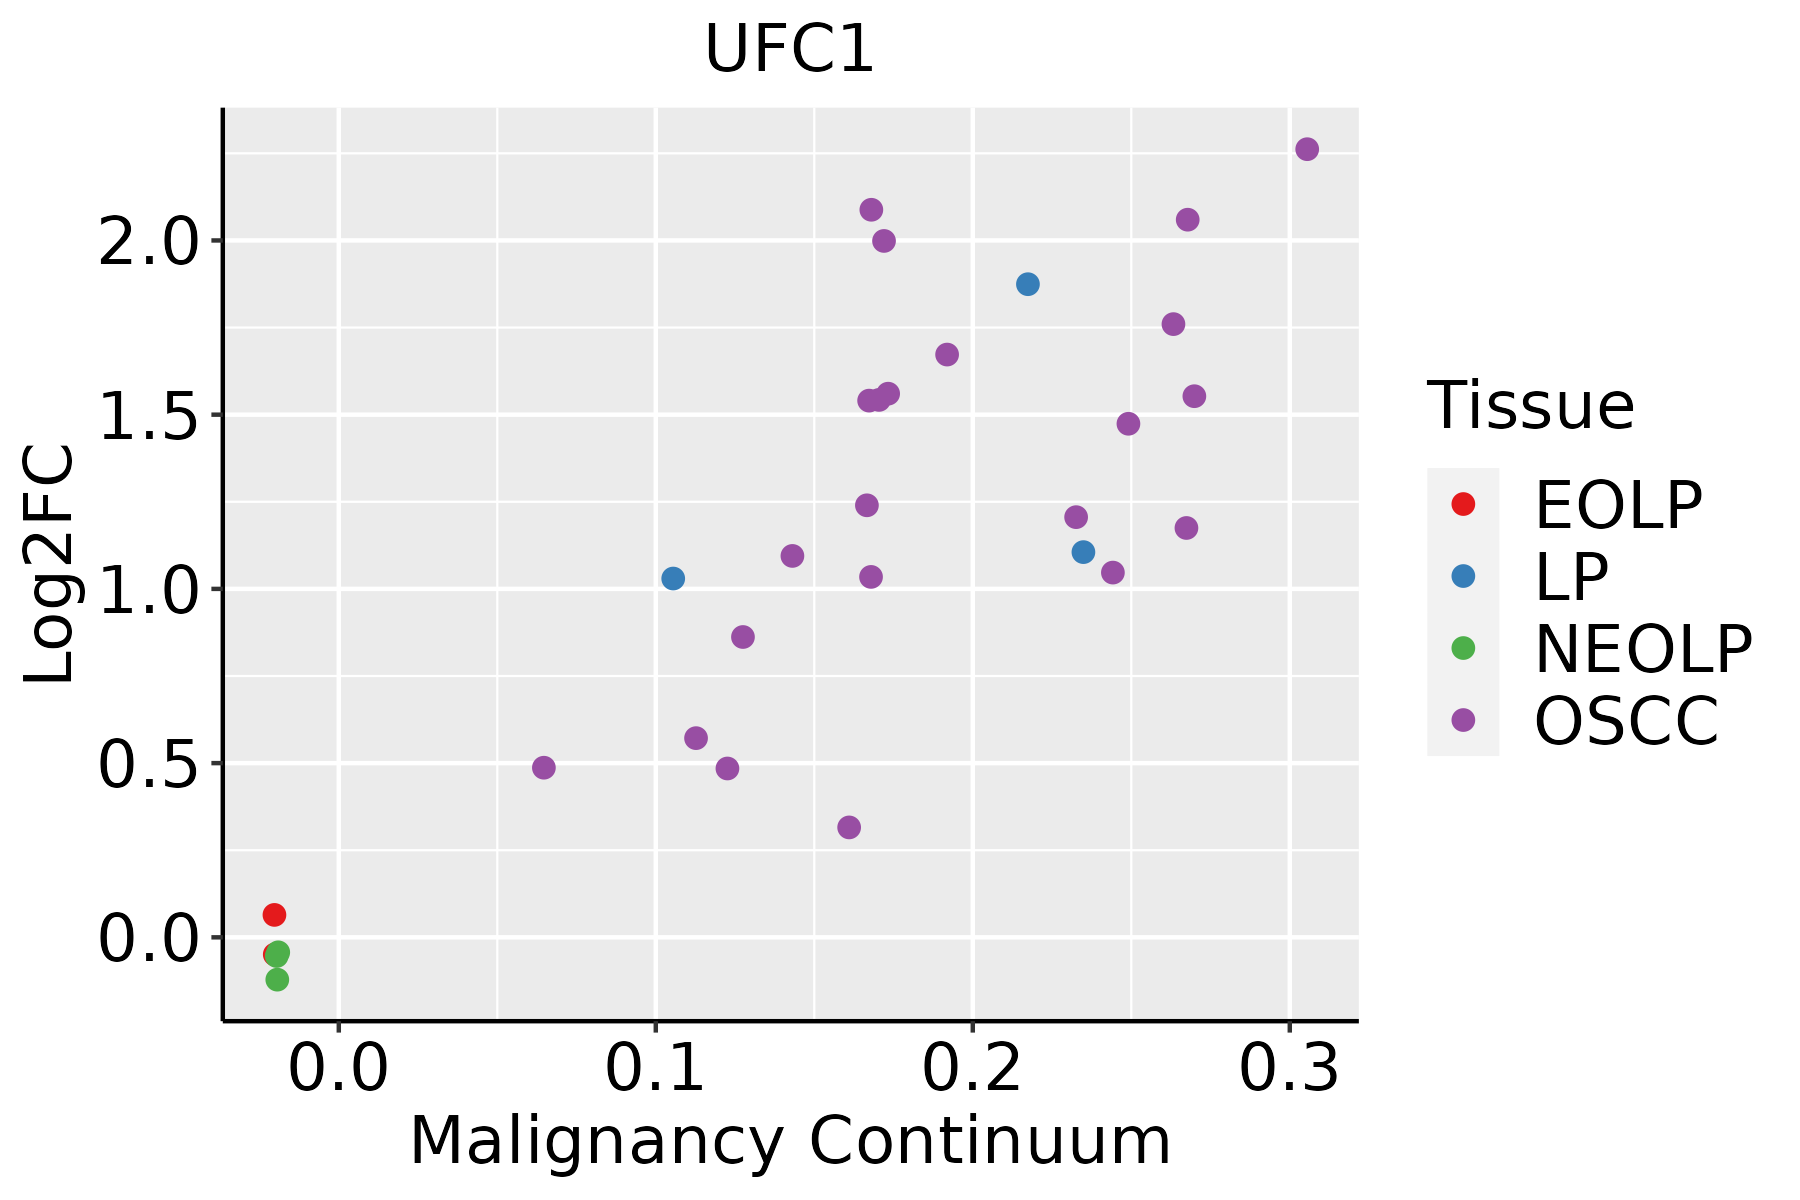 | EOLP: Erosive Oral lichen planus |
| LP: leukoplakia | ||
| NEOLP: Non-erosive oral lichen planus | ||
| OSCC: Oral squamous cell carcinoma | ||
| Prostate | 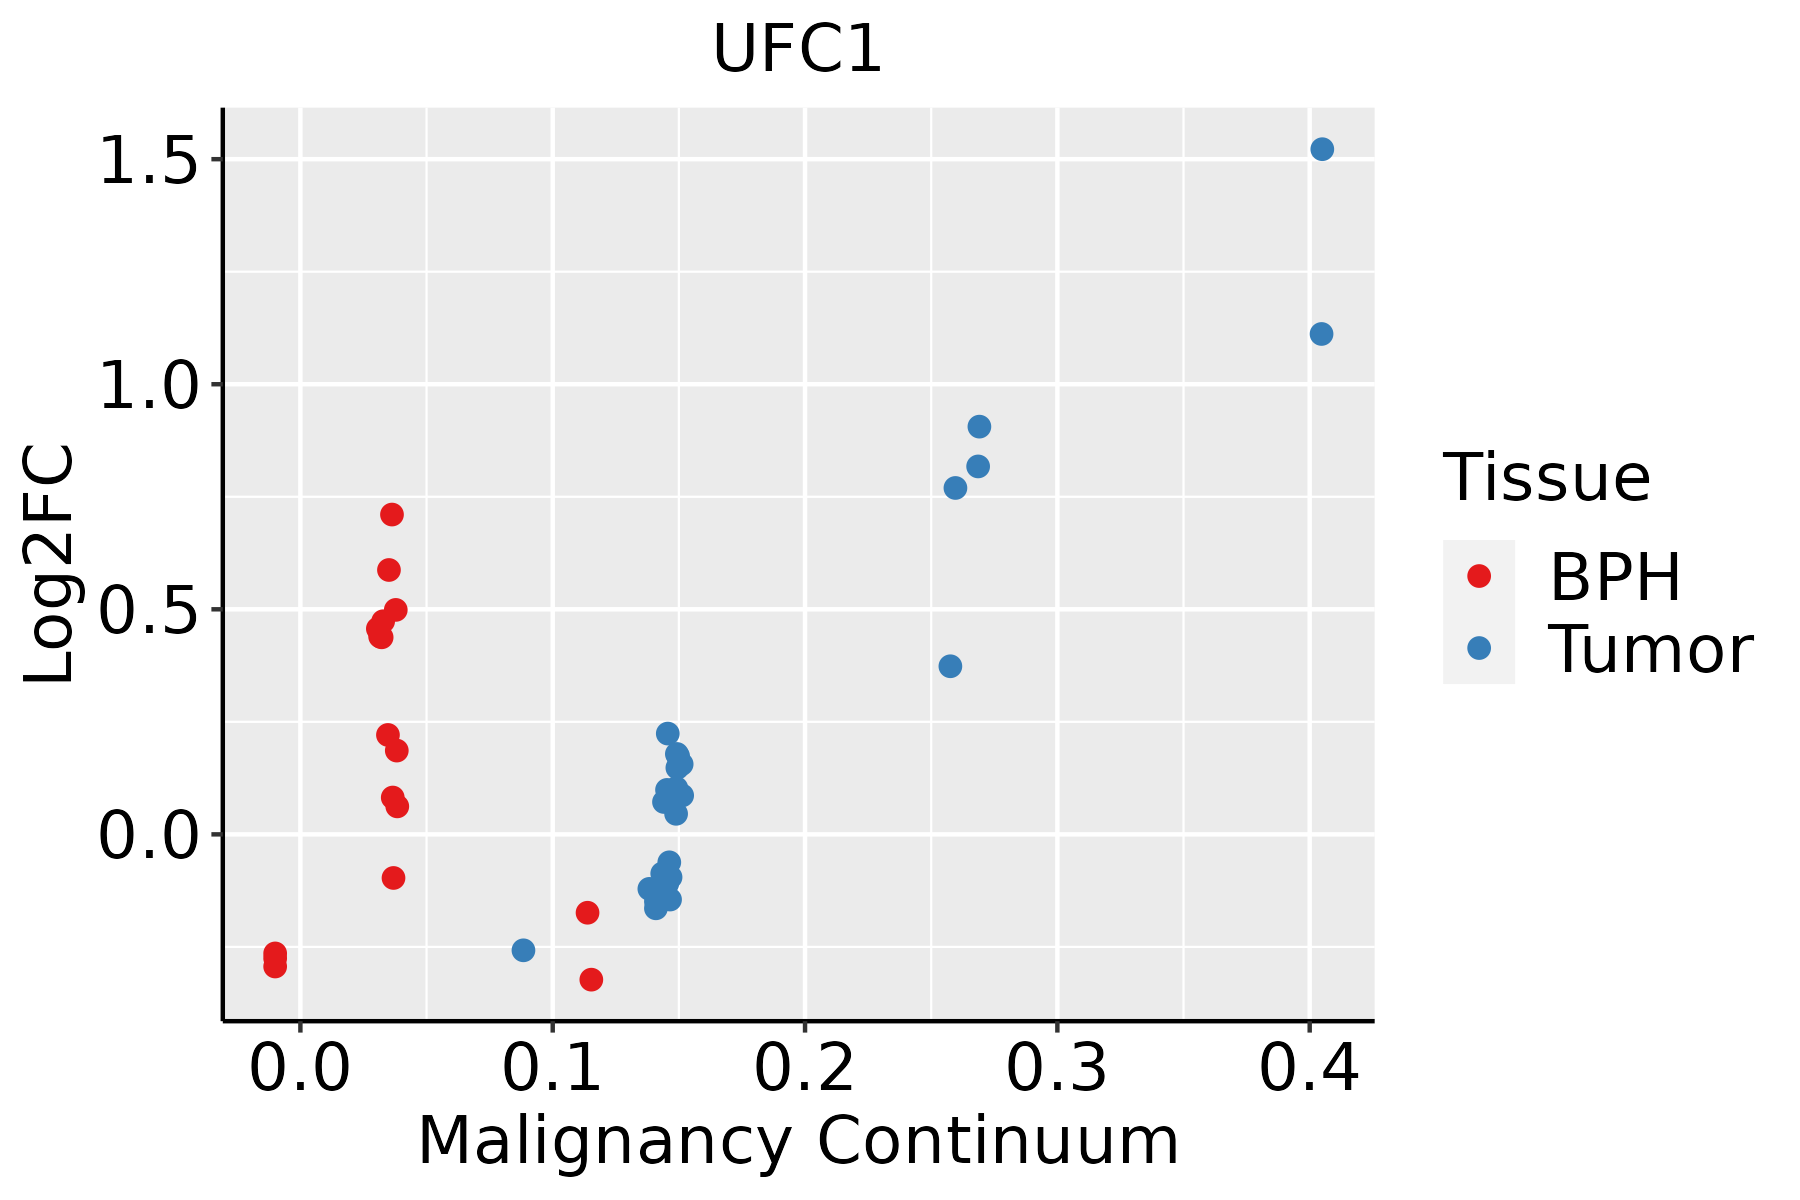 | BPH: Benign Prostatic Hyperplasia |
| Skin |  | AK: Actinic keratosis |
| cSCC: Cutaneous squamous cell carcinoma | ||
| SCCIS:squamous cell carcinoma in situ | ||
| Thyroid | 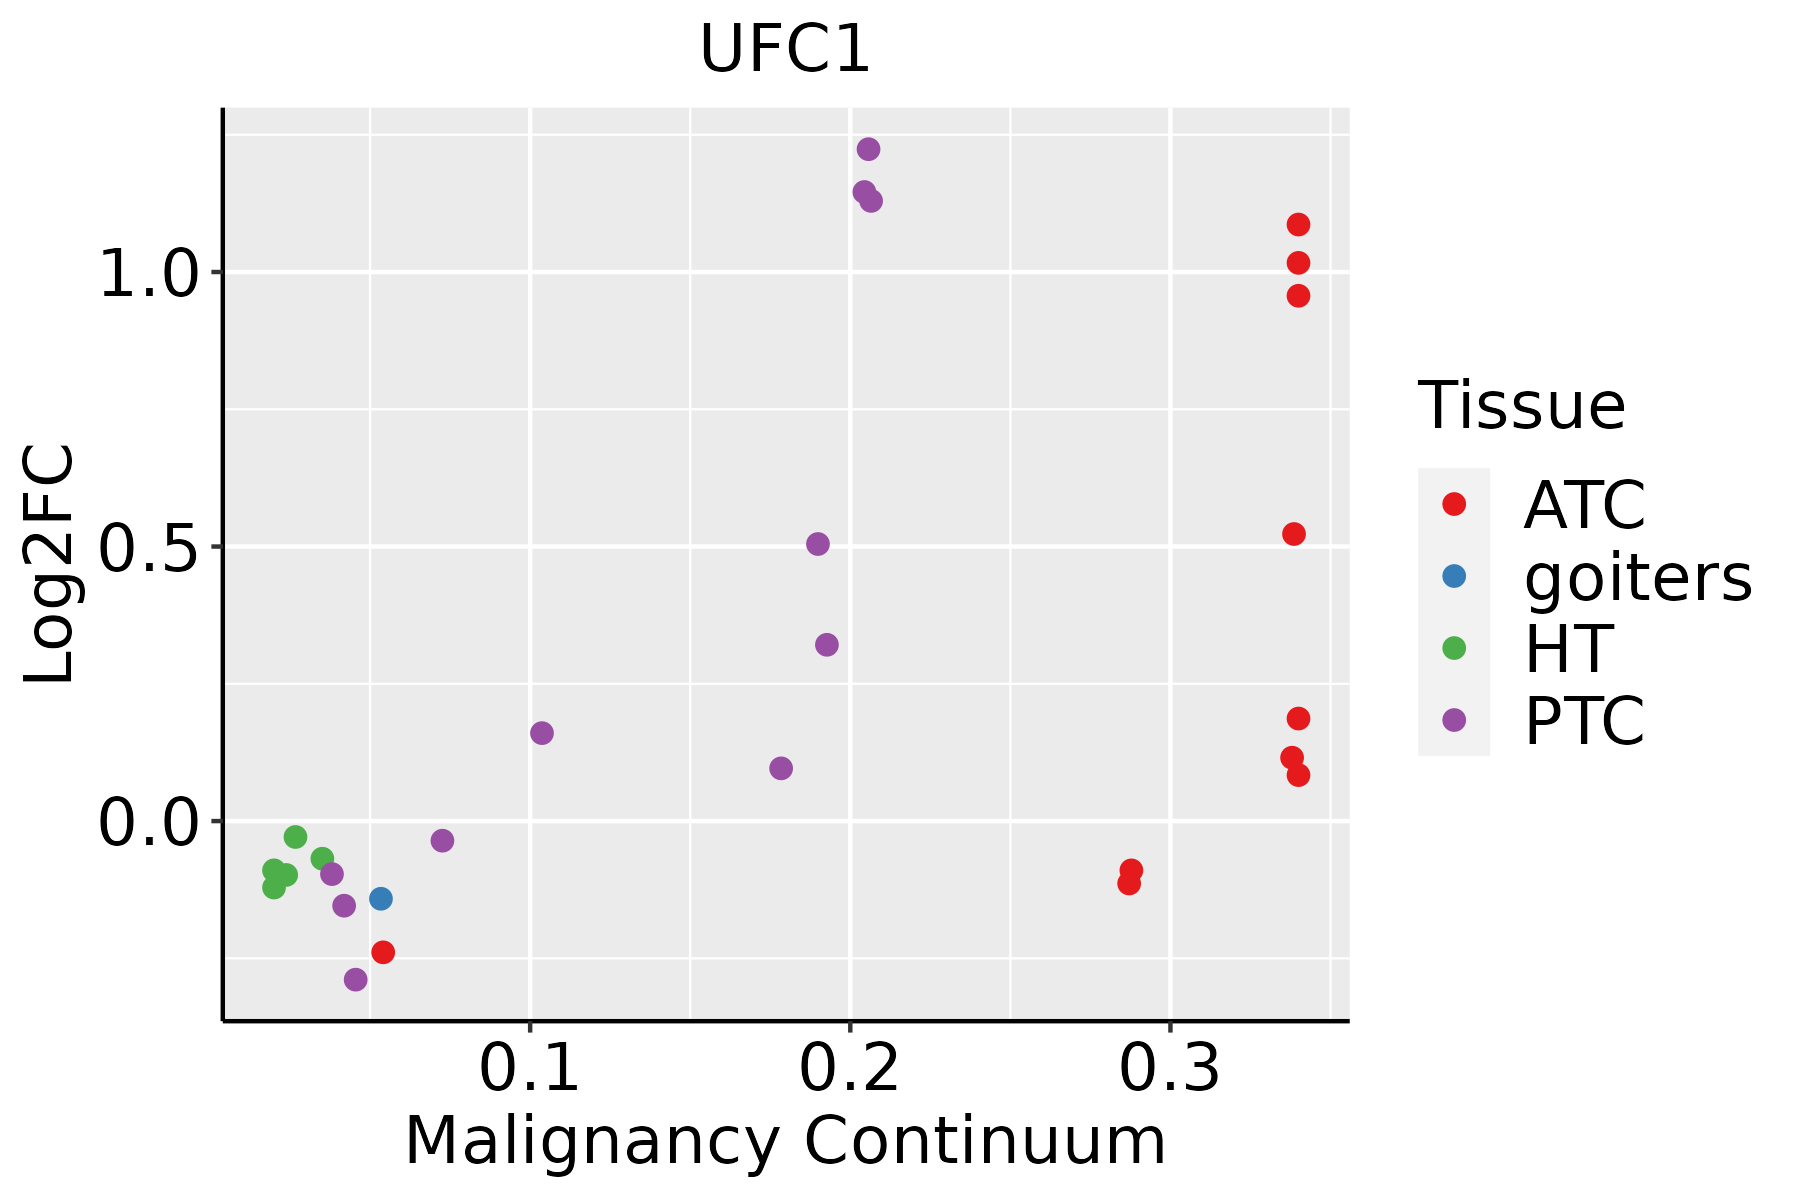 | ATC: Anaplastic thyroid cancer |
| HT: Hashimoto's thyroiditis | ||
| PTC: Papillary thyroid cancer |
| ∗log2FC in expression of this searched gene in stem-like cells from each diseased tissue sample relative to stem-like cells in normal samples in each tissue plotted against the malignancy continuum. Samples are colored based on if they are from different disease stage. |
Top |
Malignant transformation related pathway analysis |
| Find out the enriched GO biological processes and KEGG pathways involved in transition from healthy to precancer to cancer |
| Tissue | Disease Stage | Enriched GO biological Processes |
| Colorectum | AD |  |
| Colorectum | SER |  |
| Colorectum | MSS |  |
| Colorectum | MSI-H |  |
| Colorectum | FAP |  |
| ∗Top 15 enriched GO BP terms are showed in the bar plot of each disease state in each tissue. Each row represents a significant GO biological process which is colored according to the -log10(p.adjust). |
| Page: 1 2 3 4 5 6 7 8 9 |
| GO ID | Tissue | Disease Stage | Description | Gene Ratio | Bg Ratio | pvalue | p.adjust | Count |
| GO:000906015 | Endometrium | EEC | aerobic respiration | 79/2168 | 189/18723 | 2.63e-26 | 3.95e-23 | 79 |
| GO:004533315 | Endometrium | EEC | cellular respiration | 83/2168 | 230/18723 | 1.72e-22 | 2.06e-19 | 83 |
| GO:004277315 | Endometrium | EEC | ATP synthesis coupled electron transport | 49/2168 | 95/18723 | 1.11e-21 | 9.50e-19 | 49 |
| GO:004277515 | Endometrium | EEC | mitochondrial ATP synthesis coupled electron transport | 49/2168 | 95/18723 | 1.11e-21 | 9.50e-19 | 49 |
| GO:001964615 | Endometrium | EEC | aerobic electron transport chain | 45/2168 | 87/18723 | 4.34e-20 | 3.26e-17 | 45 |
| GO:001598015 | Endometrium | EEC | energy derivation by oxidation of organic compounds | 97/2168 | 318/18723 | 5.37e-20 | 3.58e-17 | 97 |
| GO:002290415 | Endometrium | EEC | respiratory electron transport chain | 52/2168 | 114/18723 | 7.97e-20 | 4.78e-17 | 52 |
| GO:000609115 | Endometrium | EEC | generation of precursor metabolites and energy | 125/2168 | 490/18723 | 3.76e-18 | 1.88e-15 | 125 |
| GO:002290015 | Endometrium | EEC | electron transport chain | 61/2168 | 175/18723 | 4.60e-16 | 1.84e-13 | 61 |
| GO:000612015 | Endometrium | EEC | mitochondrial electron transport, NADH to ubiquinone | 26/2168 | 51/18723 | 5.31e-12 | 8.85e-10 | 26 |
| GO:001025715 | Endometrium | EEC | NADH dehydrogenase complex assembly | 25/2168 | 57/18723 | 8.26e-10 | 7.51e-08 | 25 |
| GO:003298115 | Endometrium | EEC | mitochondrial respiratory chain complex I assembly | 25/2168 | 57/18723 | 8.26e-10 | 7.51e-08 | 25 |
| GO:003497617 | Endometrium | EEC | response to endoplasmic reticulum stress | 63/2168 | 256/18723 | 3.84e-09 | 2.71e-07 | 63 |
| GO:003310815 | Endometrium | EEC | mitochondrial respiratory chain complex assembly | 31/2168 | 93/18723 | 2.46e-08 | 1.45e-06 | 31 |
| GO:002241116 | Endometrium | EEC | cellular component disassembly | 82/2168 | 443/18723 | 1.06e-05 | 2.26e-04 | 82 |
| GO:190300813 | Endometrium | EEC | organelle disassembly | 30/2168 | 114/18723 | 1.09e-05 | 2.30e-04 | 30 |
| GO:001623613 | Endometrium | EEC | macroautophagy | 53/2168 | 291/18723 | 5.40e-04 | 5.42e-03 | 53 |
| GO:006191212 | Endometrium | EEC | selective autophagy | 17/2168 | 68/18723 | 1.56e-03 | 1.25e-02 | 17 |
| GO:000611920 | Esophagus | HGIN | oxidative phosphorylation | 69/2587 | 141/18723 | 1.37e-23 | 2.05e-20 | 69 |
| GO:000906020 | Esophagus | HGIN | aerobic respiration | 81/2587 | 189/18723 | 1.07e-22 | 9.26e-20 | 81 |
| Page: 1 2 3 4 5 6 7 8 9 10 11 12 13 14 15 16 17 18 19 20 21 22 23 24 |
| Pathway ID | Tissue | Disease Stage | Description | Gene Ratio | Bg Ratio | pvalue | p.adjust | qvalue | Count |
| Page: 1 |
Top |
Cell-cell communication analysis |
| Identification of potential cell-cell interactions between two cell types and their ligand-receptor pairs for different disease states |
| Ligand | Receptor | LRpair | Pathway | Tissue | Disease Stage |
| Page: 1 |
Top |
Single-cell gene regulatory network inference analysis |
| Find out the significant the regulons (TFs) and the target genes of each regulon across cell types for different disease states |
| TF | Cell Type | Tissue | Disease Stage | Target Gene | RSS | Regulon Activity |
| ∗The dot plots of a searched regulon are shown for all cell subpopulations in each disease state of each tissue based on the regulon specific score inferred using pySCENIC and by calculating the average expression. |
| Page: 1 |
Top |
Somatic mutation of malignant transformation related genes |
| Annotation of somatic variants for genes involved in malignant transformation |
| Hugo Symbol | Variant Class | Variant Classification | dbSNP RS | HGVSc | HGVSp | HGVSp Short | SWISSPROT | BIOTYPE | SIFT | PolyPhen | Tumor Sample Barcode | Tissue | Histology | Sex | Age | Stage | Therapy Types | Drugs | Outcome |
| UFC1 | SNV | Missense_Mutation | c.335G>C | p.Gly112Ala | p.G112A | Q9Y3C8 | protein_coding | deleterious(0) | benign(0.293) | TCGA-BH-A0E1-01 | Breast | breast invasive carcinoma | Female | <65 | I/II | Chemotherapy | cytoxan | SD | |
| UFC1 | SNV | Missense_Mutation | c.427N>A | p.Gly143Ser | p.G143S | Q9Y3C8 | protein_coding | deleterious(0.02) | possibly_damaging(0.898) | TCGA-C5-A1MF-01 | Cervix | cervical & endocervical cancer | Female | <65 | I/II | Unknown | Unknown | SD | |
| UFC1 | SNV | Missense_Mutation | c.193N>C | p.Trp65Arg | p.W65R | Q9Y3C8 | protein_coding | deleterious(0) | probably_damaging(0.993) | TCGA-A6-6780-01 | Colorectum | colon adenocarcinoma | Male | >=65 | I/II | Unknown | Unknown | SD | |
| UFC1 | SNV | Missense_Mutation | c.292N>A | p.Ala98Thr | p.A98T | Q9Y3C8 | protein_coding | tolerated(0.16) | benign(0.43) | TCGA-AD-6889-01 | Colorectum | colon adenocarcinoma | Male | >=65 | I/II | Chemotherapy | xeloda | PD | |
| UFC1 | SNV | Missense_Mutation | c.283N>T | p.Pro95Ser | p.P95S | Q9Y3C8 | protein_coding | deleterious(0) | probably_damaging(0.997) | TCGA-AD-A5EK-01 | Colorectum | colon adenocarcinoma | Male | <65 | I/II | Unknown | Unknown | SD | |
| UFC1 | SNV | Missense_Mutation | novel | c.358N>A | p.His120Asn | p.H120N | Q9Y3C8 | protein_coding | deleterious(0) | possibly_damaging(0.782) | TCGA-AJ-A5DW-01 | Endometrium | uterine corpus endometrioid carcinoma | Female | <65 | I/II | Unknown | Unknown | SD |
| UFC1 | SNV | Missense_Mutation | rs139173256 | c.247G>A | p.Glu83Lys | p.E83K | Q9Y3C8 | protein_coding | tolerated(0.11) | possibly_damaging(0.822) | TCGA-AP-A1E0-01 | Endometrium | uterine corpus endometrioid carcinoma | Female | <65 | III/IV | Chemotherapy | paclitaxel | SD |
| UFC1 | SNV | Missense_Mutation | novel | c.146C>T | p.Ala49Val | p.A49V | Q9Y3C8 | protein_coding | tolerated(0.16) | benign(0.114) | TCGA-AX-A2HA-01 | Endometrium | uterine corpus endometrioid carcinoma | Female | <65 | I/II | Unknown | Unknown | SD |
| UFC1 | SNV | Missense_Mutation | novel | c.29N>G | p.Val10Gly | p.V10G | Q9Y3C8 | protein_coding | deleterious(0) | possibly_damaging(0.628) | TCGA-AX-A2HJ-01 | Endometrium | uterine corpus endometrioid carcinoma | Female | <65 | I/II | Unknown | Unknown | SD |
| UFC1 | SNV | Missense_Mutation | c.454G>C | p.Asp152His | p.D152H | Q9Y3C8 | protein_coding | tolerated(0.55) | benign(0.136) | TCGA-B5-A0JN-01 | Endometrium | uterine corpus endometrioid carcinoma | Female | >=65 | III/IV | Chemotherapy | paclitaxel | SD |
| Page: 1 2 |
Top |
Related drugs of malignant transformation related genes |
| Identification of chemicals and drugs interact with genes involved in malignant transfromation |
| (DGIdb 4.0) |
| Entrez ID | Symbol | Category | Interaction Types | Drug Claim Name | Drug Name | PMIDs |
| Page: 1 |

Copyright 2023-Present -The University of Texas Health Science Center at Houston |