
|
|||||
|
 | |
| |
| |
| |
| |
| |
|
Gene: TNIP1 |
Gene summary for TNIP1 |
| Gene information | Species | Human | Gene symbol | TNIP1 | Gene ID | 10318 |
| Gene name | TNFAIP3 interacting protein 1 | |
| Gene Alias | ABIN-1 | |
| Cytomap | 5q33.1 | |
| Gene Type | protein-coding | GO ID | GO:0000165 | UniProtAcc | A0A0A0MRZ4 |
Top |
Malignant transformation analysis |
| Identification of the aberrant gene expression in precancerous and cancerous lesions by comparing the gene expression of stem-like cells in diseased tissues with normal stem cells |
| Entrez ID | Symbol | Replicates | Species | Organ | Tissue | Adj P-value | Log2FC | Malignancy |
| 10318 | TNIP1 | AEH-subject1 | Human | Endometrium | AEH | 2.79e-12 | 4.60e-01 | -0.3059 |
| 10318 | TNIP1 | AEH-subject2 | Human | Endometrium | AEH | 3.07e-02 | 1.88e-01 | -0.2525 |
| 10318 | TNIP1 | AEH-subject3 | Human | Endometrium | AEH | 1.77e-07 | 3.50e-01 | -0.2576 |
| 10318 | TNIP1 | AEH-subject4 | Human | Endometrium | AEH | 1.96e-03 | 3.08e-01 | -0.2657 |
| 10318 | TNIP1 | EEC-subject1 | Human | Endometrium | EEC | 2.04e-04 | 2.36e-01 | -0.2682 |
| 10318 | TNIP1 | EEC-subject2 | Human | Endometrium | EEC | 4.91e-05 | 2.86e-01 | -0.2607 |
| 10318 | TNIP1 | EEC-subject3 | Human | Endometrium | EEC | 9.34e-10 | 2.35e-01 | -0.2525 |
| 10318 | TNIP1 | EEC-subject4 | Human | Endometrium | EEC | 5.89e-05 | 1.88e-01 | -0.2571 |
| 10318 | TNIP1 | GSM5276934 | Human | Endometrium | EEC | 3.88e-17 | 5.25e-01 | -0.0913 |
| 10318 | TNIP1 | GSM5276937 | Human | Endometrium | EEC | 2.49e-10 | 4.23e-01 | -0.0897 |
| 10318 | TNIP1 | GSM6177620_NYU_UCEC1_lib1_lib1 | Human | Endometrium | EEC | 1.98e-08 | 8.45e-02 | -0.1869 |
| 10318 | TNIP1 | GSM6177620_NYU_UCEC1_lib2_lib2 | Human | Endometrium | EEC | 1.86e-06 | 7.24e-02 | -0.1875 |
| 10318 | TNIP1 | GSM6177620_NYU_UCEC1_lib3_lib3 | Human | Endometrium | EEC | 3.20e-09 | 1.41e-01 | -0.1883 |
| 10318 | TNIP1 | GSM6177621_NYU_UCEC2_lib1_lib1 | Human | Endometrium | EEC | 1.56e-12 | -4.24e-03 | -0.1934 |
| 10318 | TNIP1 | GSM6177622_NYU_UCEC3_lib1_lib1 | Human | Endometrium | EEC | 1.66e-14 | -3.95e-02 | -0.1917 |
| 10318 | TNIP1 | GSM6177622_NYU_UCEC3_lib2_lib2 | Human | Endometrium | EEC | 1.41e-10 | -1.04e-01 | -0.1916 |
| 10318 | TNIP1 | LZE4T | Human | Esophagus | ESCC | 1.92e-18 | 4.01e-01 | 0.0811 |
| 10318 | TNIP1 | LZE5T | Human | Esophagus | ESCC | 7.45e-09 | 3.11e-01 | 0.0514 |
| 10318 | TNIP1 | LZE7T | Human | Esophagus | ESCC | 1.37e-12 | 4.49e-01 | 0.0667 |
| 10318 | TNIP1 | LZE8T | Human | Esophagus | ESCC | 1.03e-12 | 4.73e-01 | 0.067 |
| Page: 1 2 3 4 5 6 7 8 |
| Tissue | Expression Dynamics | Abbreviation |
| Endometrium | 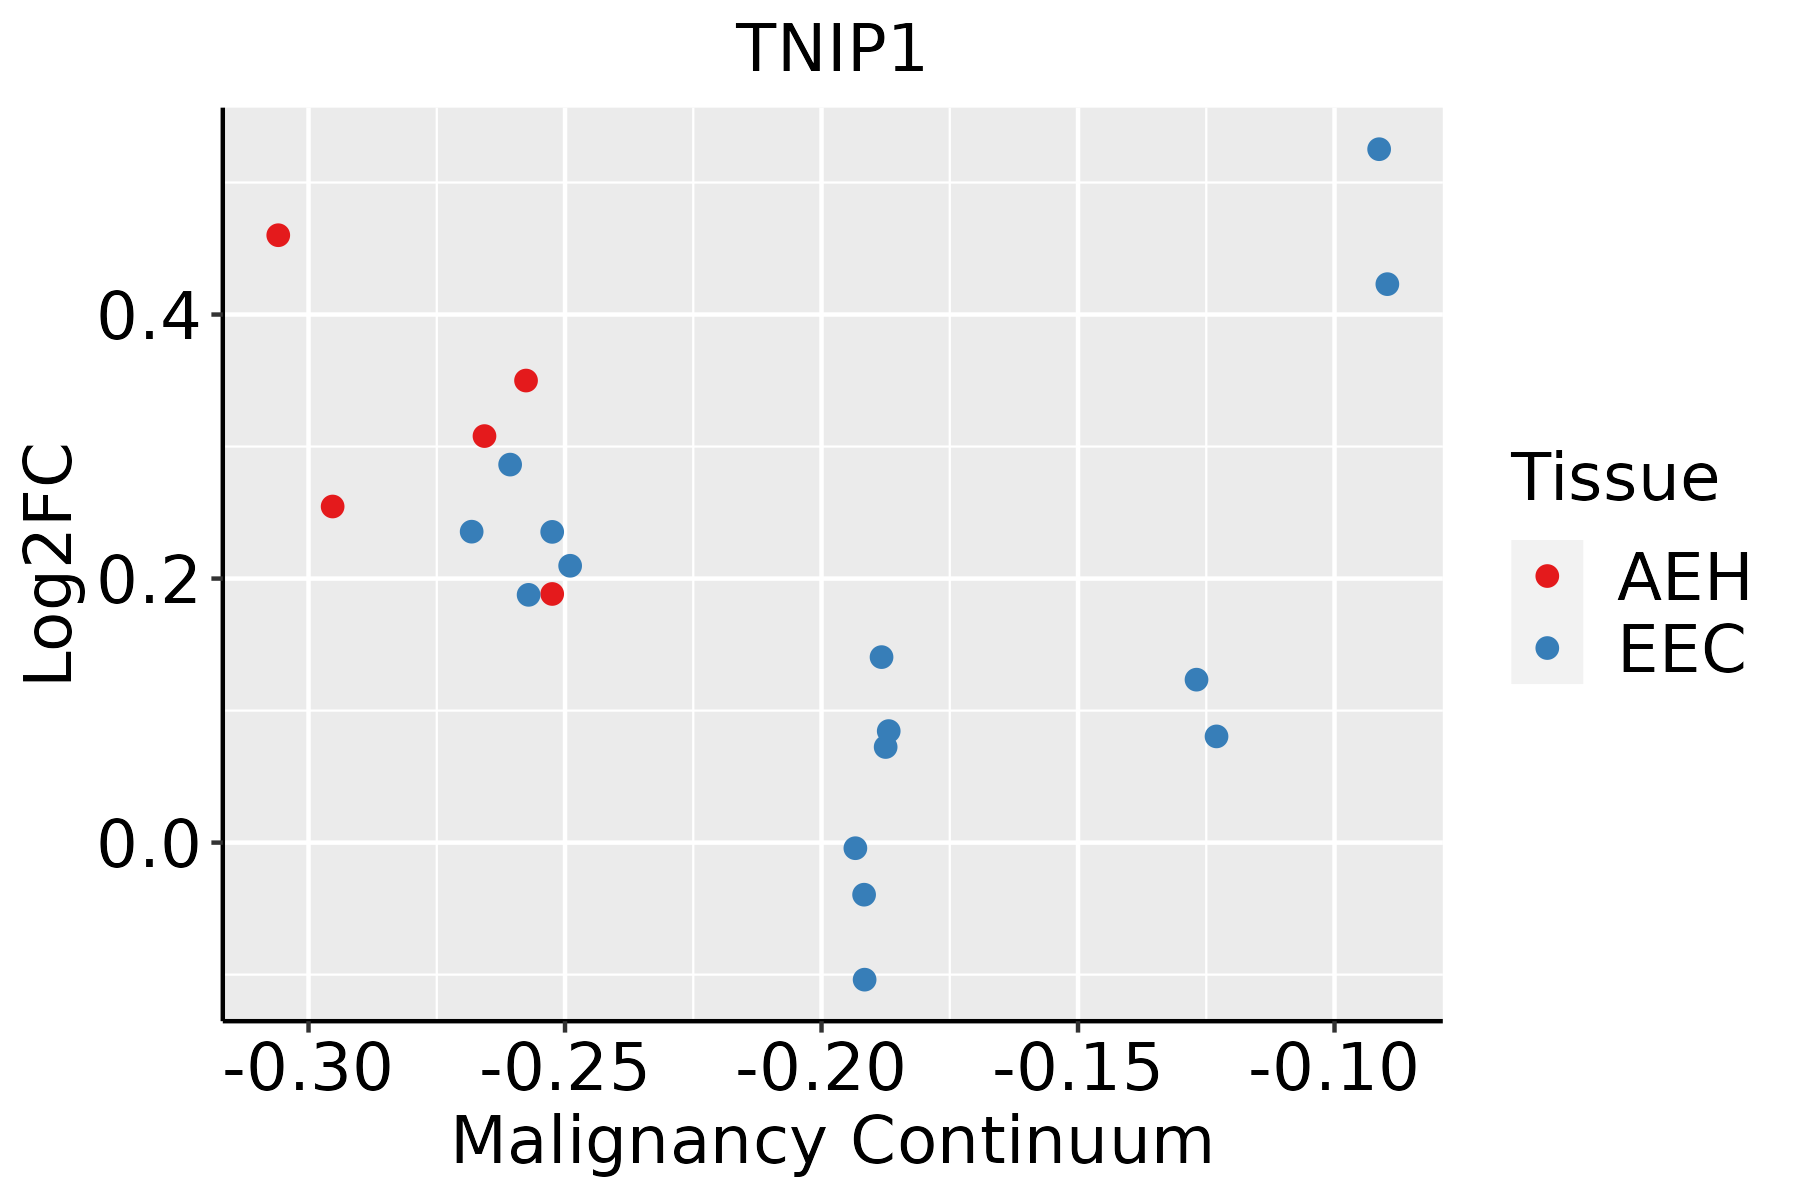 | AEH: Atypical endometrial hyperplasia |
| EEC: Endometrioid Cancer | ||
| Esophagus | 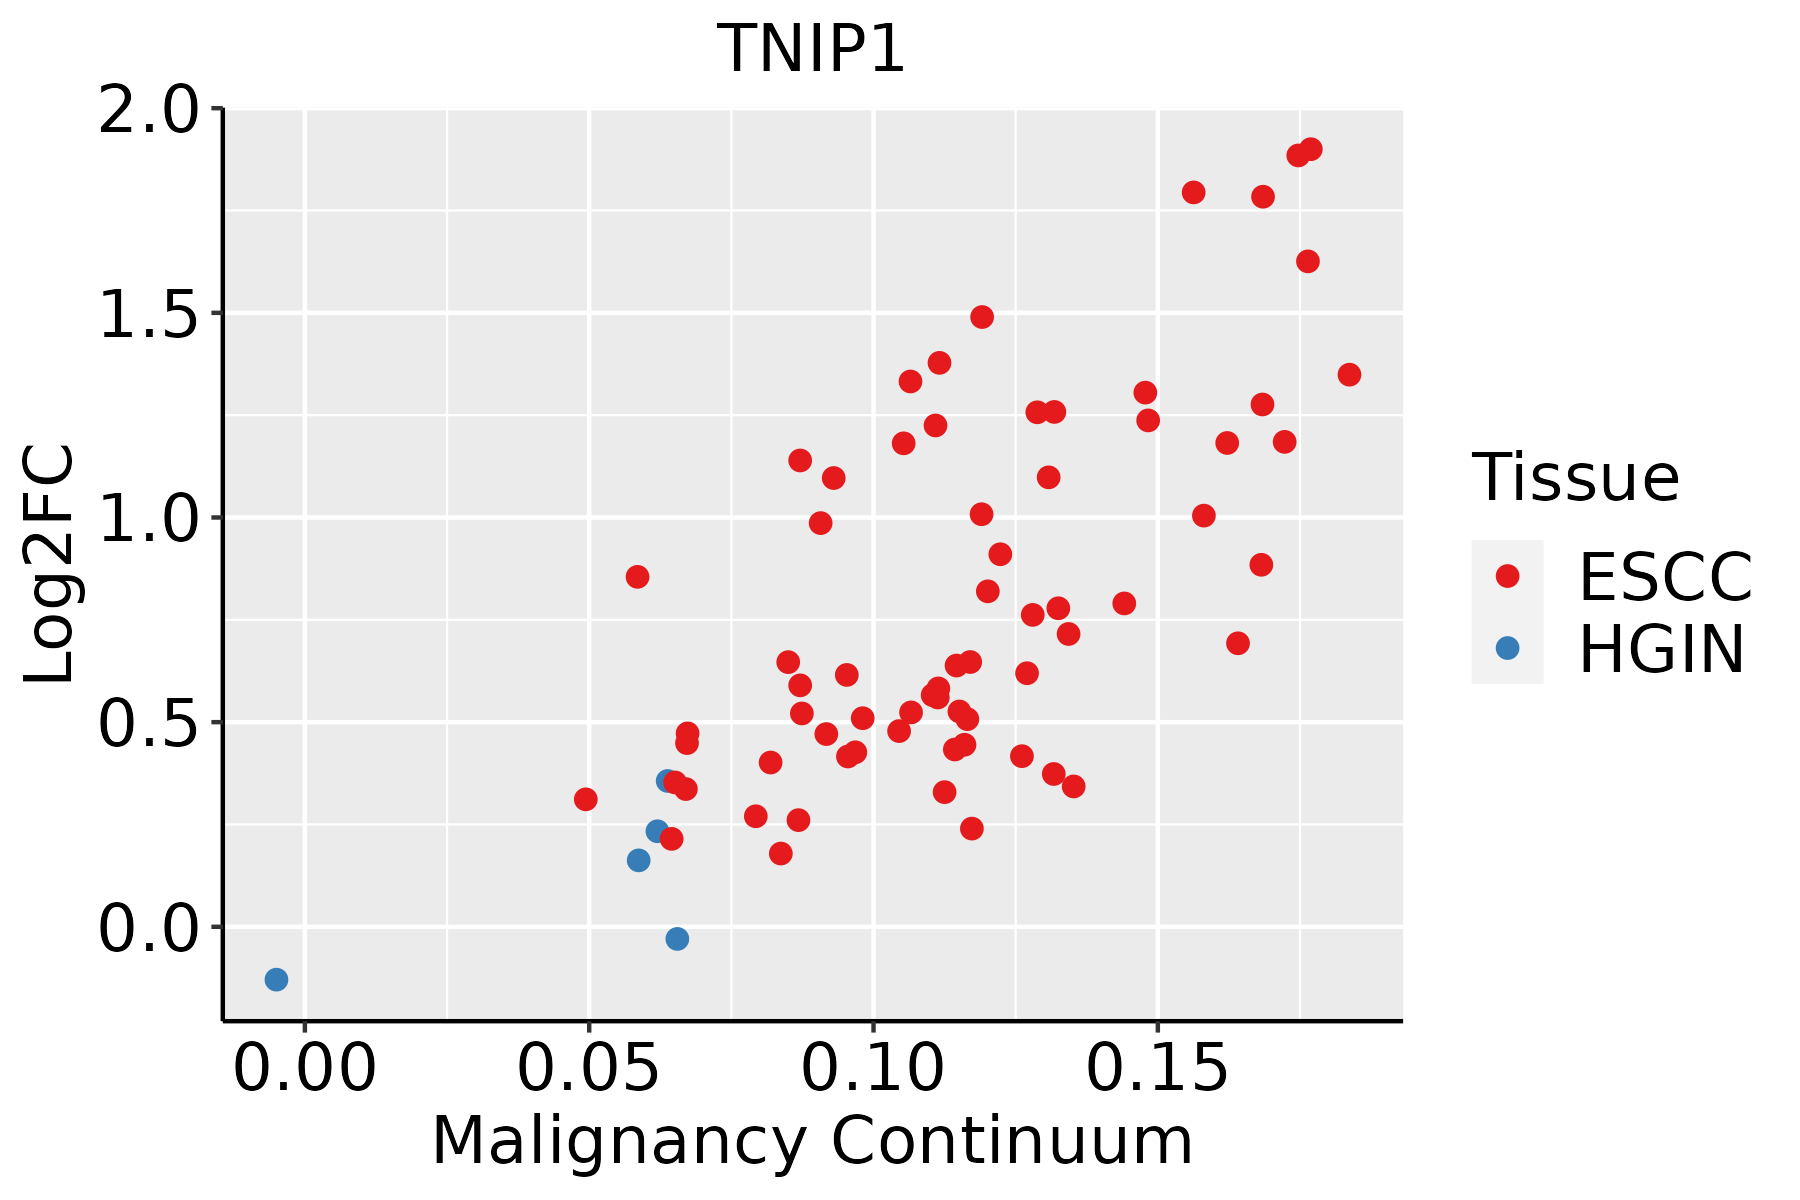 | ESCC: Esophageal squamous cell carcinoma |
| HGIN: High-grade intraepithelial neoplasias | ||
| LGIN: Low-grade intraepithelial neoplasias | ||
| Liver | 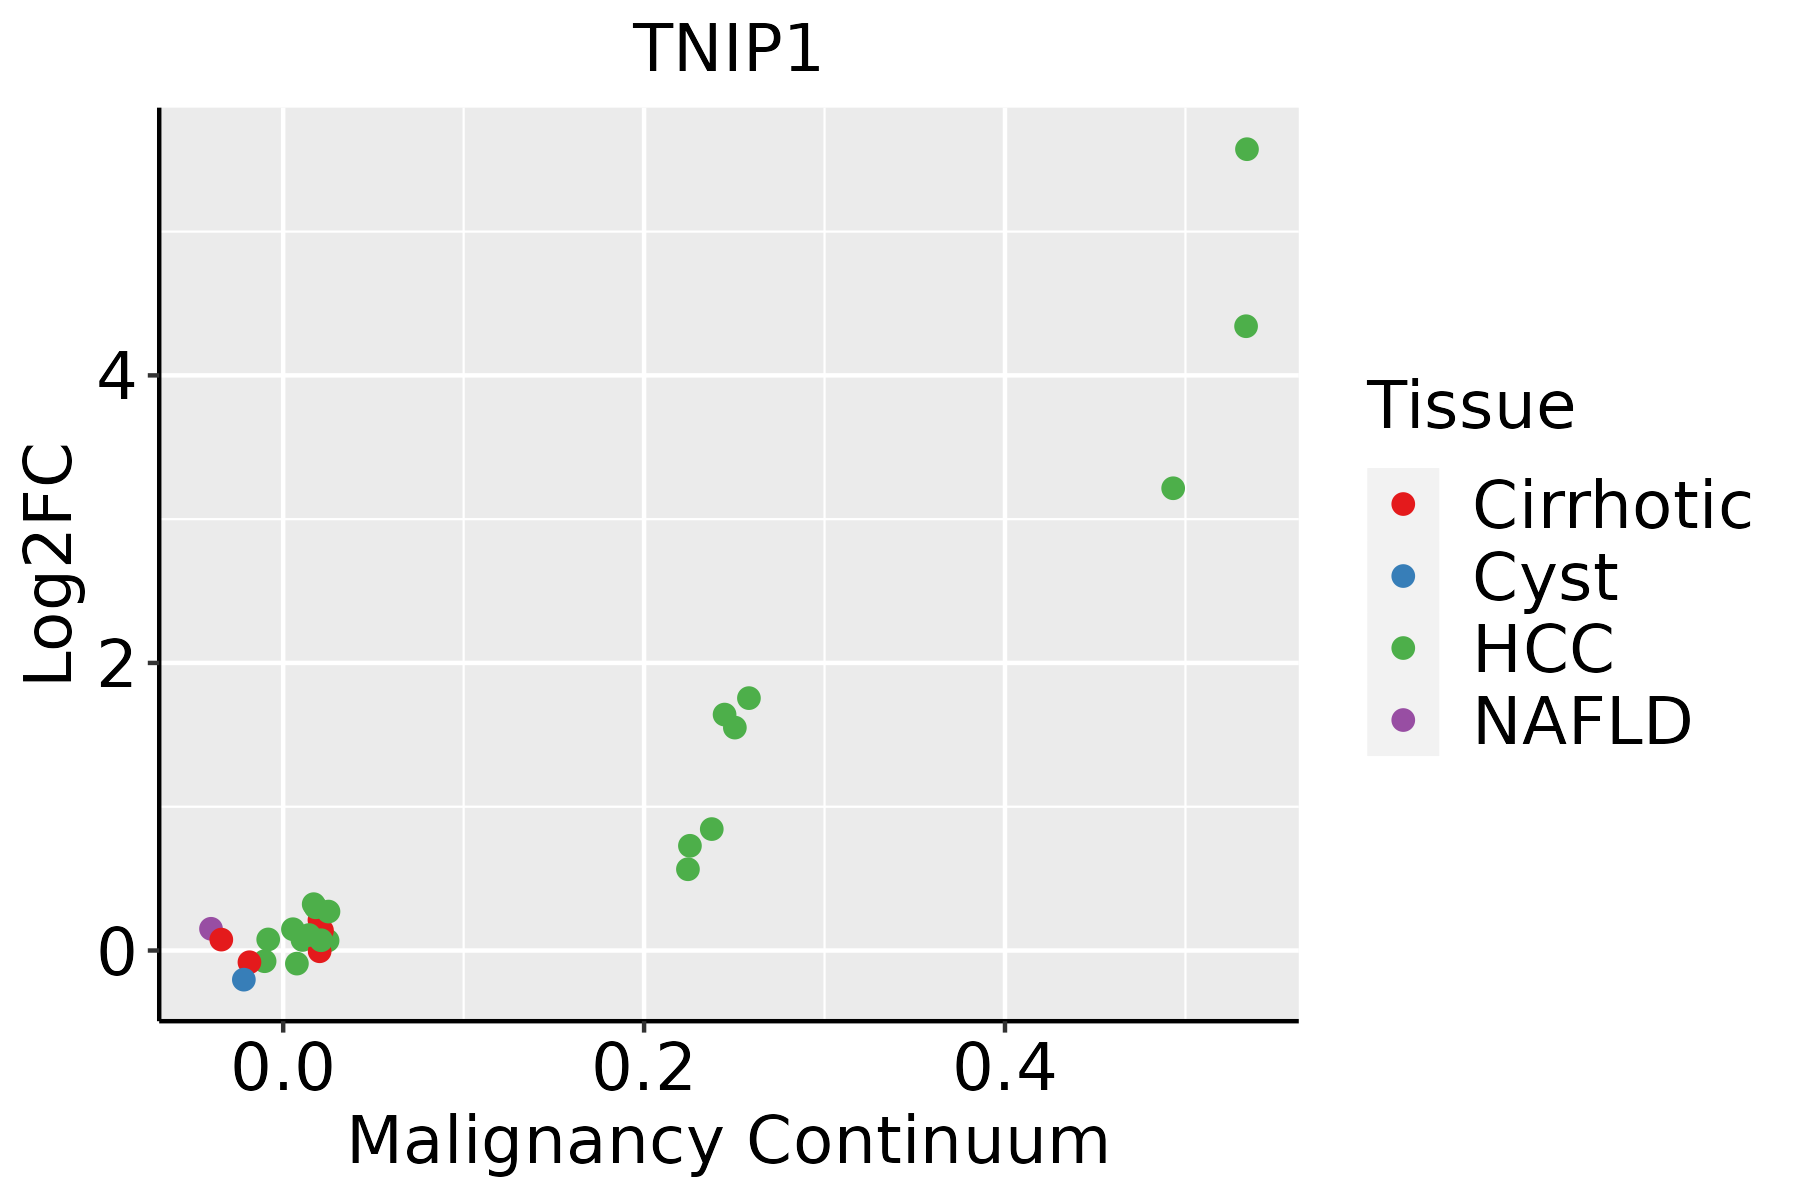 | HCC: Hepatocellular carcinoma |
| NAFLD: Non-alcoholic fatty liver disease | ||
| Oral Cavity | 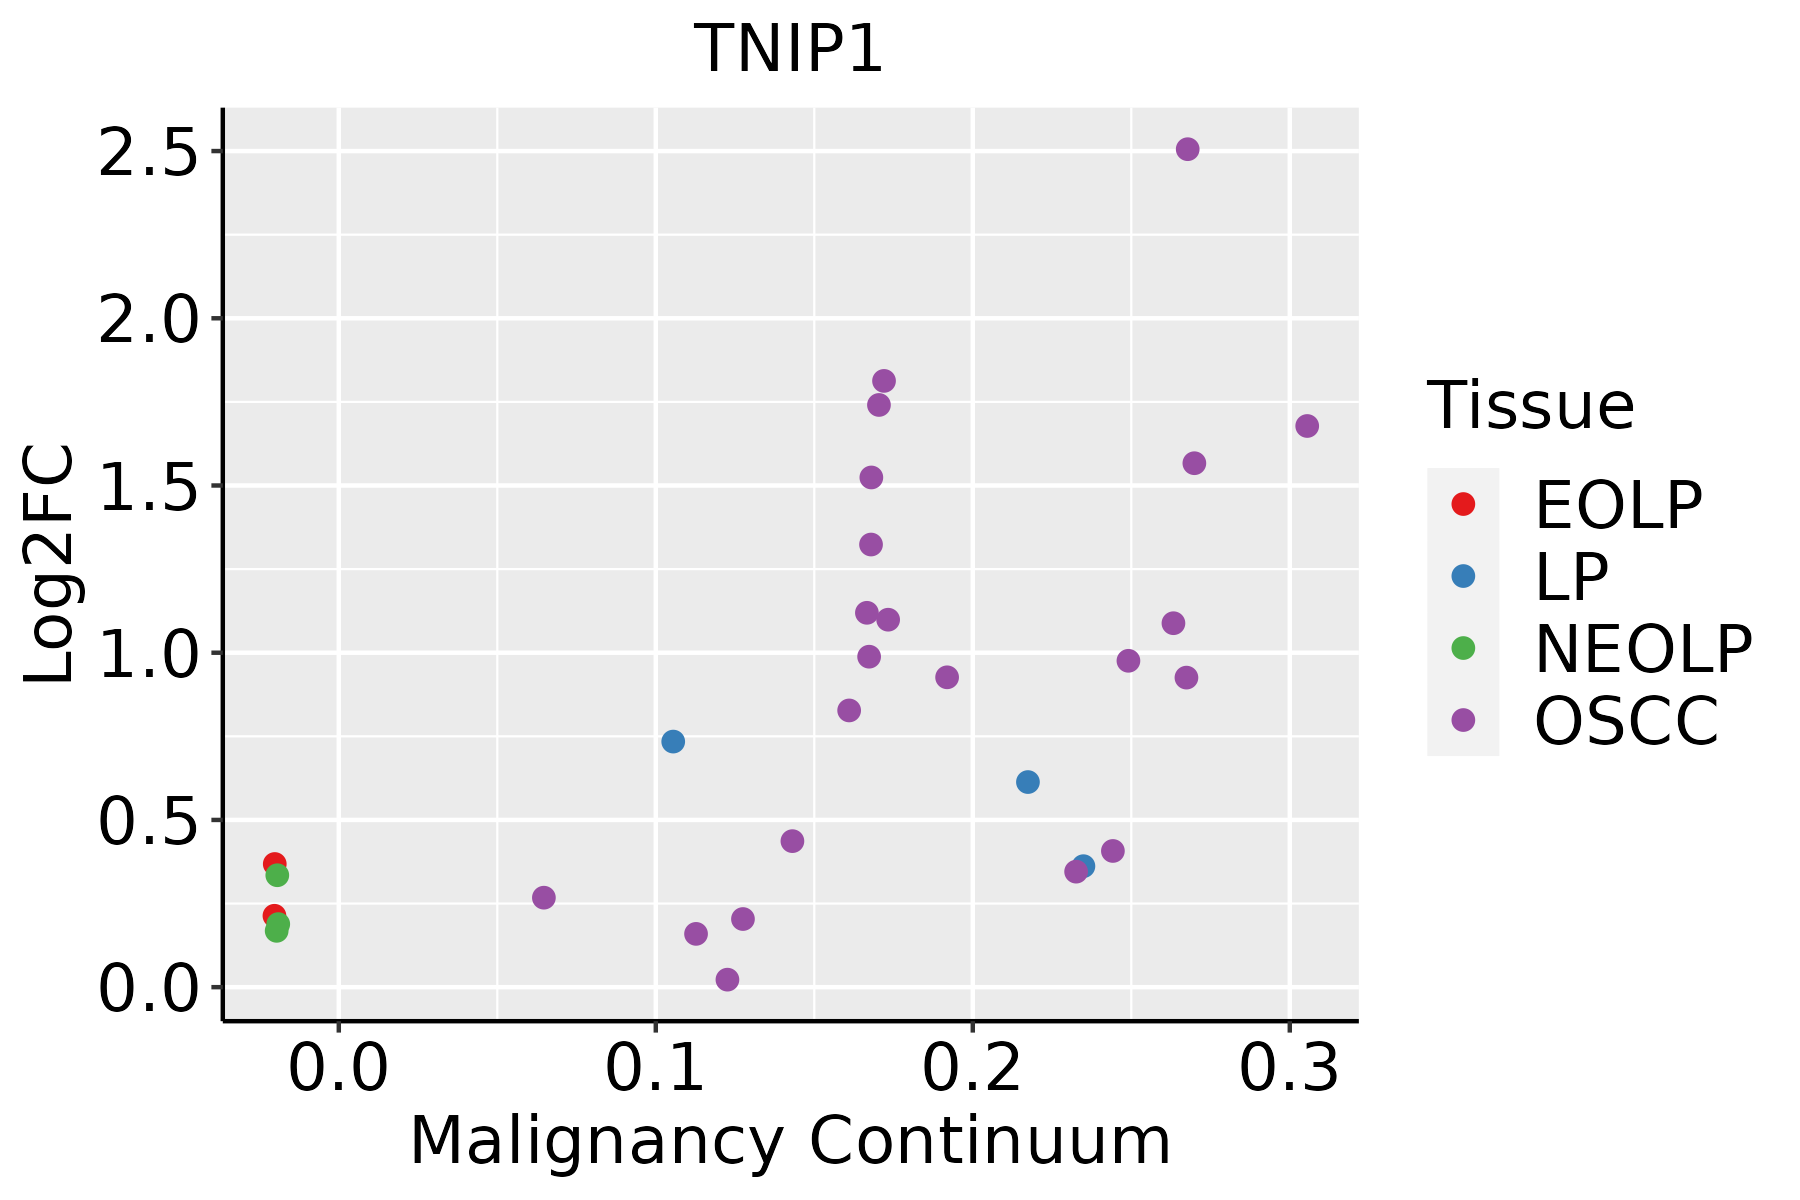 | EOLP: Erosive Oral lichen planus |
| LP: leukoplakia | ||
| NEOLP: Non-erosive oral lichen planus | ||
| OSCC: Oral squamous cell carcinoma | ||
| Skin |  | AK: Actinic keratosis |
| cSCC: Cutaneous squamous cell carcinoma | ||
| SCCIS:squamous cell carcinoma in situ | ||
| Thyroid | 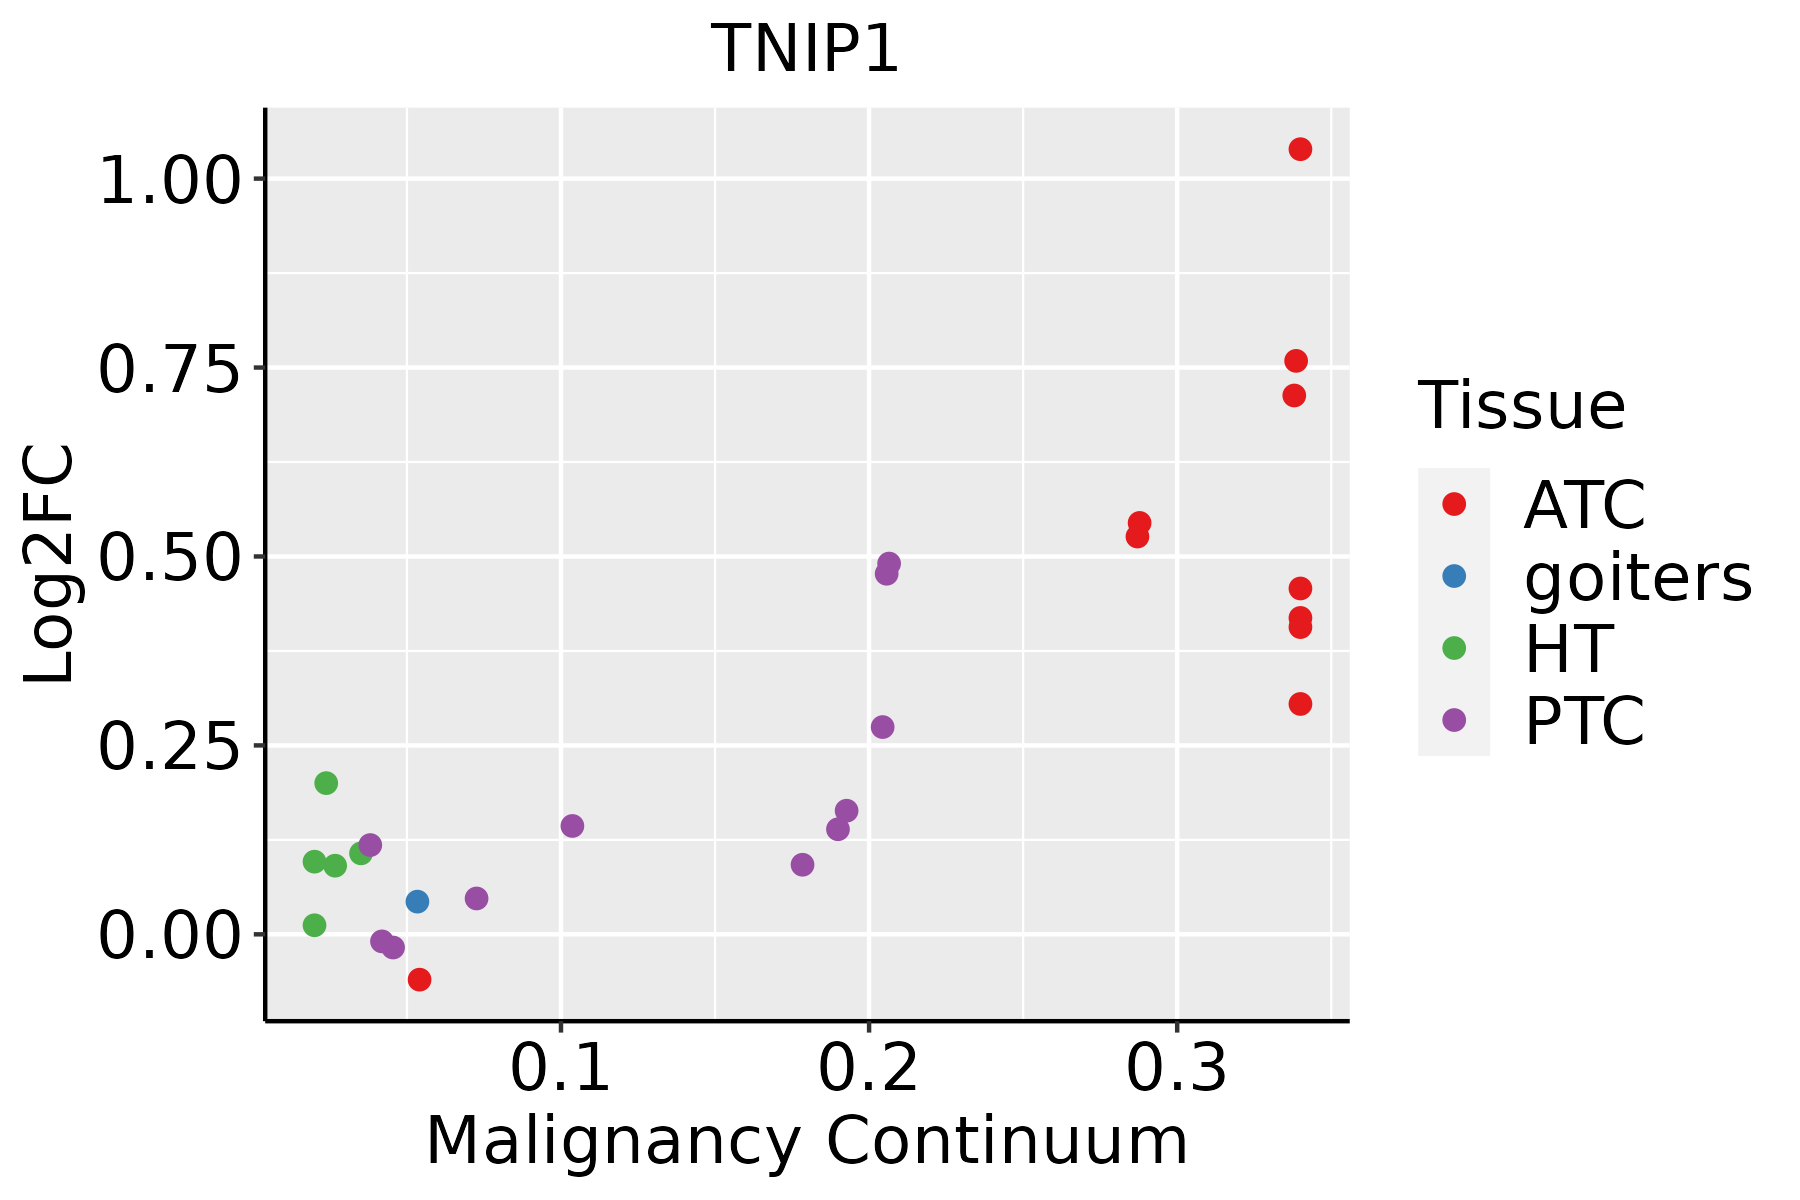 | ATC: Anaplastic thyroid cancer |
| HT: Hashimoto's thyroiditis | ||
| PTC: Papillary thyroid cancer |
| ∗log2FC in expression of this searched gene in stem-like cells from each diseased tissue sample relative to stem-like cells in normal samples in each tissue plotted against the malignancy continuum. Samples are colored based on if they are from different disease stage. |
Top |
Malignant transformation related pathway analysis |
| Find out the enriched GO biological processes and KEGG pathways involved in transition from healthy to precancer to cancer |
| Tissue | Disease Stage | Enriched GO biological Processes |
| Colorectum | AD |  |
| Colorectum | SER |  |
| Colorectum | MSS |  |
| Colorectum | MSI-H |  |
| Colorectum | FAP |  |
| ∗Top 15 enriched GO BP terms are showed in the bar plot of each disease state in each tissue. Each row represents a significant GO biological process which is colored according to the -log10(p.adjust). |
| Page: 1 2 3 4 5 6 7 8 9 |
| GO ID | Tissue | Disease Stage | Description | Gene Ratio | Bg Ratio | pvalue | p.adjust | Count |
| GO:001907920 | Oral cavity | OSCC | viral genome replication | 95/7305 | 131/18723 | 6.35e-15 | 4.02e-13 | 95 |
| GO:004312218 | Oral cavity | OSCC | regulation of I-kappaB kinase/NF-kappaB signaling | 155/7305 | 249/18723 | 7.79e-14 | 4.14e-12 | 155 |
| GO:000724910 | Oral cavity | OSCC | I-kappaB kinase/NF-kappaB signaling | 169/7305 | 281/18723 | 4.69e-13 | 2.25e-11 | 169 |
| GO:004440320 | Oral cavity | OSCC | biological process involved in symbiotic interaction | 173/7305 | 290/18723 | 6.80e-13 | 3.19e-11 | 173 |
| GO:005079220 | Oral cavity | OSCC | regulation of viral process | 109/7305 | 164/18723 | 8.95e-13 | 4.10e-11 | 109 |
| GO:190390020 | Oral cavity | OSCC | regulation of viral life cycle | 97/7305 | 148/18723 | 5.34e-11 | 1.67e-09 | 97 |
| GO:005170120 | Oral cavity | OSCC | biological process involved in interaction with host | 125/7305 | 203/18723 | 5.60e-11 | 1.74e-09 | 125 |
| GO:004506917 | Oral cavity | OSCC | regulation of viral genome replication | 62/7305 | 85/18723 | 2.14e-10 | 6.04e-09 | 62 |
| GO:19033227 | Oral cavity | OSCC | positive regulation of protein modification by small protein conjugation or removal | 88/7305 | 138/18723 | 3.24e-09 | 7.39e-08 | 88 |
| GO:004340917 | Oral cavity | OSCC | negative regulation of MAPK cascade | 105/7305 | 180/18723 | 1.10e-07 | 1.87e-06 | 105 |
| GO:00518176 | Oral cavity | OSCC | modulation of process of other organism involved in symbiotic interaction | 54/7305 | 81/18723 | 4.22e-07 | 6.25e-06 | 54 |
| GO:003249617 | Oral cavity | OSCC | response to lipopolysaccharide | 178/7305 | 343/18723 | 7.27e-07 | 1.03e-05 | 178 |
| GO:00358218 | Oral cavity | OSCC | modulation of process of other organism | 64/7305 | 106/18723 | 6.70e-06 | 7.36e-05 | 64 |
| GO:00022214 | Oral cavity | OSCC | pattern recognition receptor signaling pathway | 95/7305 | 172/18723 | 1.11e-05 | 1.15e-04 | 95 |
| GO:00450717 | Oral cavity | OSCC | negative regulation of viral genome replication | 38/7305 | 56/18723 | 1.15e-05 | 1.18e-04 | 38 |
| GO:007121615 | Oral cavity | OSCC | cellular response to biotic stimulus | 129/7305 | 246/18723 | 1.20e-05 | 1.23e-04 | 129 |
| GO:000223717 | Oral cavity | OSCC | response to molecule of bacterial origin | 181/7305 | 363/18723 | 1.48e-05 | 1.49e-04 | 181 |
| GO:00485259 | Oral cavity | OSCC | negative regulation of viral process | 56/7305 | 92/18723 | 1.77e-05 | 1.72e-04 | 56 |
| GO:007122210 | Oral cavity | OSCC | cellular response to lipopolysaccharide | 110/7305 | 209/18723 | 4.15e-05 | 3.60e-04 | 110 |
| GO:00321037 | Oral cavity | OSCC | positive regulation of response to external stimulus | 203/7305 | 427/18723 | 1.79e-04 | 1.22e-03 | 203 |
| Page: 1 2 3 4 5 6 7 8 9 10 11 12 13 14 15 16 17 |
| Pathway ID | Tissue | Disease Stage | Description | Gene Ratio | Bg Ratio | pvalue | p.adjust | qvalue | Count |
| hsa0513126 | Endometrium | AEH | Shigellosis | 78/1197 | 247/8465 | 9.23e-13 | 2.00e-11 | 1.46e-11 | 78 |
| hsa05131111 | Endometrium | AEH | Shigellosis | 78/1197 | 247/8465 | 9.23e-13 | 2.00e-11 | 1.46e-11 | 78 |
| hsa0513127 | Endometrium | EEC | Shigellosis | 79/1237 | 247/8465 | 1.80e-12 | 3.95e-11 | 2.95e-11 | 79 |
| hsa0513136 | Endometrium | EEC | Shigellosis | 79/1237 | 247/8465 | 1.80e-12 | 3.95e-11 | 2.95e-11 | 79 |
| hsa0513139 | Esophagus | HGIN | Shigellosis | 71/1383 | 247/8465 | 4.89e-07 | 7.98e-06 | 6.34e-06 | 71 |
| hsa05131114 | Esophagus | HGIN | Shigellosis | 71/1383 | 247/8465 | 4.89e-07 | 7.98e-06 | 6.34e-06 | 71 |
| hsa05131211 | Esophagus | ESCC | Shigellosis | 176/4205 | 247/8465 | 2.27e-12 | 4.01e-11 | 2.05e-11 | 176 |
| hsa05131310 | Esophagus | ESCC | Shigellosis | 176/4205 | 247/8465 | 2.27e-12 | 4.01e-11 | 2.05e-11 | 176 |
| hsa0513122 | Liver | Cirrhotic | Shigellosis | 105/2530 | 247/8465 | 1.31e-05 | 1.21e-04 | 7.48e-05 | 105 |
| hsa0513132 | Liver | Cirrhotic | Shigellosis | 105/2530 | 247/8465 | 1.31e-05 | 1.21e-04 | 7.48e-05 | 105 |
| hsa0513142 | Liver | HCC | Shigellosis | 150/4020 | 247/8465 | 1.53e-05 | 1.04e-04 | 5.81e-05 | 150 |
| hsa0513152 | Liver | HCC | Shigellosis | 150/4020 | 247/8465 | 1.53e-05 | 1.04e-04 | 5.81e-05 | 150 |
| hsa0513130 | Oral cavity | OSCC | Shigellosis | 150/3704 | 247/8465 | 3.96e-08 | 3.12e-07 | 1.59e-07 | 150 |
| hsa05131113 | Oral cavity | OSCC | Shigellosis | 150/3704 | 247/8465 | 3.96e-08 | 3.12e-07 | 1.59e-07 | 150 |
| hsa0513146 | Oral cavity | EOLP | Shigellosis | 61/1218 | 247/8465 | 9.48e-06 | 5.47e-05 | 3.23e-05 | 61 |
| hsa0513156 | Oral cavity | EOLP | Shigellosis | 61/1218 | 247/8465 | 9.48e-06 | 5.47e-05 | 3.23e-05 | 61 |
| hsa0513163 | Oral cavity | NEOLP | Shigellosis | 62/1112 | 247/8465 | 1.93e-07 | 2.79e-06 | 1.75e-06 | 62 |
| hsa0513173 | Oral cavity | NEOLP | Shigellosis | 62/1112 | 247/8465 | 1.93e-07 | 2.79e-06 | 1.75e-06 | 62 |
| Page: 1 |
Top |
Cell-cell communication analysis |
| Identification of potential cell-cell interactions between two cell types and their ligand-receptor pairs for different disease states |
| Ligand | Receptor | LRpair | Pathway | Tissue | Disease Stage |
| Page: 1 |
Top |
Single-cell gene regulatory network inference analysis |
| Find out the significant the regulons (TFs) and the target genes of each regulon across cell types for different disease states |
| TF | Cell Type | Tissue | Disease Stage | Target Gene | RSS | Regulon Activity |
| ∗The dot plots of a searched regulon are shown for all cell subpopulations in each disease state of each tissue based on the regulon specific score inferred using pySCENIC and by calculating the average expression. |
| Page: 1 |
Top |
Somatic mutation of malignant transformation related genes |
| Annotation of somatic variants for genes involved in malignant transformation |
| Hugo Symbol | Variant Class | Variant Classification | dbSNP RS | HGVSc | HGVSp | HGVSp Short | SWISSPROT | BIOTYPE | SIFT | PolyPhen | Tumor Sample Barcode | Tissue | Histology | Sex | Age | Stage | Therapy Types | Drugs | Outcome |
| TNIP1 | SNV | Missense_Mutation | novel | c.1882N>G | p.Pro628Ala | p.P628A | Q15025 | protein_coding | tolerated_low_confidence(0.79) | benign(0) | TCGA-5L-AAT1-01 | Breast | breast invasive carcinoma | Female | <65 | III/IV | Hormone Therapy | letrozol | SD |
| TNIP1 | SNV | Missense_Mutation | novel | c.139G>C | p.Glu47Gln | p.E47Q | Q15025 | protein_coding | deleterious(0.04) | probably_damaging(0.982) | TCGA-A2-A04Y-01 | Breast | breast invasive carcinoma | Female | <65 | I/II | Chemotherapy | cytoxan | SD |
| TNIP1 | SNV | Missense_Mutation | c.350N>A | p.Pro117Gln | p.P117Q | Q15025 | protein_coding | deleterious(0.03) | possibly_damaging(0.576) | TCGA-AO-A128-01 | Breast | breast invasive carcinoma | Female | <65 | I/II | Chemotherapy | doxorubicin | SD | |
| TNIP1 | SNV | Missense_Mutation | rs750825606 | c.915N>A | p.Met305Ile | p.M305I | Q15025 | protein_coding | tolerated(1) | benign(0) | TCGA-BH-A0HF-01 | Breast | breast invasive carcinoma | Female | >=65 | I/II | Hormone Therapy | arimidex | SD |
| TNIP1 | SNV | Missense_Mutation | c.391N>A | p.Glu131Lys | p.E131K | Q15025 | protein_coding | deleterious(0) | benign(0.22) | TCGA-BH-A0HP-01 | Breast | breast invasive carcinoma | Female | >=65 | III/IV | Chemotherapy | doxorubicin | SD | |
| TNIP1 | SNV | Missense_Mutation | rs751538216 | c.898N>A | p.Glu300Lys | p.E300K | Q15025 | protein_coding | deleterious(0.02) | possibly_damaging(0.662) | TCGA-D8-A27V-01 | Breast | breast invasive carcinoma | Female | <65 | I/II | Hormone Therapy | tamoxiphen | SD |
| TNIP1 | insertion | Nonsense_Mutation | novel | c.137-1_137insCATGCCTTCAGTGTTGAGAGGCTCACCACTGCCTCA | p.Gly46delinsAlaCysLeuGlnCysTerGluAlaHisHisCysLeuArg | p.G46delinsACLQC*EAHHCLR | Q15025 | protein_coding | TCGA-A2-A04Y-01 | Breast | breast invasive carcinoma | Female | <65 | I/II | Chemotherapy | cytoxan | SD | ||
| TNIP1 | insertion | Frame_Shift_Ins | novel | c.140_141insAGCTGGGCTTGCCTGTT | p.Leu48AlafsTer25 | p.L48Afs*25 | Q15025 | protein_coding | TCGA-BH-A0B1-01 | Breast | breast invasive carcinoma | Female | >=65 | I/II | Chemotherapy | adriamycin | SD | ||
| TNIP1 | insertion | In_Frame_Ins | novel | c.138_139insAAGCTGAGGCCCAGGGAA | p.Gly46_Glu47insLysLeuArgProArgGlu | p.G46_E47insKLRPRE | Q15025 | protein_coding | TCGA-BH-A0B1-01 | Breast | breast invasive carcinoma | Female | >=65 | I/II | Chemotherapy | adriamycin | SD | ||
| TNIP1 | deletion | Frame_Shift_Del | novel | c.850delN | p.Ser284ValfsTer2 | p.S284Vfs*2 | Q15025 | protein_coding | TCGA-EW-A2FV-01 | Breast | breast invasive carcinoma | Female | <65 | III/IV | Chemotherapy | docetaxel | SD |
| Page: 1 2 3 4 5 6 7 |
Top |
Related drugs of malignant transformation related genes |
| Identification of chemicals and drugs interact with genes involved in malignant transfromation |
| (DGIdb 4.0) |
| Entrez ID | Symbol | Category | Interaction Types | Drug Claim Name | Drug Name | PMIDs |
| Page: 1 |

Copyright 2023-Present -The University of Texas Health Science Center at Houston |