| Tissue | Expression Dynamics | Abbreviation |
| Colorectum (GSE201348) | 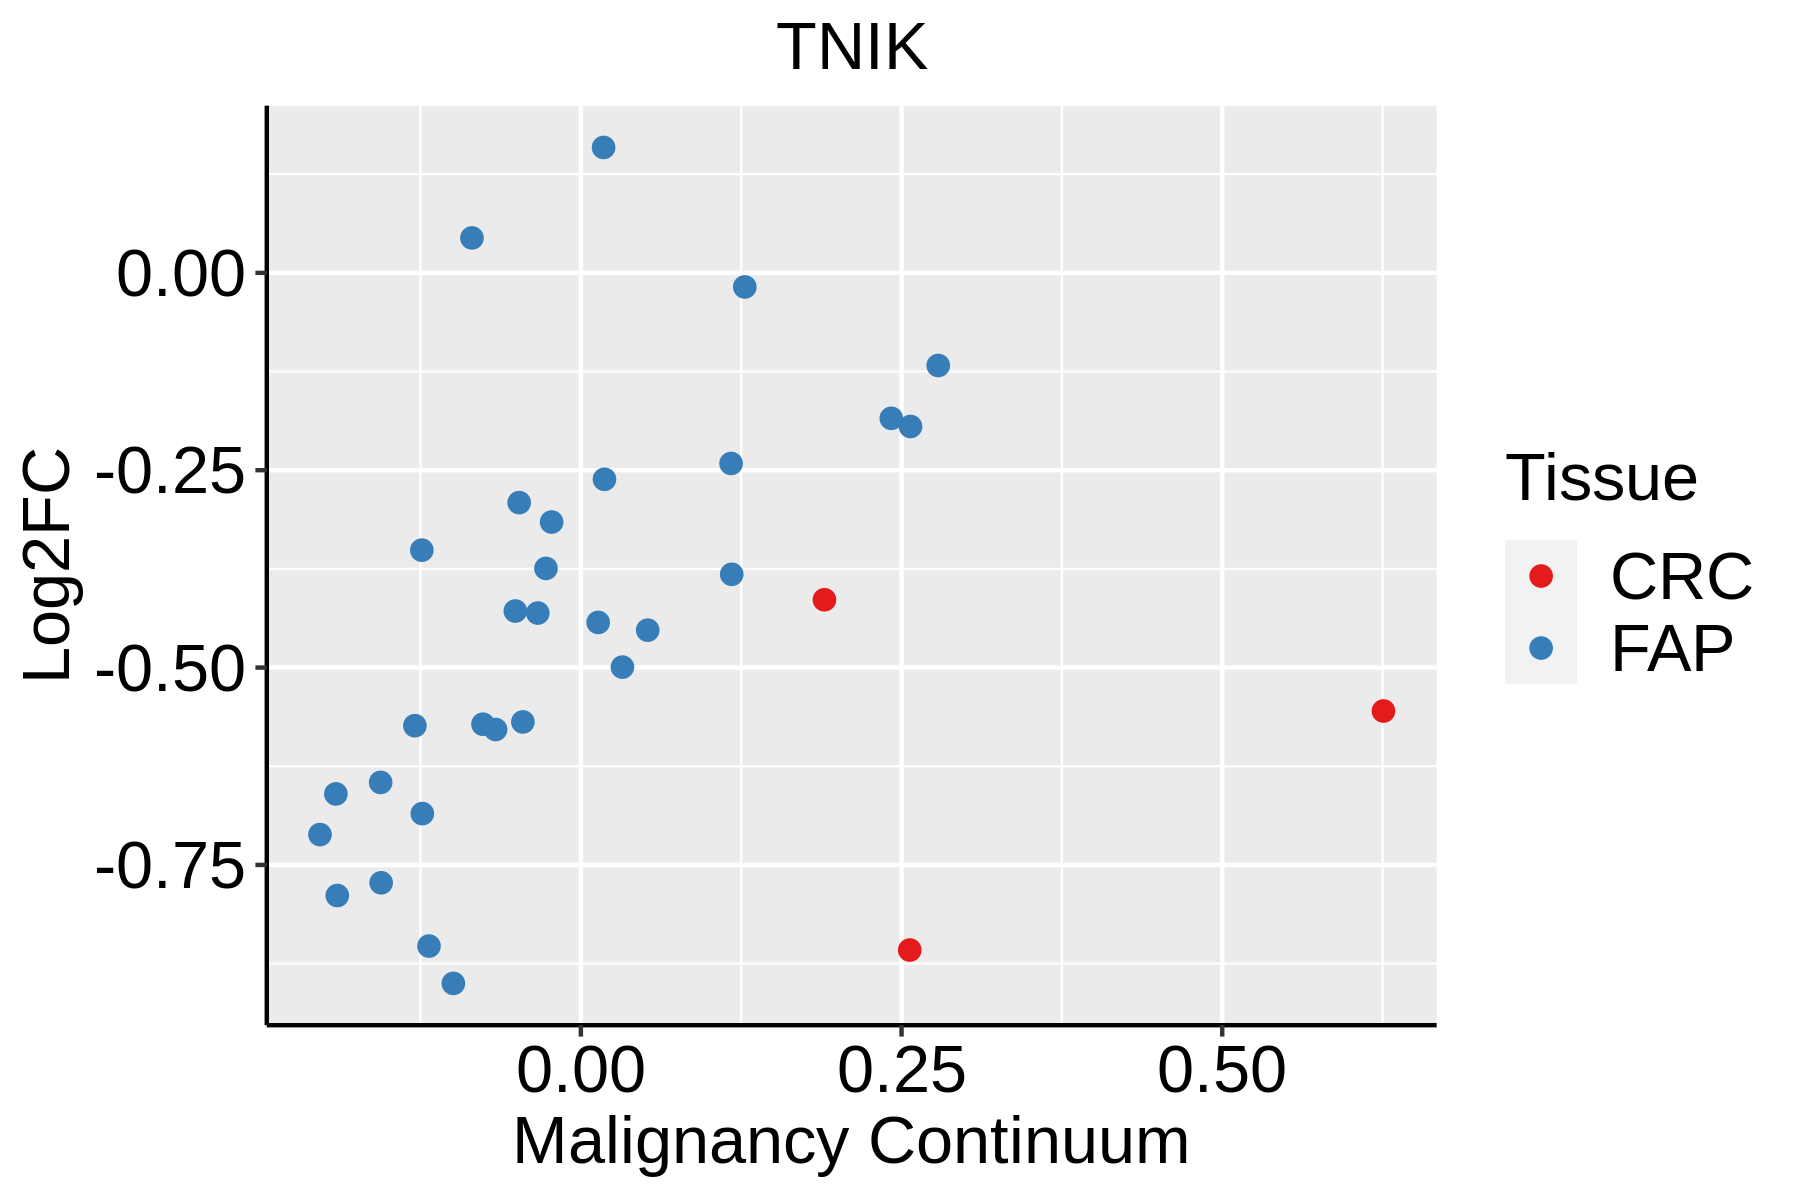 | FAP: Familial adenomatous polyposis |
| CRC: Colorectal cancer |
| Colorectum (HTA11) |  | AD: Adenomas |
| SER: Sessile serrated lesions |
| MSI-H: Microsatellite-high colorectal cancer |
| MSS: Microsatellite stable colorectal cancer |
| Esophagus | 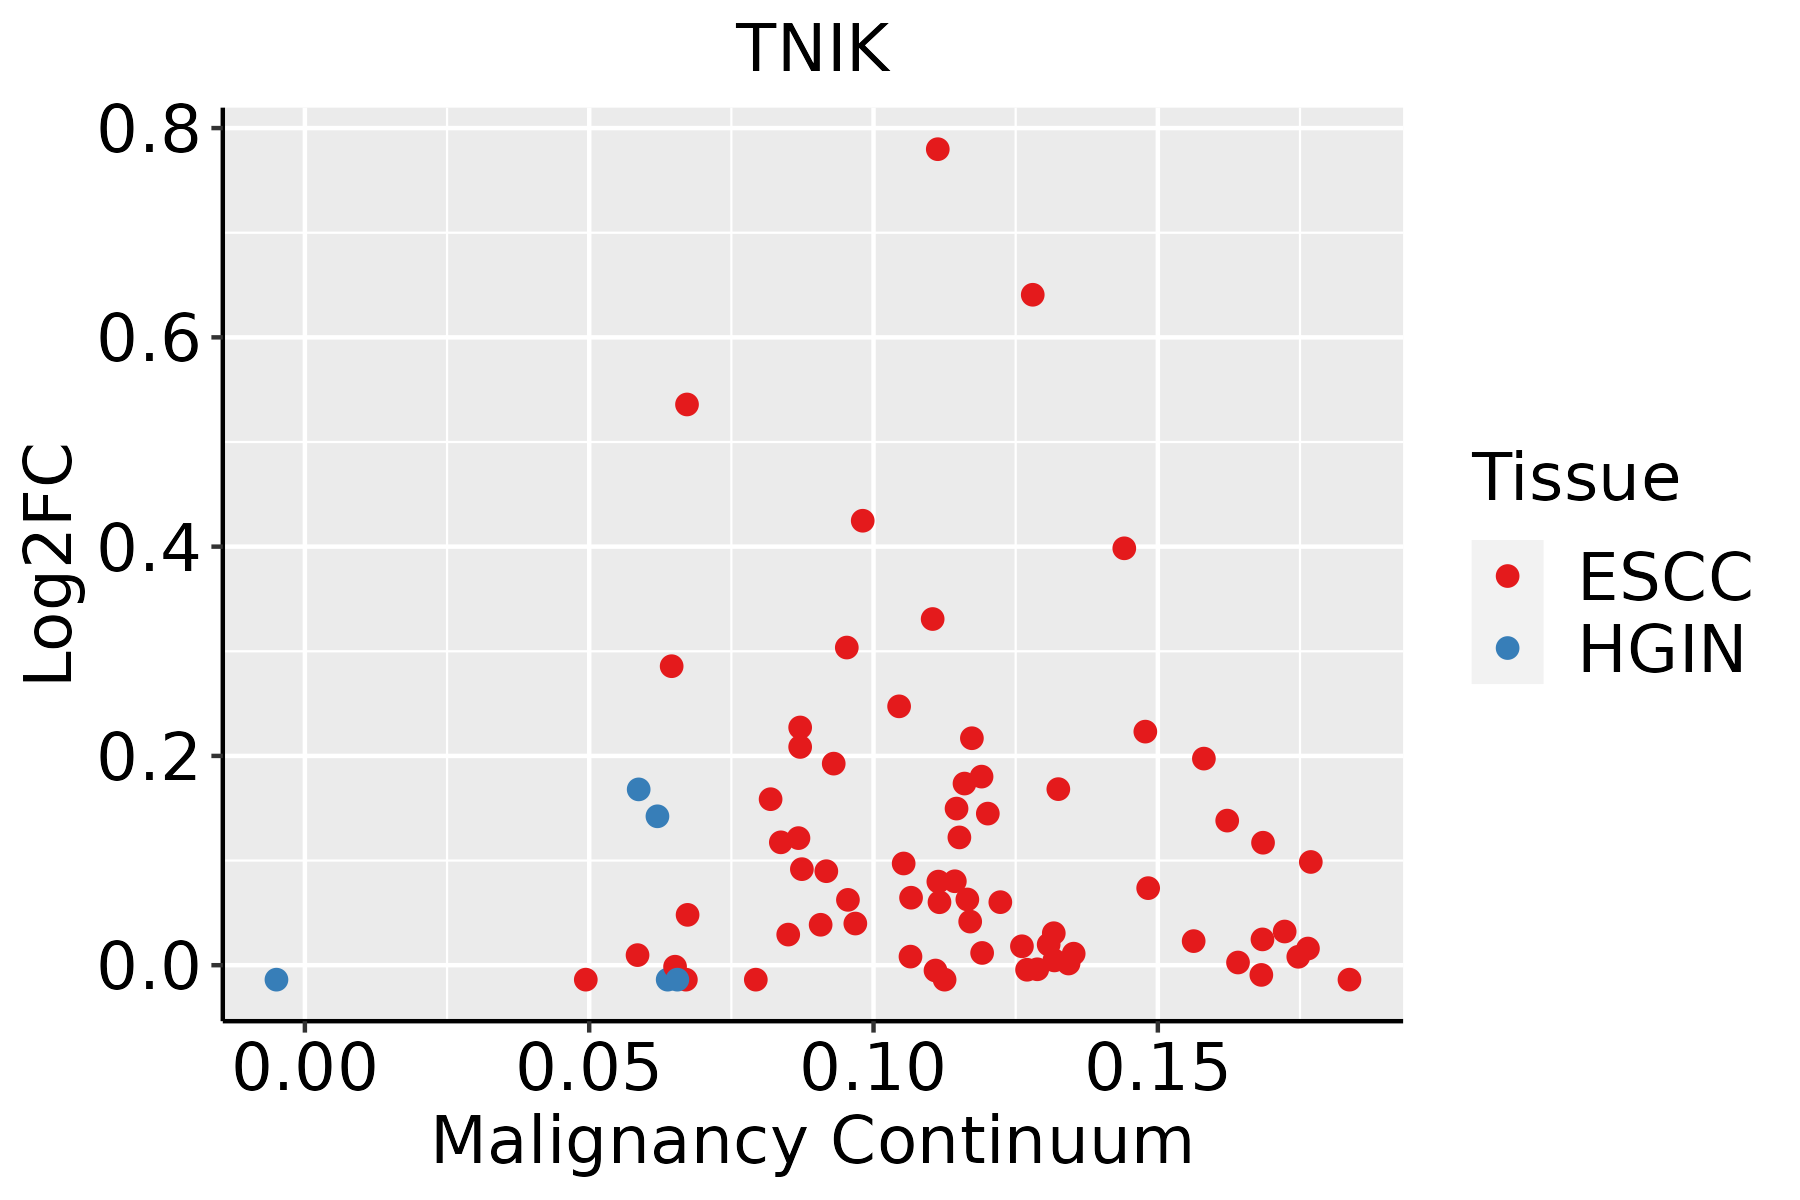 | ESCC: Esophageal squamous cell carcinoma |
| HGIN: High-grade intraepithelial neoplasias |
| LGIN: Low-grade intraepithelial neoplasias |
| GC | 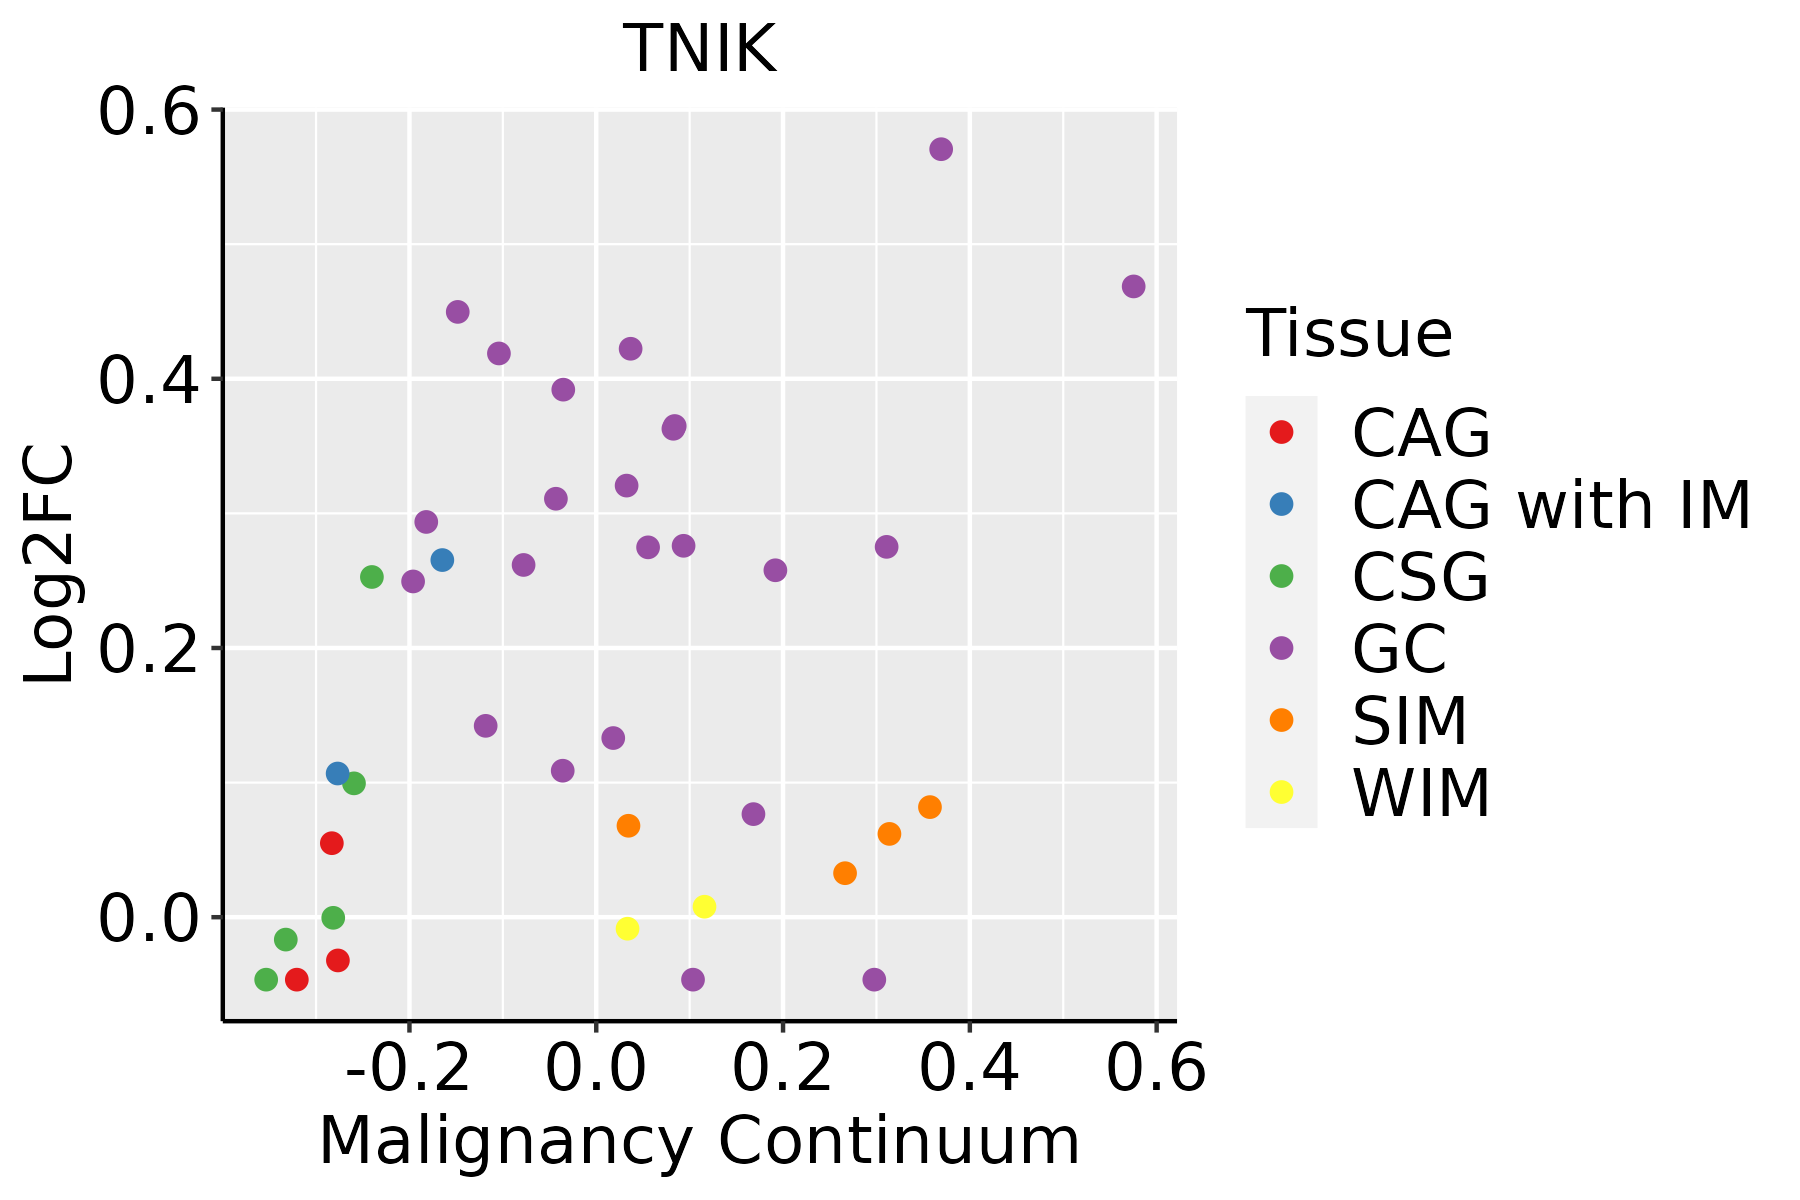 | CAG: Chronic atrophic gastritis |
| CAG with IM: Chronic atrophic gastritis with intestinal metaplasia |
| CSG: Chronic superficial gastritis |
| GC: Gastric cancer |
| SIM: Severe intestinal metaplasia |
| WIM: Wild intestinal metaplasia |
| Lung | 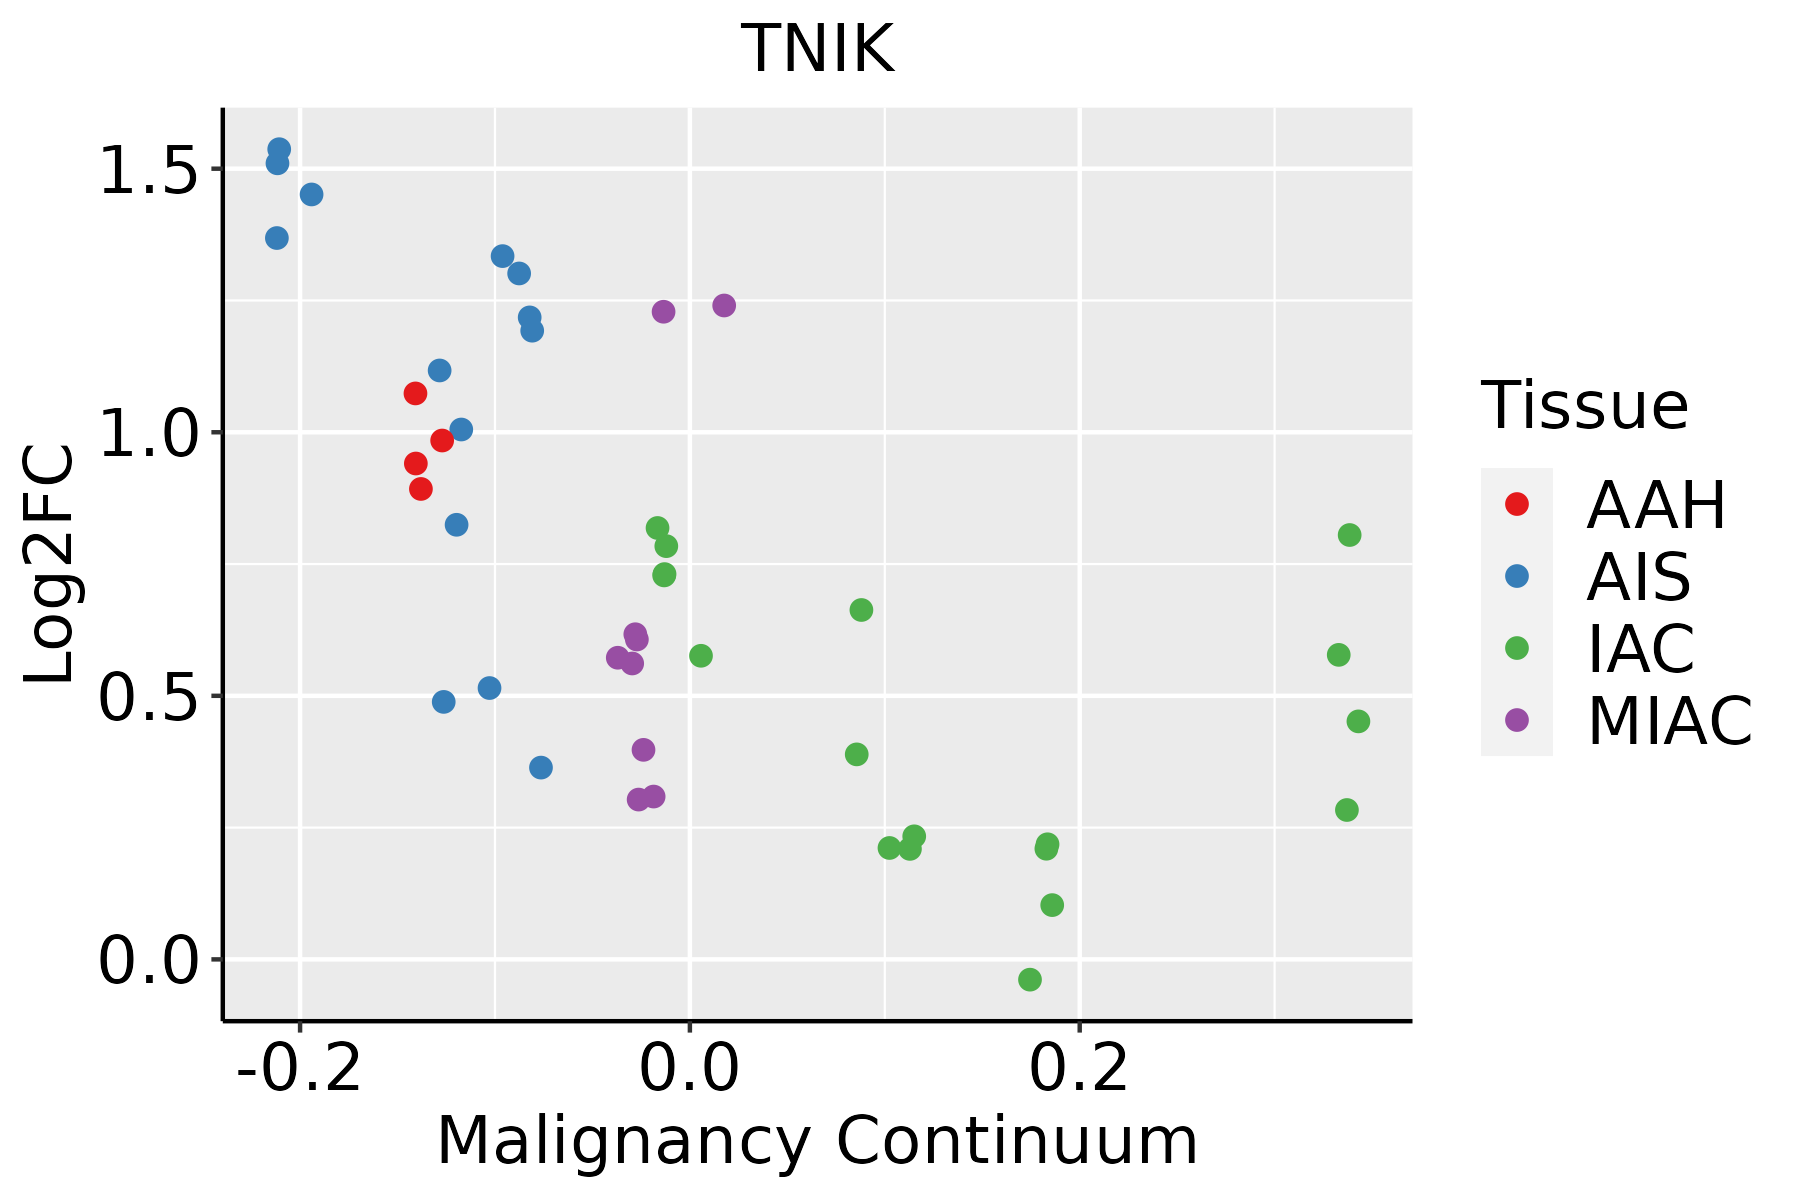 | AAH: Atypical adenomatous hyperplasia |
| AIS: Adenocarcinoma in situ |
| IAC: Invasive lung adenocarcinoma |
| MIA: Minimally invasive adenocarcinoma |
| Thyroid | 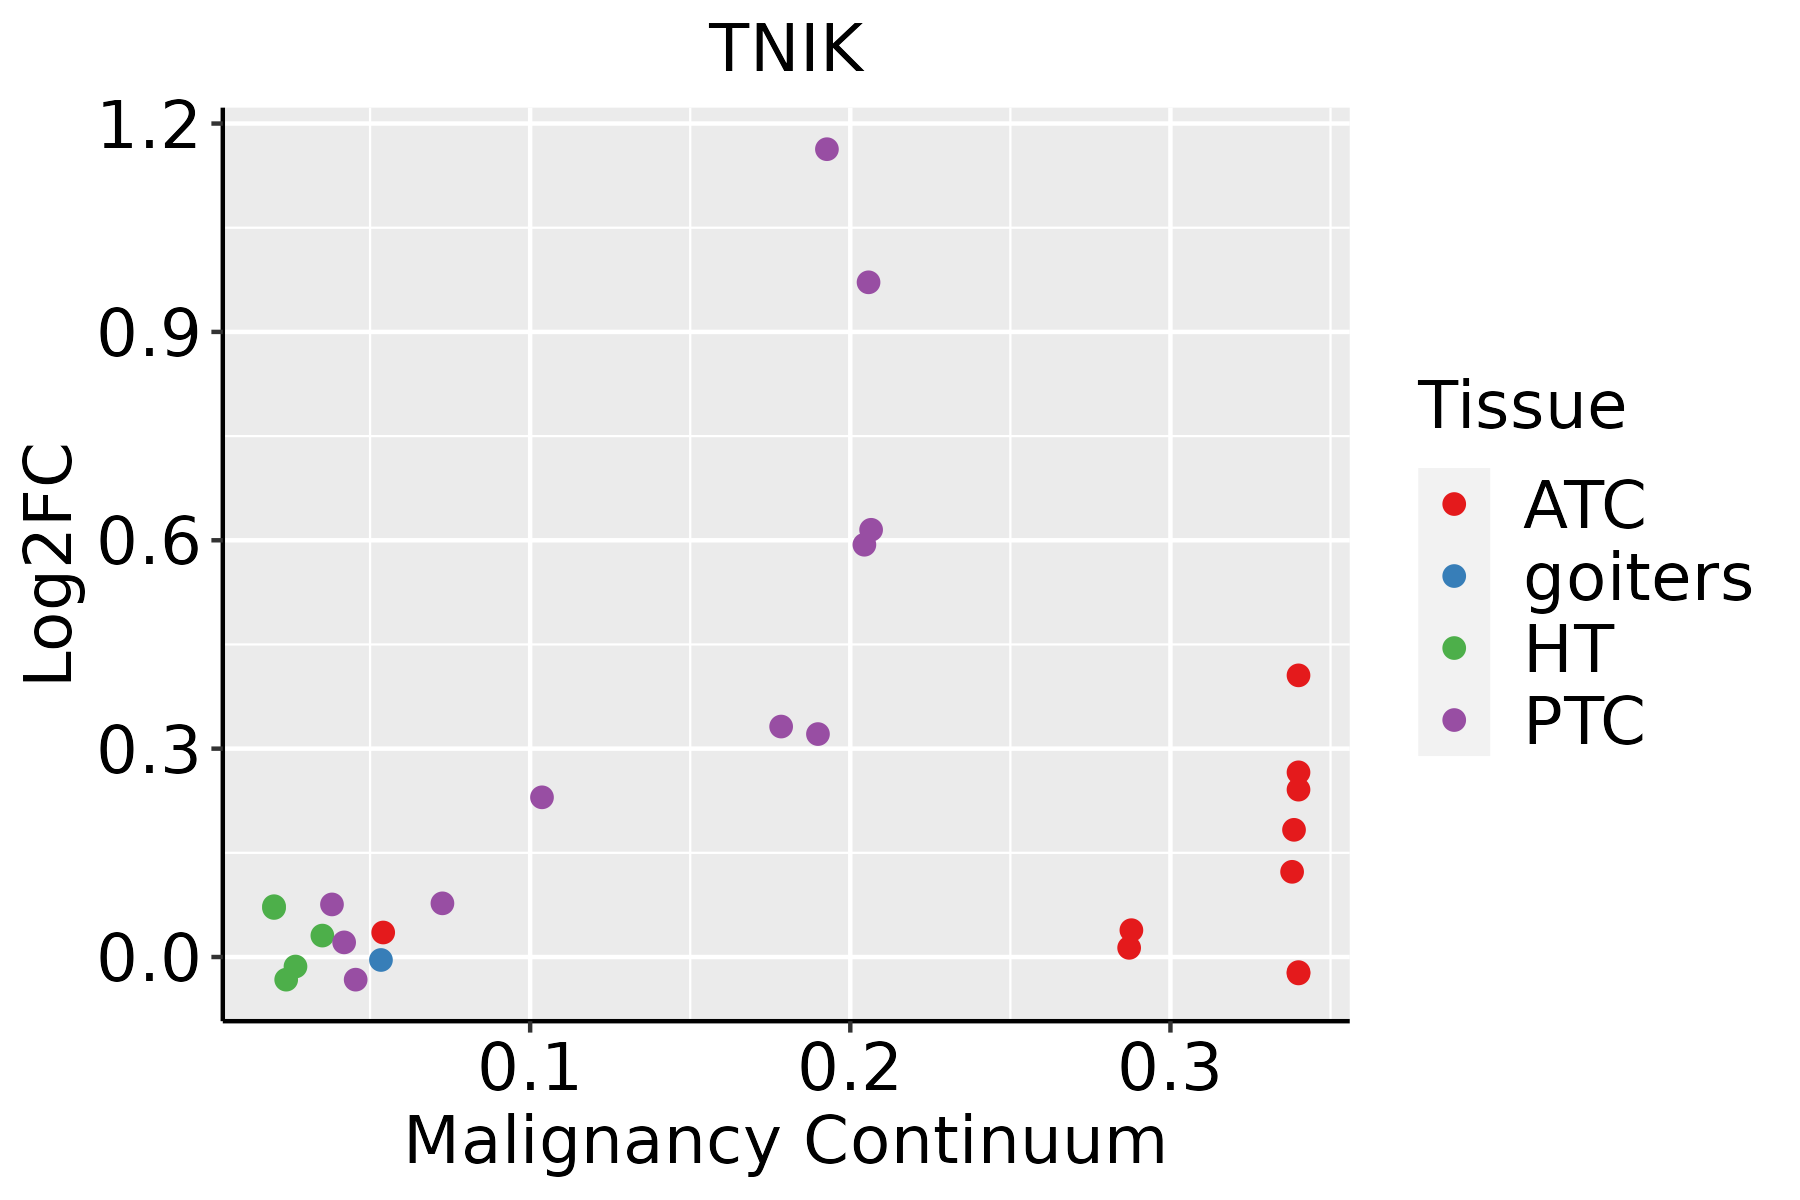 | ATC: Anaplastic thyroid cancer |
| HT: Hashimoto's thyroiditis |
| PTC: Papillary thyroid cancer |
| GO ID | Tissue | Disease Stage | Description | Gene Ratio | Bg Ratio | pvalue | p.adjust | Count |
| GO:00315325 | Stomach | GC | actin cytoskeleton reorganization | 21/1159 | 107/18723 | 2.10e-06 | 9.21e-05 | 21 |
| GO:00328724 | Stomach | GC | regulation of stress-activated MAPK cascade | 26/1159 | 192/18723 | 1.40e-04 | 2.59e-03 | 26 |
| GO:00703024 | Stomach | GC | regulation of stress-activated protein kinase signaling cascade | 26/1159 | 195/18723 | 1.81e-04 | 3.13e-03 | 26 |
| GO:00310985 | Stomach | GC | stress-activated protein kinase signaling cascade | 30/1159 | 247/18723 | 3.20e-04 | 5.10e-03 | 30 |
| GO:00514035 | Stomach | GC | stress-activated MAPK cascade | 29/1159 | 239/18723 | 4.06e-04 | 6.18e-03 | 29 |
| GO:003153211 | Stomach | CAG with IM | actin cytoskeleton reorganization | 20/1050 | 107/18723 | 1.79e-06 | 8.16e-05 | 20 |
| GO:003252811 | Stomach | CAG with IM | microvillus organization | 9/1050 | 24/18723 | 3.22e-06 | 1.29e-04 | 9 |
| GO:003287211 | Stomach | CAG with IM | regulation of stress-activated MAPK cascade | 25/1050 | 192/18723 | 7.51e-05 | 1.78e-03 | 25 |
| GO:007030211 | Stomach | CAG with IM | regulation of stress-activated protein kinase signaling cascade | 25/1050 | 195/18723 | 9.68e-05 | 2.19e-03 | 25 |
| GO:003109811 | Stomach | CAG with IM | stress-activated protein kinase signaling cascade | 29/1050 | 247/18723 | 1.37e-04 | 2.79e-03 | 29 |
| GO:003003311 | Stomach | CAG with IM | microvillus assembly | 6/1050 | 16/18723 | 1.51e-04 | 2.97e-03 | 6 |
| GO:005140311 | Stomach | CAG with IM | stress-activated MAPK cascade | 28/1050 | 239/18723 | 1.84e-04 | 3.49e-03 | 28 |
| GO:00463282 | Stomach | CAG with IM | regulation of JNK cascade | 16/1050 | 133/18723 | 3.19e-03 | 2.96e-02 | 16 |
| GO:00726596 | Stomach | CAG with IM | protein localization to plasma membrane | 27/1050 | 284/18723 | 5.25e-03 | 4.19e-02 | 27 |
| GO:00072542 | Stomach | CAG with IM | JNK cascade | 18/1050 | 167/18723 | 5.96e-03 | 4.62e-02 | 18 |
| GO:003153221 | Stomach | CSG | actin cytoskeleton reorganization | 20/1034 | 107/18723 | 1.42e-06 | 6.87e-05 | 20 |
| GO:003252821 | Stomach | CSG | microvillus organization | 9/1034 | 24/18723 | 2.84e-06 | 1.23e-04 | 9 |
| GO:003287221 | Stomach | CSG | regulation of stress-activated MAPK cascade | 25/1034 | 192/18723 | 5.87e-05 | 1.47e-03 | 25 |
| GO:007030221 | Stomach | CSG | regulation of stress-activated protein kinase signaling cascade | 25/1034 | 195/18723 | 7.59e-05 | 1.82e-03 | 25 |
| GO:003109821 | Stomach | CSG | stress-activated protein kinase signaling cascade | 29/1034 | 247/18723 | 1.05e-04 | 2.29e-03 | 29 |
| Hugo Symbol | Variant Class | Variant Classification | dbSNP RS | HGVSc | HGVSp | HGVSp Short | SWISSPROT | BIOTYPE | SIFT | PolyPhen | Tumor Sample Barcode | Tissue | Histology | Sex | Age | Stage | Therapy Types | Drugs | Outcome |
| TNIK | SNV | Missense_Mutation | novel | c.664N>C | p.Thr222Pro | p.T222P | Q9UKE5 | protein_coding | deleterious(0.01) | probably_damaging(0.993) | TCGA-A2-A04Q-01 | Breast | breast invasive carcinoma | Female | <65 | I/II | Chemotherapy | adriamycin | SD |
| TNIK | SNV | Missense_Mutation | novel | c.1642N>C | p.Ser548Pro | p.S548P | Q9UKE5 | protein_coding | deleterious(0.01) | probably_damaging(0.979) | TCGA-A2-A0D0-01 | Breast | breast invasive carcinoma | Female | <65 | I/II | Chemotherapy | cytoxan | SD |
| TNIK | SNV | Missense_Mutation | | c.335N>G | p.Ser112Cys | p.S112C | Q9UKE5 | protein_coding | deleterious(0) | probably_damaging(0.997) | TCGA-AC-A23H-01 | Breast | breast invasive carcinoma | Female | >=65 | I/II | Unknown | Unknown | PD |
| TNIK | SNV | Missense_Mutation | | c.1679N>T | p.Ser560Phe | p.S560F | Q9UKE5 | protein_coding | deleterious_low_confidence(0.03) | possibly_damaging(0.887) | TCGA-AC-A3QQ-01 | Breast | breast invasive carcinoma | Female | <65 | I/II | Unknown | Unknown | SD |
| TNIK | SNV | Missense_Mutation | novel | c.1642N>C | p.Ser548Pro | p.S548P | Q9UKE5 | protein_coding | deleterious(0.01) | probably_damaging(0.979) | TCGA-AR-A255-01 | Breast | breast invasive carcinoma | Female | <65 | I/II | Targeted Molecular therapy | trastuzumab | SD |
| TNIK | SNV | Missense_Mutation | novel | c.1201N>G | p.Gln401Glu | p.Q401E | Q9UKE5 | protein_coding | tolerated(0.22) | possibly_damaging(0.68) | TCGA-AR-A256-01 | Breast | breast invasive carcinoma | Female | <65 | I/II | Chemotherapy | doxorubicin | PD |
| TNIK | SNV | Missense_Mutation | rs867347961 | c.3086N>G | p.Asn1029Ser | p.N1029S | Q9UKE5 | protein_coding | tolerated(0.08) | benign(0.325) | TCGA-AR-A2LN-01 | Breast | breast invasive carcinoma | Female | >=65 | I/II | Hormone Therapy | letrozole | SD |
| TNIK | SNV | Missense_Mutation | novel | c.664A>C | p.Thr222Pro | p.T222P | Q9UKE5 | protein_coding | deleterious(0.01) | probably_damaging(0.993) | TCGA-B6-A0I5-01 | Breast | breast invasive carcinoma | Female | <65 | I/II | Unknown | Unknown | SD |
| TNIK | SNV | Missense_Mutation | | c.1763N>C | p.Val588Ala | p.V588A | Q9UKE5 | protein_coding | deleterious(0.04) | benign(0.074) | TCGA-BH-A18G-01 | Breast | breast invasive carcinoma | Female | >=65 | I/II | Unknown | Unknown | SD |
| TNIK | SNV | Missense_Mutation | | c.1714N>C | p.Ser572Arg | p.S572R | Q9UKE5 | protein_coding | deleterious_low_confidence(0.01) | possibly_damaging(0.791) | TCGA-C8-A1HN-01 | Breast | breast invasive carcinoma | Female | <65 | I/II | Unknown | Unknown | SD |
| Entrez ID | Symbol | Category | Interaction Types | Drug Claim Name | Drug Name | PMIDs |
| 23043 | TNIK | ENZYME, DRUGGABLE GENOME, KINASE, SERINE THREONINE KINASE | | SB-202190 | SB-202190 | 22951114 |
| 23043 | TNIK | ENZYME, DRUGGABLE GENOME, KINASE, SERINE THREONINE KINASE | inhibitor | HESPERADIN | HESPERADIN | 19035792 |
| 23043 | TNIK | ENZYME, DRUGGABLE GENOME, KINASE, SERINE THREONINE KINASE | inhibitor | 135652717 | STAUROSPORINE | |
| 23043 | TNIK | ENZYME, DRUGGABLE GENOME, KINASE, SERINE THREONINE KINASE | inhibitor | 249565872 | | |
| 23043 | TNIK | ENZYME, DRUGGABLE GENOME, KINASE, SERINE THREONINE KINASE | | CEP-1347 | CEP-1347 | 24044867 |


