| Tissue | Expression Dynamics | Abbreviation |
| Colorectum (GSE201348) |  | FAP: Familial adenomatous polyposis |
| CRC: Colorectal cancer |
| Colorectum (HTA11) | 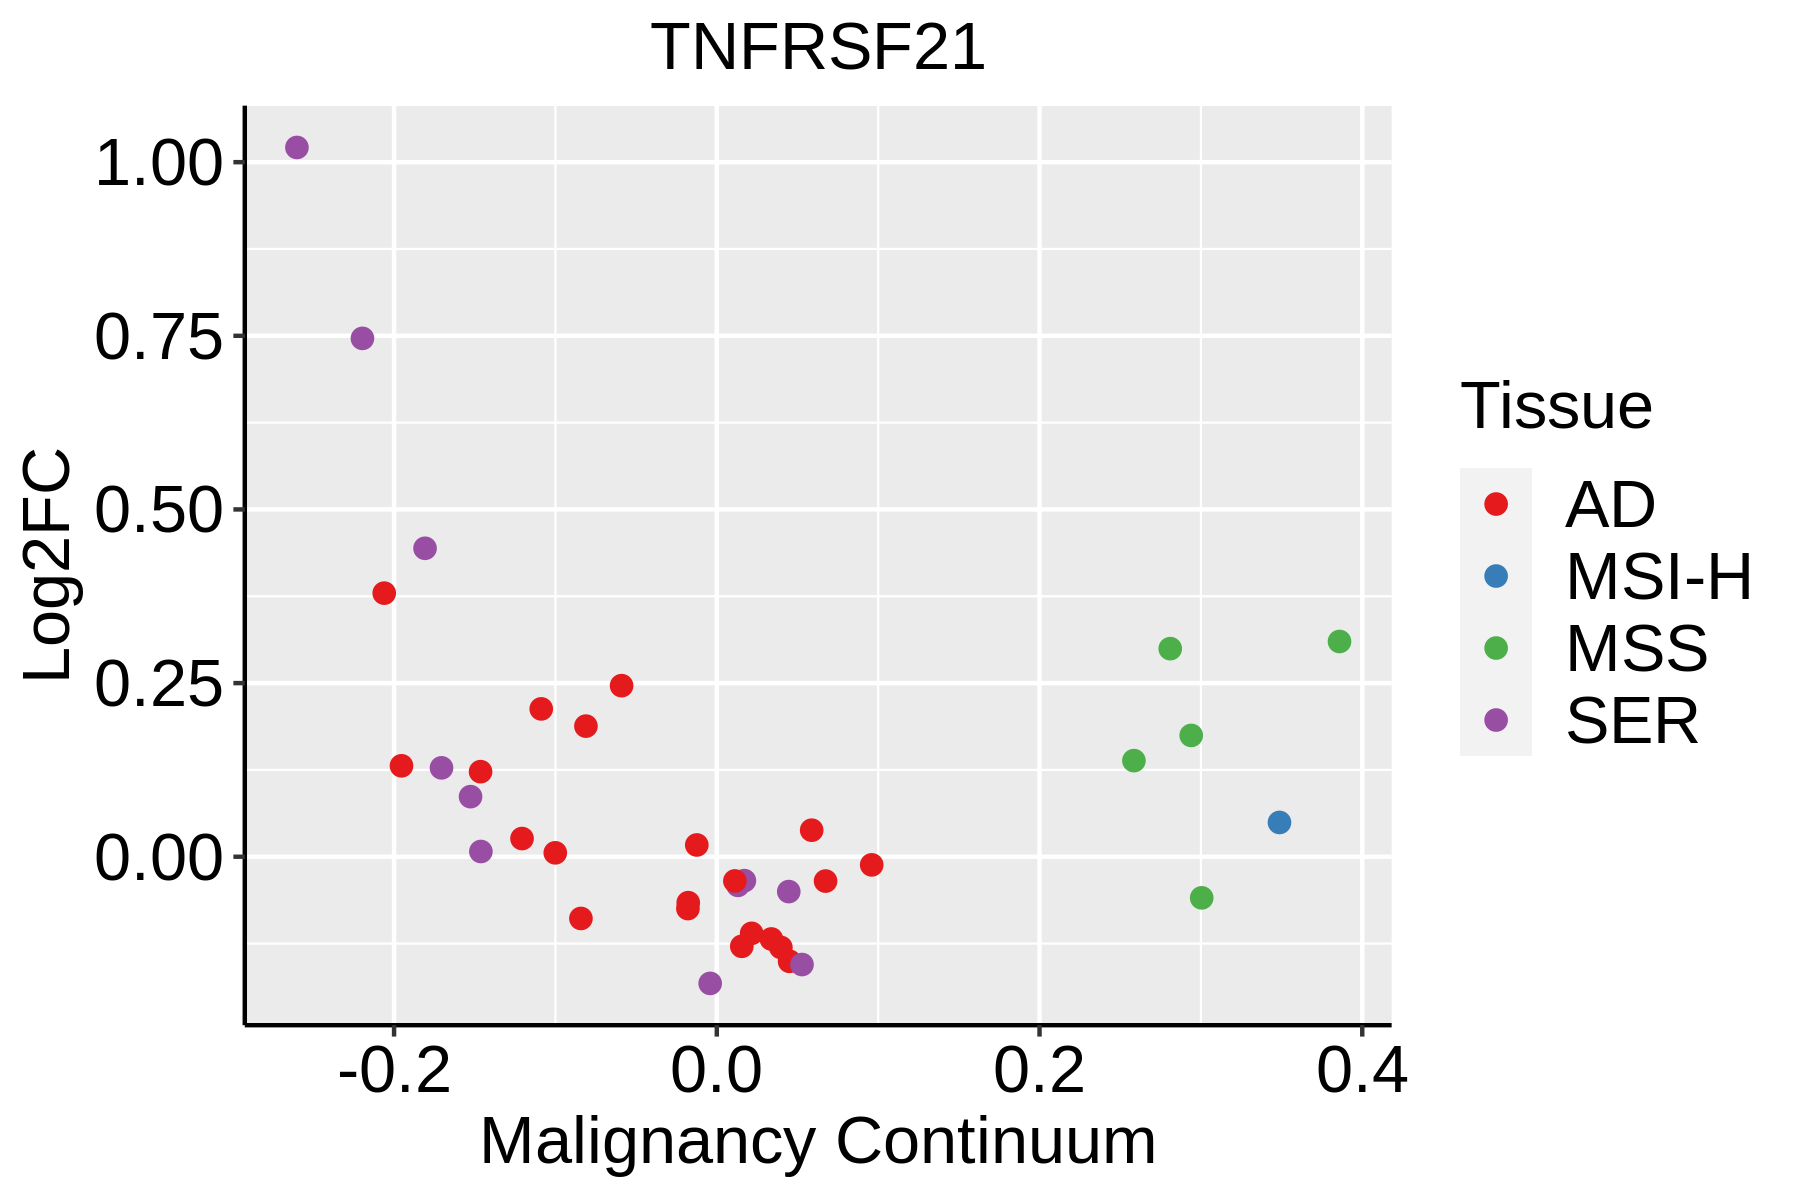 | AD: Adenomas |
| SER: Sessile serrated lesions |
| MSI-H: Microsatellite-high colorectal cancer |
| MSS: Microsatellite stable colorectal cancer |
| Esophagus | 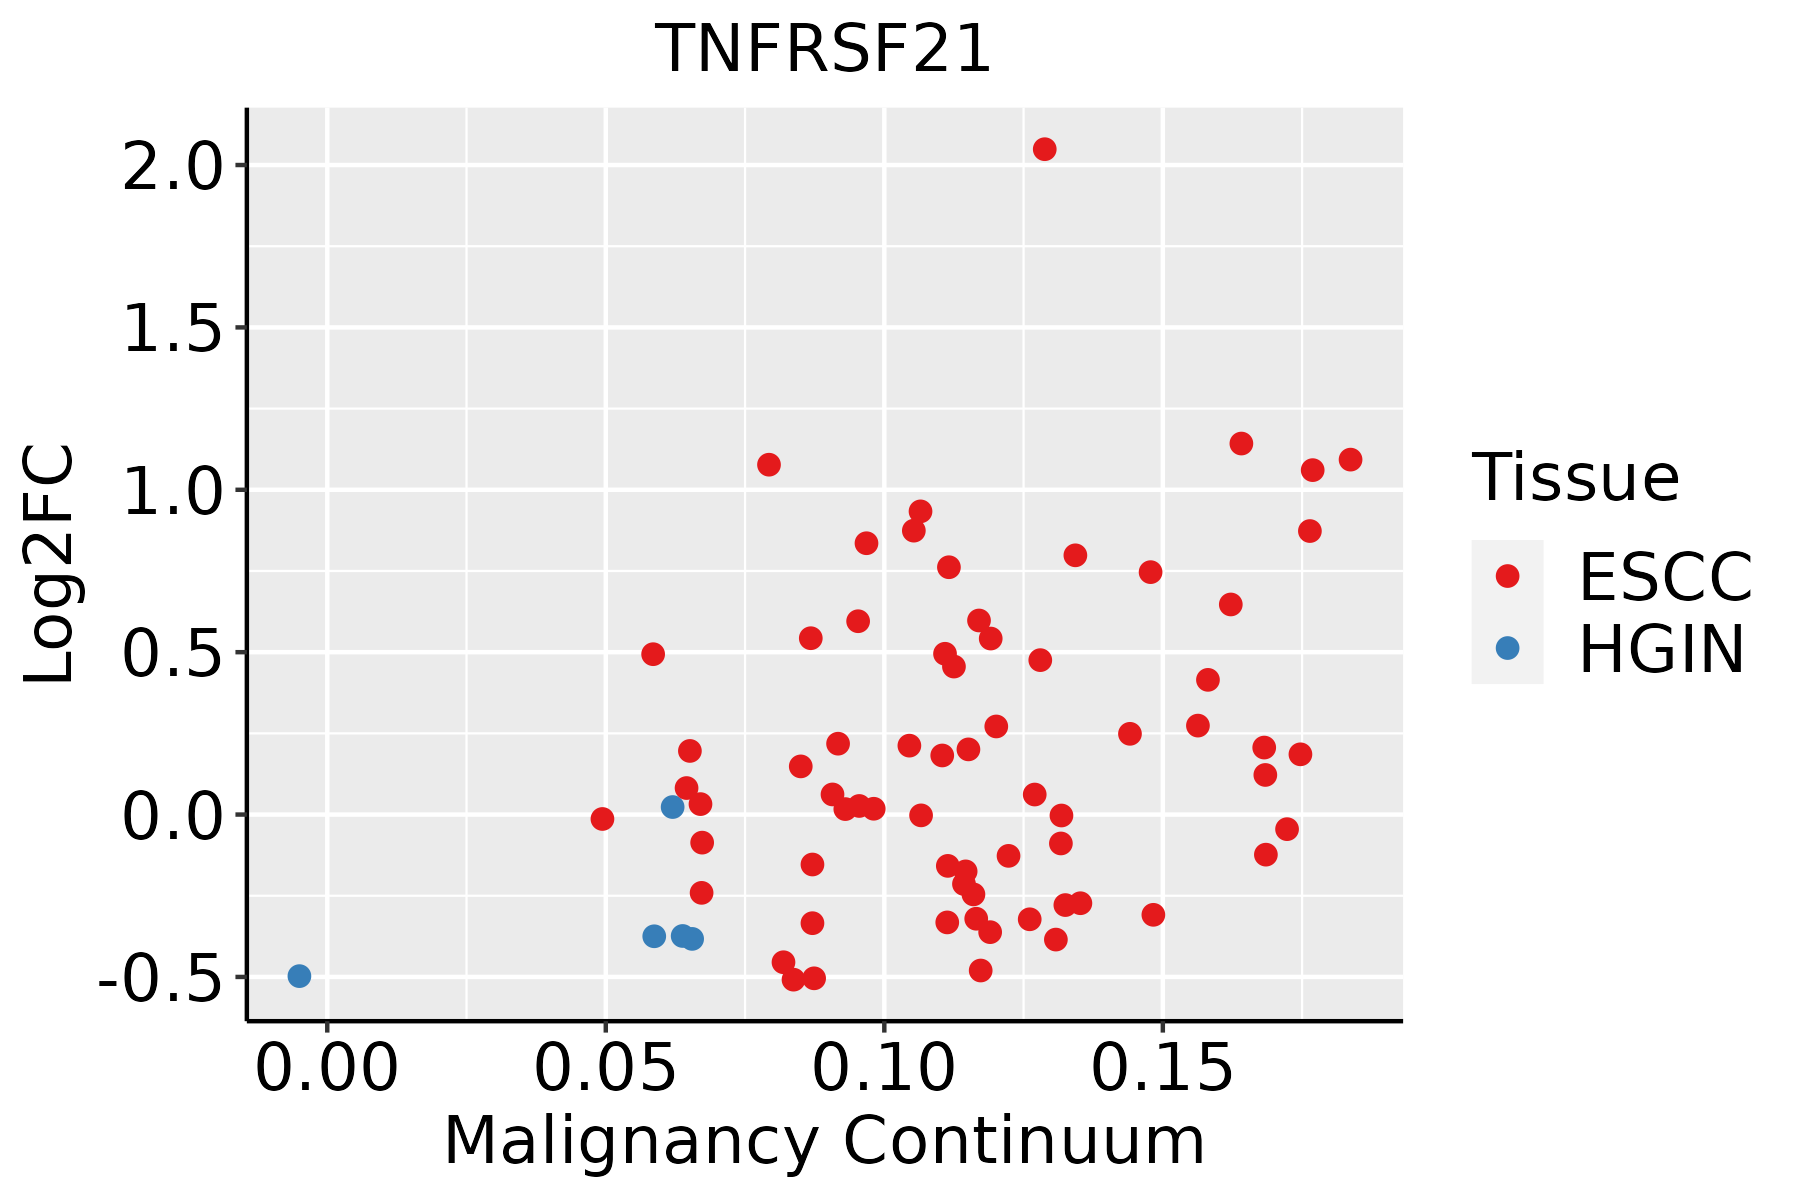 | ESCC: Esophageal squamous cell carcinoma |
| HGIN: High-grade intraepithelial neoplasias |
| LGIN: Low-grade intraepithelial neoplasias |
| GC |  | CAG: Chronic atrophic gastritis |
| CAG with IM: Chronic atrophic gastritis with intestinal metaplasia |
| CSG: Chronic superficial gastritis |
| GC: Gastric cancer |
| SIM: Severe intestinal metaplasia |
| WIM: Wild intestinal metaplasia |
| Liver |  | HCC: Hepatocellular carcinoma |
| NAFLD: Non-alcoholic fatty liver disease |
| Lung | 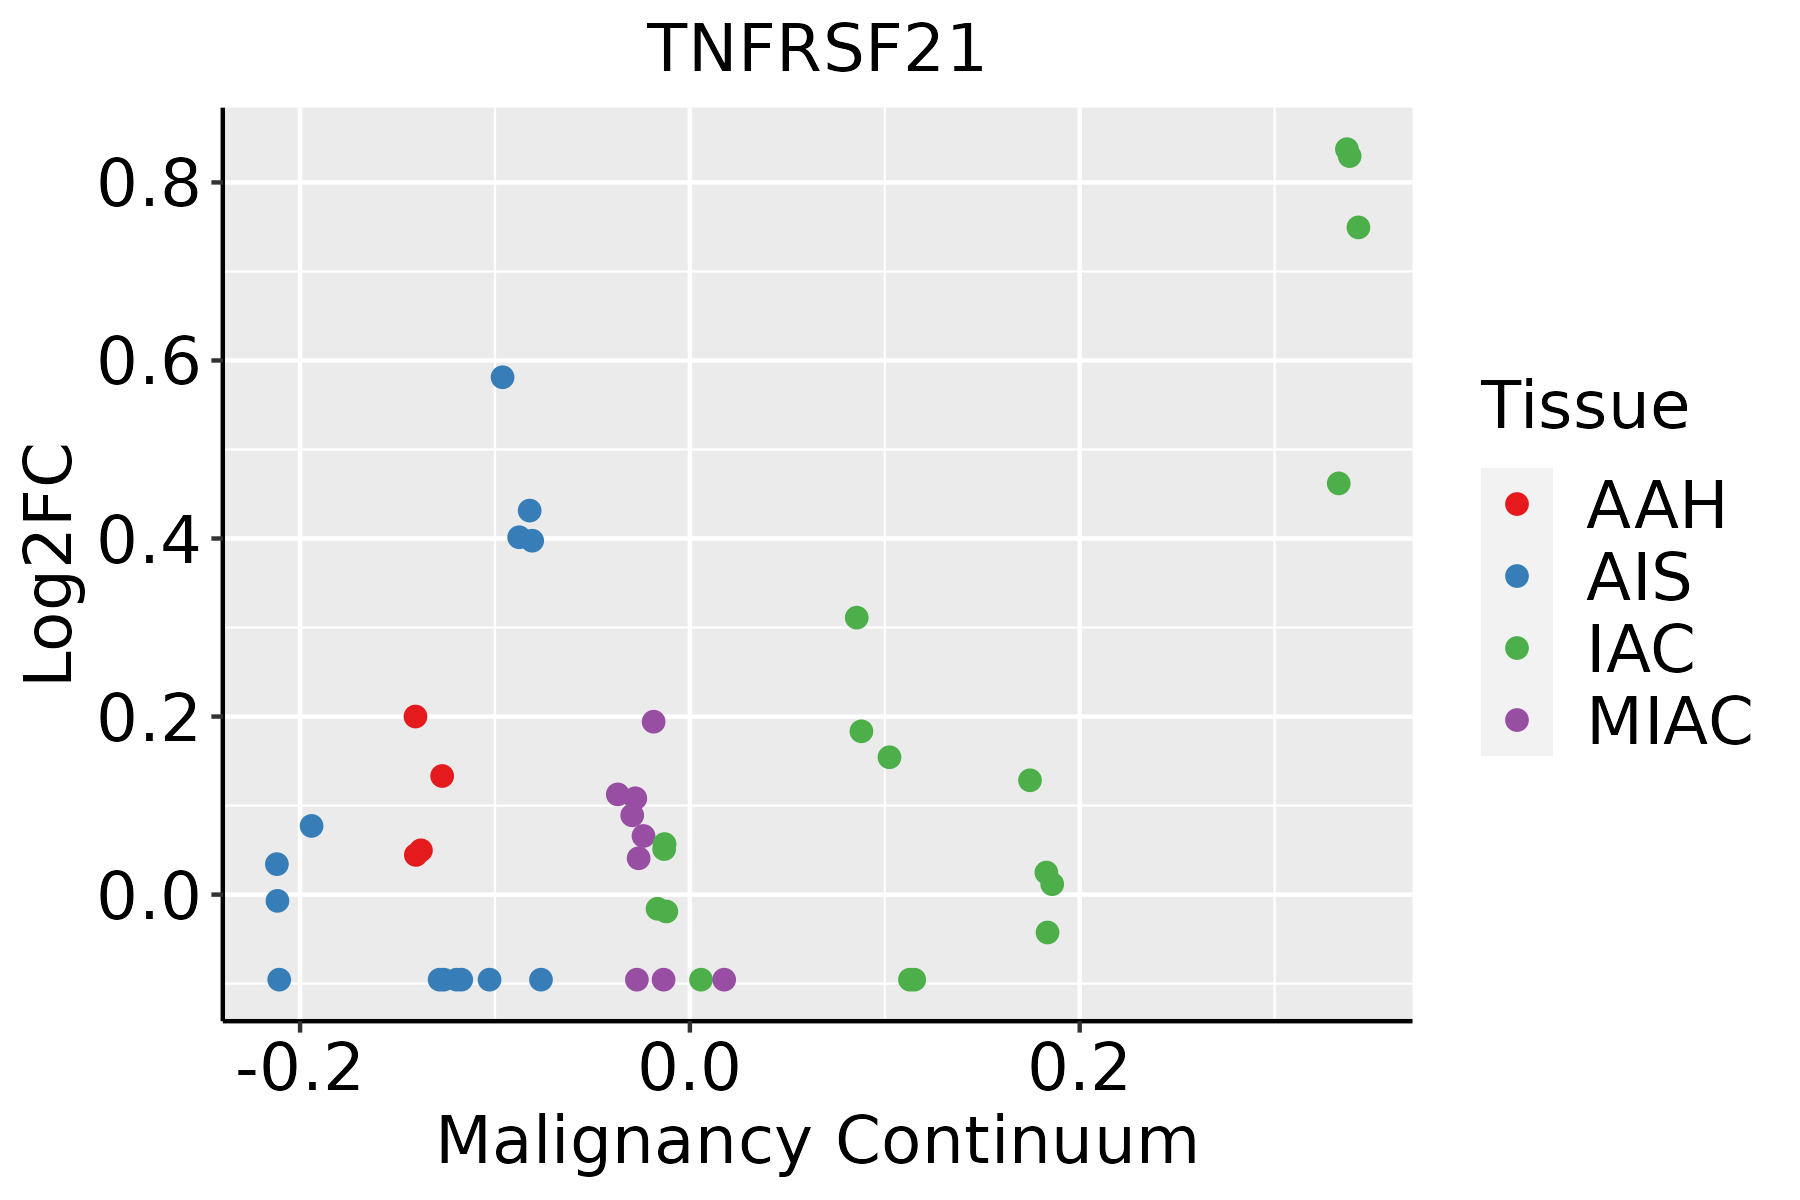 | AAH: Atypical adenomatous hyperplasia |
| AIS: Adenocarcinoma in situ |
| IAC: Invasive lung adenocarcinoma |
| MIA: Minimally invasive adenocarcinoma |
| Oral Cavity |  | EOLP: Erosive Oral lichen planus |
| LP: leukoplakia |
| NEOLP: Non-erosive oral lichen planus |
| OSCC: Oral squamous cell carcinoma |
| Prostate | 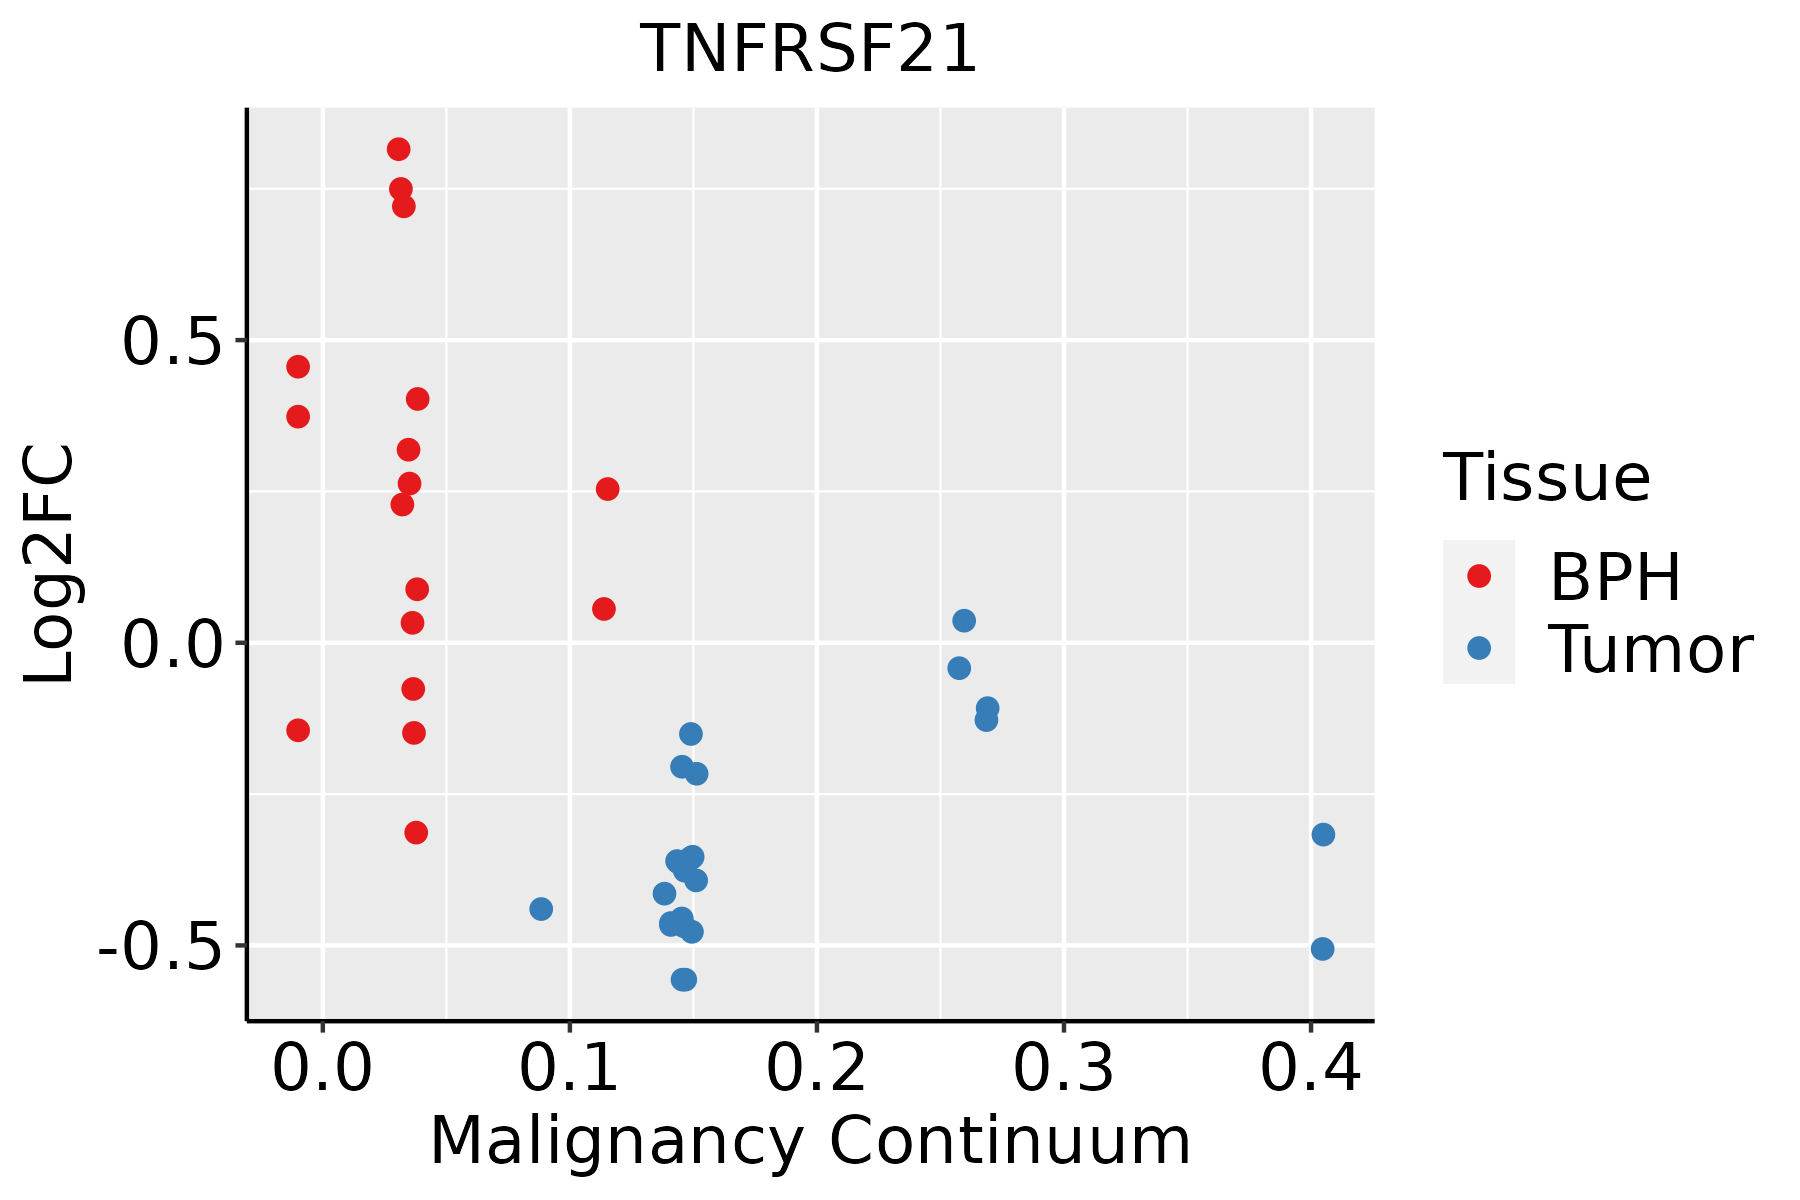 | BPH: Benign Prostatic Hyperplasia |
| Skin |  | AK: Actinic keratosis |
| cSCC: Cutaneous squamous cell carcinoma |
| SCCIS:squamous cell carcinoma in situ |
| GO ID | Tissue | Disease Stage | Description | Gene Ratio | Bg Ratio | pvalue | p.adjust | Count |
| GO:000268317 | Skin | AK | negative regulation of immune system process | 67/1910 | 434/18723 | 3.74e-04 | 3.63e-03 | 67 |
| GO:00425525 | Skin | AK | myelination | 27/1910 | 134/18723 | 4.20e-04 | 4.00e-03 | 27 |
| GO:007135624 | Skin | AK | cellular response to tumor necrosis factor | 40/1910 | 229/18723 | 4.98e-04 | 4.58e-03 | 40 |
| GO:00072725 | Skin | AK | ensheathment of neurons | 27/1910 | 136/18723 | 5.36e-04 | 4.85e-03 | 27 |
| GO:00083665 | Skin | AK | axon ensheathment | 27/1910 | 136/18723 | 5.36e-04 | 4.85e-03 | 27 |
| GO:00508529 | Skin | AK | T cell receptor signaling pathway | 25/1910 | 123/18723 | 5.89e-04 | 5.21e-03 | 25 |
| GO:003461225 | Skin | AK | response to tumor necrosis factor | 41/1910 | 253/18723 | 1.92e-03 | 1.31e-02 | 41 |
| GO:0008038 | Skin | AK | neuron recognition | 12/1910 | 49/18723 | 3.13e-03 | 1.94e-02 | 12 |
| GO:005140220 | Skin | AK | neuron apoptotic process | 39/1910 | 246/18723 | 3.62e-03 | 2.17e-02 | 39 |
| GO:00027647 | Skin | AK | immune response-regulating signaling pathway | 66/1910 | 468/18723 | 4.18e-03 | 2.45e-02 | 66 |
| GO:00224087 | Skin | AK | negative regulation of cell-cell adhesion | 32/1910 | 196/18723 | 5.06e-03 | 2.84e-02 | 32 |
| GO:00022535 | Skin | AK | activation of immune response | 54/1910 | 375/18723 | 5.90e-03 | 3.20e-02 | 54 |
| GO:00316411 | Skin | AK | regulation of myelination | 11/1910 | 47/18723 | 6.62e-03 | 3.50e-02 | 11 |
| GO:0022407110 | Skin | SCCIS | regulation of cell-cell adhesion | 53/919 | 448/18723 | 2.75e-09 | 1.45e-06 | 53 |
| GO:0042110110 | Skin | SCCIS | T cell activation | 53/919 | 487/18723 | 4.77e-08 | 8.19e-06 | 53 |
| GO:000268318 | Skin | SCCIS | negative regulation of immune system process | 49/919 | 434/18723 | 4.92e-08 | 8.19e-06 | 49 |
| GO:0007159110 | Skin | SCCIS | leukocyte cell-cell adhesion | 44/919 | 371/18723 | 5.77e-08 | 9.01e-06 | 44 |
| GO:190303719 | Skin | SCCIS | regulation of leukocyte cell-cell adhesion | 40/919 | 336/18723 | 2.09e-07 | 2.17e-05 | 40 |
| GO:005086318 | Skin | SCCIS | regulation of T cell activation | 39/919 | 329/18723 | 3.30e-07 | 3.03e-05 | 39 |
| GO:006156417 | Skin | SCCIS | axon development | 49/919 | 467/18723 | 4.63e-07 | 3.77e-05 | 49 |
| Hugo Symbol | Variant Class | Variant Classification | dbSNP RS | HGVSc | HGVSp | HGVSp Short | SWISSPROT | BIOTYPE | SIFT | PolyPhen | Tumor Sample Barcode | Tissue | Histology | Sex | Age | Stage | Therapy Types | Drugs | Outcome |
| TNFRSF21 | SNV | Missense_Mutation | | c.1600N>A | p.Ala534Thr | p.A534T | O75509 | protein_coding | tolerated(1) | benign(0) | TCGA-A8-A097-01 | Breast | breast invasive carcinoma | Female | >=65 | I/II | Hormone Therapy | tamoxiphen | SD |
| TNFRSF21 | insertion | In_Frame_Ins | novel | c.420_421insTATACCAAAGATGTTTTCTCCATTTCGTGTATTCCAAAG | p.Ser140_Asn141insTyrThrLysAspValPheSerIleSerCysIleProLys | p.S140_N141insYTKDVFSISCIPK | O75509 | protein_coding | | | TCGA-A8-A09M-01 | Breast | breast invasive carcinoma | Female | >=65 | III/IV | Chemotherapy | paclitaxel | CR |
| TNFRSF21 | insertion | Frame_Shift_Ins | novel | c.1319_1320insACACACACACACACGCATACGCCTGCACA | p.Ser441HisfsTer48 | p.S441Hfs*48 | O75509 | protein_coding | | | TCGA-AQ-A04J-01 | Breast | breast invasive carcinoma | Female | <65 | I/II | Chemotherapy | cytoxan | SD |
| TNFRSF21 | SNV | Missense_Mutation | rs781439087 | c.1414G>A | p.Glu472Lys | p.E472K | O75509 | protein_coding | deleterious(0.01) | benign(0.266) | TCGA-2W-A8YY-01 | Cervix | cervical & endocervical cancer | Female | <65 | I/II | Chemotherapy | cisplatin | CR |
| TNFRSF21 | SNV | Missense_Mutation | | c.1224N>G | p.Ile408Met | p.I408M | O75509 | protein_coding | deleterious(0.04) | possibly_damaging(0.779) | TCGA-EK-A2PL-01 | Cervix | cervical & endocervical cancer | Female | <65 | III/IV | Unknown | Unknown | SD |
| TNFRSF21 | SNV | Missense_Mutation | | c.1036N>G | p.Ile346Val | p.I346V | O75509 | protein_coding | deleterious(0) | probably_damaging(0.991) | TCGA-EK-A2RE-01 | Cervix | cervical & endocervical cancer | Female | <65 | I/II | Unknown | Unknown | SD |
| TNFRSF21 | SNV | Missense_Mutation | rs778427574 | c.1769N>A | p.Arg590His | p.R590H | O75509 | protein_coding | deleterious(0) | probably_damaging(0.981) | TCGA-AA-3672-01 | Colorectum | colon adenocarcinoma | Female | >=65 | III/IV | Unknown | Unknown | SD |
| TNFRSF21 | SNV | Missense_Mutation | | c.1376N>T | p.Ala459Val | p.A459V | O75509 | protein_coding | deleterious(0) | possibly_damaging(0.64) | TCGA-AA-3854-01 | Colorectum | colon adenocarcinoma | Female | >=65 | I/II | Unknown | Unknown | SD |
| TNFRSF21 | SNV | Missense_Mutation | rs867596127 | c.1483N>T | p.Arg495Cys | p.R495C | O75509 | protein_coding | deleterious(0) | probably_damaging(0.986) | TCGA-AA-A010-01 | Colorectum | colon adenocarcinoma | Female | <65 | I/II | Chemotherapy | folinic | CR |
| TNFRSF21 | SNV | Missense_Mutation | | c.1363G>A | p.Asp455Asn | p.D455N | O75509 | protein_coding | deleterious(0.01) | probably_damaging(0.976) | TCGA-CK-5913-01 | Colorectum | colon adenocarcinoma | Female | <65 | I/II | Unknown | Unknown | SD |


