
|
|||||
|
 | |
| |
| |
| |
| |
| |
|
Gene: TENT4B |
Gene summary for TENT4B |
| Gene information | Species | Human | Gene symbol | TENT4B | Gene ID | 64282 |
| Gene name | terminal nucleotidyltransferase 4B | |
| Gene Alias | PAPD5 | |
| Cytomap | 16q12.1 | |
| Gene Type | protein-coding | GO ID | GO:0000288 | UniProtAcc | Q8NDF8 |
Top |
Malignant transformation analysis |
| Identification of the aberrant gene expression in precancerous and cancerous lesions by comparing the gene expression of stem-like cells in diseased tissues with normal stem cells |
| Entrez ID | Symbol | Replicates | Species | Organ | Tissue | Adj P-value | Log2FC | Malignancy |
| 64282 | TENT4B | HTA11_3410_2000001011 | Human | Colorectum | AD | 1.09e-06 | -3.48e-01 | 0.0155 |
| 64282 | TENT4B | HTA11_99999970781_79442 | Human | Colorectum | MSS | 2.71e-26 | -5.12e-01 | 0.294 |
| 64282 | TENT4B | HTA11_99999965104_69814 | Human | Colorectum | MSS | 1.14e-10 | -5.12e-01 | 0.281 |
| 64282 | TENT4B | HTA11_99999971662_82457 | Human | Colorectum | MSS | 6.56e-26 | -5.12e-01 | 0.3859 |
| 64282 | TENT4B | HTA11_99999973899_84307 | Human | Colorectum | MSS | 5.60e-08 | -5.12e-01 | 0.2585 |
| 64282 | TENT4B | HTA11_99999974143_84620 | Human | Colorectum | MSS | 2.71e-26 | -5.12e-01 | 0.3005 |
| 64282 | TENT4B | F007 | Human | Colorectum | FAP | 1.37e-02 | -2.79e-01 | 0.1176 |
| 64282 | TENT4B | A001-C-207 | Human | Colorectum | FAP | 4.02e-02 | -2.27e-01 | 0.1278 |
| 64282 | TENT4B | A015-C-203 | Human | Colorectum | FAP | 8.58e-14 | -2.62e-01 | -0.1294 |
| 64282 | TENT4B | A015-C-204 | Human | Colorectum | FAP | 2.40e-02 | -5.07e-02 | -0.0228 |
| 64282 | TENT4B | A002-C-201 | Human | Colorectum | FAP | 1.16e-08 | -1.77e-01 | 0.0324 |
| 64282 | TENT4B | A001-C-119 | Human | Colorectum | FAP | 4.30e-06 | -3.26e-01 | -0.1557 |
| 64282 | TENT4B | A001-C-108 | Human | Colorectum | FAP | 3.19e-08 | -2.65e-01 | -0.0272 |
| 64282 | TENT4B | A002-C-205 | Human | Colorectum | FAP | 2.51e-13 | -1.90e-01 | -0.1236 |
| 64282 | TENT4B | A001-C-104 | Human | Colorectum | FAP | 7.81e-03 | -2.05e-01 | 0.0184 |
| 64282 | TENT4B | A015-C-005 | Human | Colorectum | FAP | 8.27e-04 | -1.94e-01 | -0.0336 |
| 64282 | TENT4B | A015-C-006 | Human | Colorectum | FAP | 7.80e-14 | -4.44e-01 | -0.0994 |
| 64282 | TENT4B | A015-C-106 | Human | Colorectum | FAP | 3.19e-09 | -2.94e-01 | -0.0511 |
| 64282 | TENT4B | A002-C-114 | Human | Colorectum | FAP | 6.24e-14 | -3.82e-01 | -0.1561 |
| 64282 | TENT4B | A015-C-104 | Human | Colorectum | FAP | 2.20e-16 | -3.01e-01 | -0.1899 |
| Page: 1 2 3 |
| Tissue | Expression Dynamics | Abbreviation |
| Colorectum (GSE201348) |  | FAP: Familial adenomatous polyposis |
| CRC: Colorectal cancer | ||
| Colorectum (HTA11) | 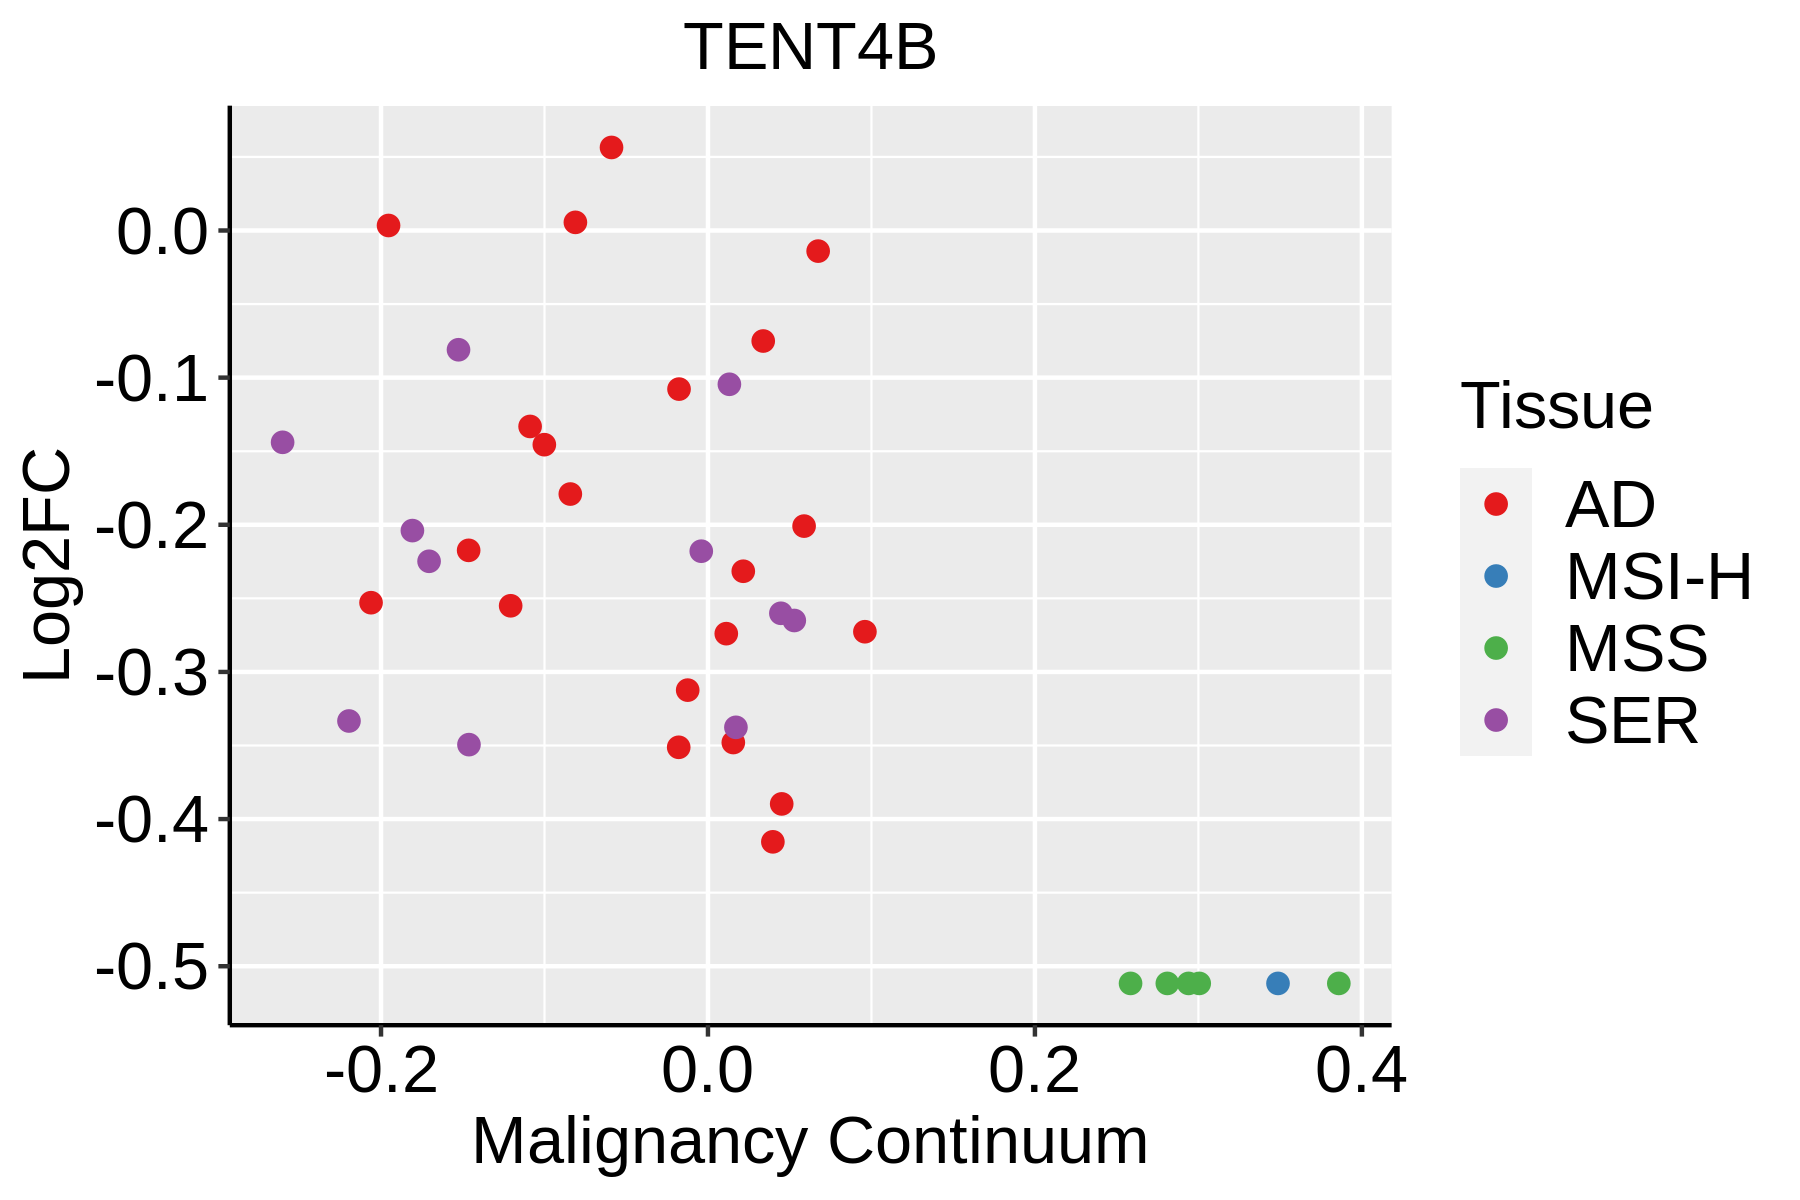 | AD: Adenomas |
| SER: Sessile serrated lesions | ||
| MSI-H: Microsatellite-high colorectal cancer | ||
| MSS: Microsatellite stable colorectal cancer | ||
| Thyroid |  | ATC: Anaplastic thyroid cancer |
| HT: Hashimoto's thyroiditis | ||
| PTC: Papillary thyroid cancer |
| ∗log2FC in expression of this searched gene in stem-like cells from each diseased tissue sample relative to stem-like cells in normal samples in each tissue plotted against the malignancy continuum. Samples are colored based on if they are from different disease stage. |
Top |
Malignant transformation related pathway analysis |
| Find out the enriched GO biological processes and KEGG pathways involved in transition from healthy to precancer to cancer |
| Tissue | Disease Stage | Enriched GO biological Processes |
| Colorectum | AD |  |
| Colorectum | SER |  |
| Colorectum | MSS |  |
| Colorectum | MSI-H |  |
| Colorectum | FAP |  |
| ∗Top 15 enriched GO BP terms are showed in the bar plot of each disease state in each tissue. Each row represents a significant GO biological process which is colored according to the -log10(p.adjust). |
| Page: 1 2 3 4 5 6 7 8 9 |
| GO ID | Tissue | Disease Stage | Description | Gene Ratio | Bg Ratio | pvalue | p.adjust | Count |
| GO:00009563 | Colorectum | CRC | nuclear-transcribed mRNA catabolic process | 29/2078 | 112/18723 | 9.39e-06 | 3.25e-04 | 29 |
| GO:19033133 | Colorectum | CRC | positive regulation of mRNA metabolic process | 30/2078 | 118/18723 | 9.83e-06 | 3.31e-04 | 30 |
| GO:00064175 | Colorectum | CRC | regulation of translation | 82/2078 | 468/18723 | 1.79e-05 | 5.40e-04 | 82 |
| GO:00346555 | Colorectum | CRC | nucleobase-containing compound catabolic process | 73/2078 | 407/18723 | 2.28e-05 | 6.57e-04 | 73 |
| GO:20002785 | Colorectum | CRC | regulation of DNA biosynthetic process | 27/2078 | 106/18723 | 2.59e-05 | 7.16e-04 | 27 |
| GO:00002893 | Colorectum | CRC | nuclear-transcribed mRNA poly(A) tail shortening | 12/2078 | 29/18723 | 2.86e-05 | 7.61e-04 | 12 |
| GO:00611573 | Colorectum | CRC | mRNA destabilization | 23/2078 | 84/18723 | 2.93e-05 | 7.73e-04 | 23 |
| GO:00442705 | Colorectum | CRC | cellular nitrogen compound catabolic process | 78/2078 | 451/18723 | 4.48e-05 | 1.07e-03 | 78 |
| GO:19001513 | Colorectum | CRC | regulation of nuclear-transcribed mRNA catabolic process, deadenylation-dependent decay | 9/2078 | 18/18723 | 4.78e-05 | 1.12e-03 | 9 |
| GO:00467005 | Colorectum | CRC | heterocycle catabolic process | 77/2078 | 445/18723 | 4.92e-05 | 1.14e-03 | 77 |
| GO:00106394 | Colorectum | CRC | negative regulation of organelle organization | 63/2078 | 348/18723 | 6.09e-05 | 1.35e-03 | 63 |
| GO:00507793 | Colorectum | CRC | RNA destabilization | 23/2078 | 88/18723 | 6.51e-05 | 1.42e-03 | 23 |
| GO:00105862 | Colorectum | CRC | miRNA metabolic process | 11/2078 | 27/18723 | 7.34e-05 | 1.54e-03 | 11 |
| GO:00335004 | Colorectum | CRC | carbohydrate homeostasis | 49/2078 | 259/18723 | 1.29e-04 | 2.46e-03 | 49 |
| GO:19033125 | Colorectum | CRC | negative regulation of mRNA metabolic process | 23/2078 | 92/18723 | 1.36e-04 | 2.56e-03 | 23 |
| GO:19023694 | Colorectum | CRC | negative regulation of RNA catabolic process | 20/2078 | 75/18723 | 1.42e-04 | 2.62e-03 | 20 |
| GO:00194395 | Colorectum | CRC | aromatic compound catabolic process | 77/2078 | 467/18723 | 2.42e-04 | 4.00e-03 | 77 |
| GO:00226135 | Colorectum | CRC | ribonucleoprotein complex biogenesis | 76/2078 | 463/18723 | 3.04e-04 | 4.78e-03 | 76 |
| GO:00330443 | Colorectum | CRC | regulation of chromosome organization | 37/2078 | 187/18723 | 3.34e-04 | 5.10e-03 | 37 |
| GO:19013615 | Colorectum | CRC | organic cyclic compound catabolic process | 80/2078 | 495/18723 | 3.52e-04 | 5.34e-03 | 80 |
| Page: 1 2 3 4 5 6 7 8 9 10 11 12 13 14 15 16 17 |
| Pathway ID | Tissue | Disease Stage | Description | Gene Ratio | Bg Ratio | pvalue | p.adjust | qvalue | Count |
| Page: 1 |
Top |
Cell-cell communication analysis |
| Identification of potential cell-cell interactions between two cell types and their ligand-receptor pairs for different disease states |
| Ligand | Receptor | LRpair | Pathway | Tissue | Disease Stage |
| Page: 1 |
Top |
Single-cell gene regulatory network inference analysis |
| Find out the significant the regulons (TFs) and the target genes of each regulon across cell types for different disease states |
| TF | Cell Type | Tissue | Disease Stage | Target Gene | RSS | Regulon Activity |
| ∗The dot plots of a searched regulon are shown for all cell subpopulations in each disease state of each tissue based on the regulon specific score inferred using pySCENIC and by calculating the average expression. |
| Page: 1 |
Top |
Somatic mutation of malignant transformation related genes |
| Annotation of somatic variants for genes involved in malignant transformation |
| Hugo Symbol | Variant Class | Variant Classification | dbSNP RS | HGVSc | HGVSp | HGVSp Short | SWISSPROT | BIOTYPE | SIFT | PolyPhen | Tumor Sample Barcode | Tissue | Histology | Sex | Age | Stage | Therapy Types | Drugs | Outcome |
| Page: 1 |
Top |
Related drugs of malignant transformation related genes |
| Identification of chemicals and drugs interact with genes involved in malignant transfromation |
| (DGIdb 4.0) |
| Entrez ID | Symbol | Category | Interaction Types | Drug Claim Name | Drug Name | PMIDs |
| Page: 1 |

Copyright 2023-Present -The University of Texas Health Science Center at Houston |