
|
|||||
|
 | |
| |
| |
| |
| |
| |
|
Gene: TAF7 |
Gene summary for TAF7 |
| Gene information | Species | Human | Gene symbol | TAF7 | Gene ID | 6879 |
| Gene name | TATA-box binding protein associated factor 7 | |
| Gene Alias | TAF2F | |
| Cytomap | 5q31.3 | |
| Gene Type | protein-coding | GO ID | GO:0000122 | UniProtAcc | Q15545 |
Top |
Malignant transformation analysis |
| Identification of the aberrant gene expression in precancerous and cancerous lesions by comparing the gene expression of stem-like cells in diseased tissues with normal stem cells |
| Entrez ID | Symbol | Replicates | Species | Organ | Tissue | Adj P-value | Log2FC | Malignancy |
| 6879 | TAF7 | AEH-subject2 | Human | Endometrium | AEH | 1.10e-12 | -3.42e-01 | -0.2525 |
| 6879 | TAF7 | AEH-subject3 | Human | Endometrium | AEH | 5.15e-12 | -3.67e-01 | -0.2576 |
| 6879 | TAF7 | AEH-subject4 | Human | Endometrium | AEH | 7.26e-07 | -2.12e-01 | -0.2657 |
| 6879 | TAF7 | AEH-subject5 | Human | Endometrium | AEH | 7.73e-10 | -3.82e-01 | -0.2953 |
| 6879 | TAF7 | EEC-subject1 | Human | Endometrium | EEC | 1.02e-14 | -3.41e-01 | -0.2682 |
| 6879 | TAF7 | EEC-subject2 | Human | Endometrium | EEC | 1.02e-05 | -2.68e-01 | -0.2607 |
| 6879 | TAF7 | EEC-subject3 | Human | Endometrium | EEC | 9.43e-31 | -4.72e-01 | -0.2525 |
| 6879 | TAF7 | EEC-subject4 | Human | Endometrium | EEC | 1.34e-02 | -2.63e-01 | -0.2571 |
| 6879 | TAF7 | EEC-subject5 | Human | Endometrium | EEC | 3.68e-04 | -2.99e-01 | -0.249 |
| 6879 | TAF7 | GSM5276937 | Human | Endometrium | EEC | 1.97e-02 | 1.59e-01 | -0.0897 |
| 6879 | TAF7 | GSM6177620_NYU_UCEC1_lib1_lib1 | Human | Endometrium | EEC | 4.27e-30 | -3.89e-01 | -0.1869 |
| 6879 | TAF7 | GSM6177620_NYU_UCEC1_lib2_lib2 | Human | Endometrium | EEC | 2.92e-36 | -3.20e-01 | -0.1875 |
| 6879 | TAF7 | GSM6177620_NYU_UCEC1_lib3_lib3 | Human | Endometrium | EEC | 8.20e-39 | -3.41e-01 | -0.1883 |
| 6879 | TAF7 | GSM6177621_NYU_UCEC2_lib1_lib1 | Human | Endometrium | EEC | 1.14e-26 | -4.00e-01 | -0.1934 |
| 6879 | TAF7 | GSM6177622_NYU_UCEC3_lib1_lib1 | Human | Endometrium | EEC | 1.97e-42 | -2.13e-01 | -0.1917 |
| 6879 | TAF7 | GSM6177622_NYU_UCEC3_lib2_lib2 | Human | Endometrium | EEC | 6.87e-58 | -3.20e-01 | -0.1916 |
| 6879 | TAF7 | GSM6177623_NYU_UCEC3_Vis | Human | Endometrium | EEC | 3.37e-05 | -1.55e-01 | -0.1269 |
| 6879 | TAF7 | LZE2T | Human | Esophagus | ESCC | 1.01e-05 | 5.14e-01 | 0.082 |
| 6879 | TAF7 | LZE3D | Human | Esophagus | HGIN | 3.03e-04 | 2.99e-01 | 0.0668 |
| 6879 | TAF7 | LZE4T | Human | Esophagus | ESCC | 1.51e-17 | 7.31e-01 | 0.0811 |
| Page: 1 2 3 4 5 6 7 8 9 |
| Tissue | Expression Dynamics | Abbreviation |
| Endometrium | 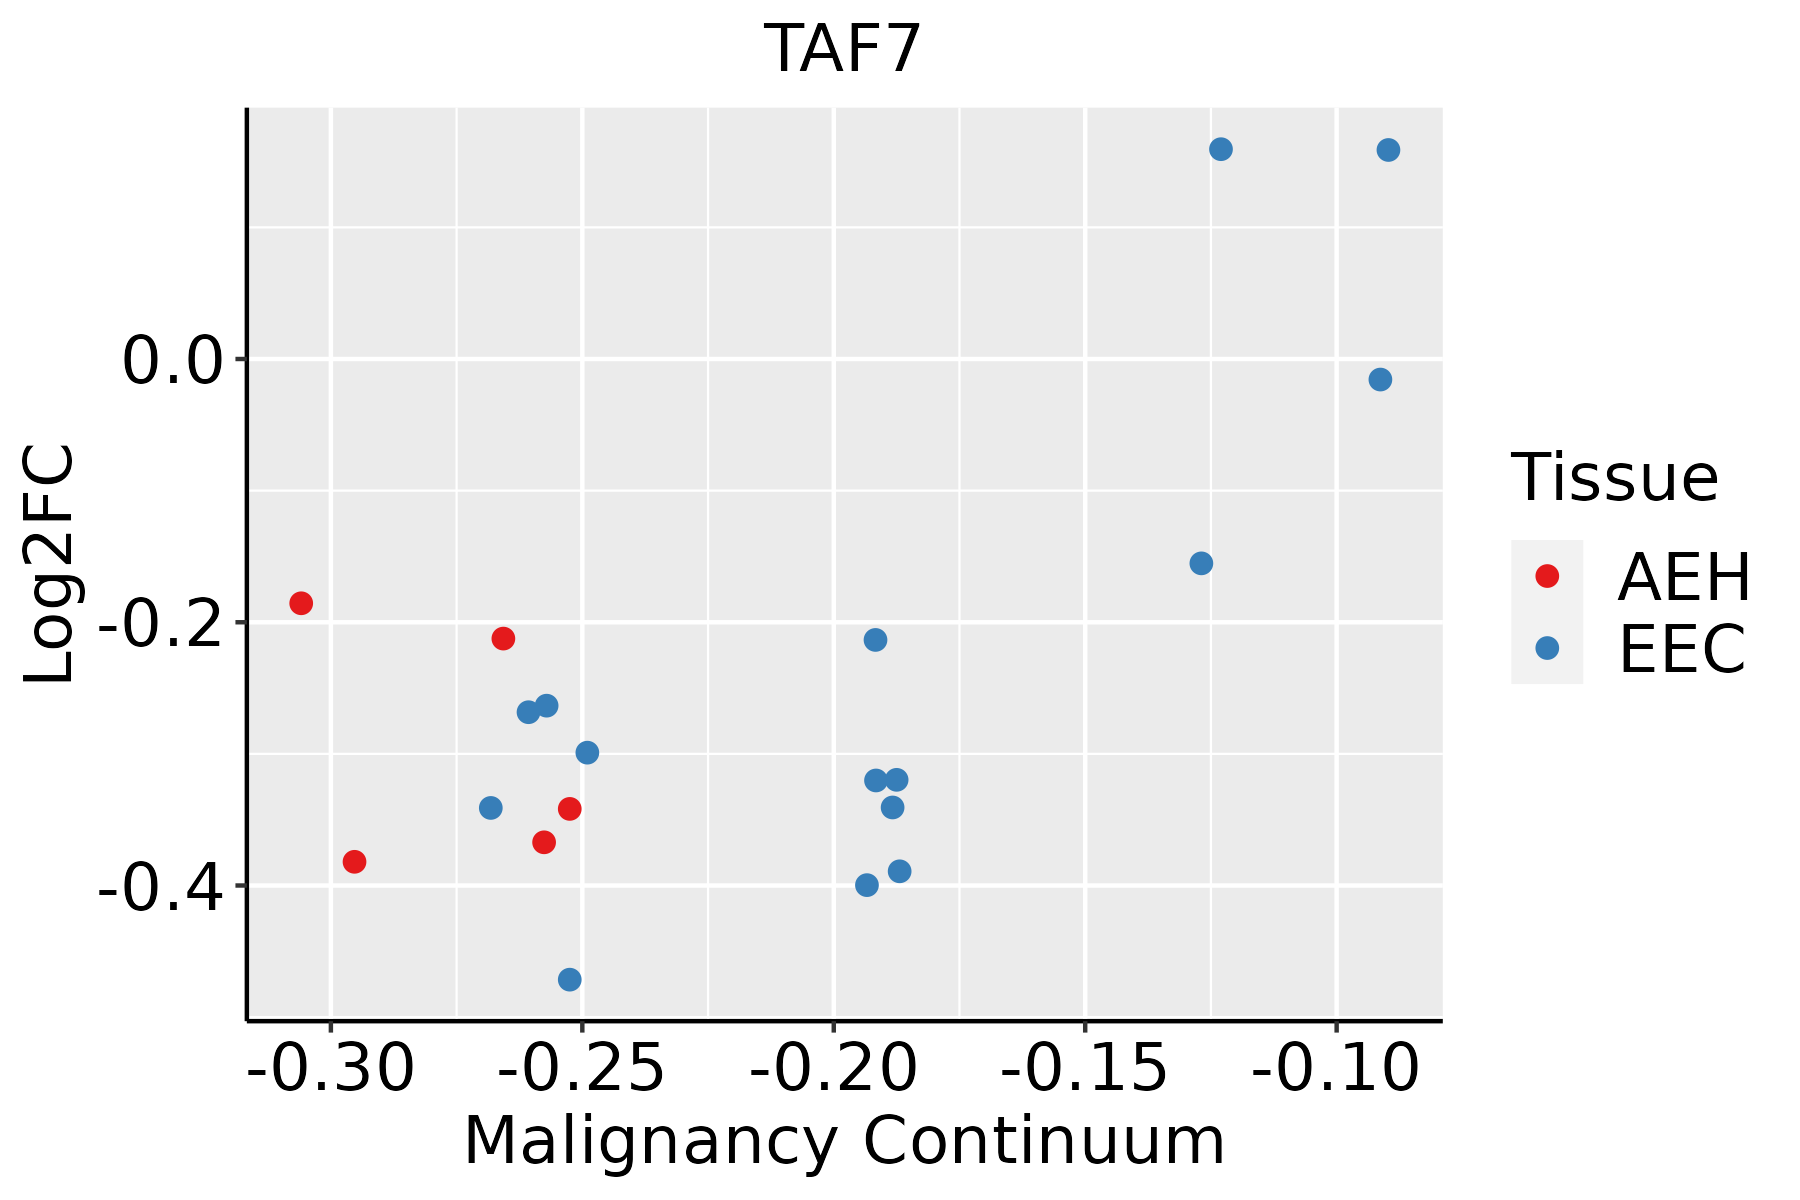 | AEH: Atypical endometrial hyperplasia |
| EEC: Endometrioid Cancer | ||
| Esophagus | 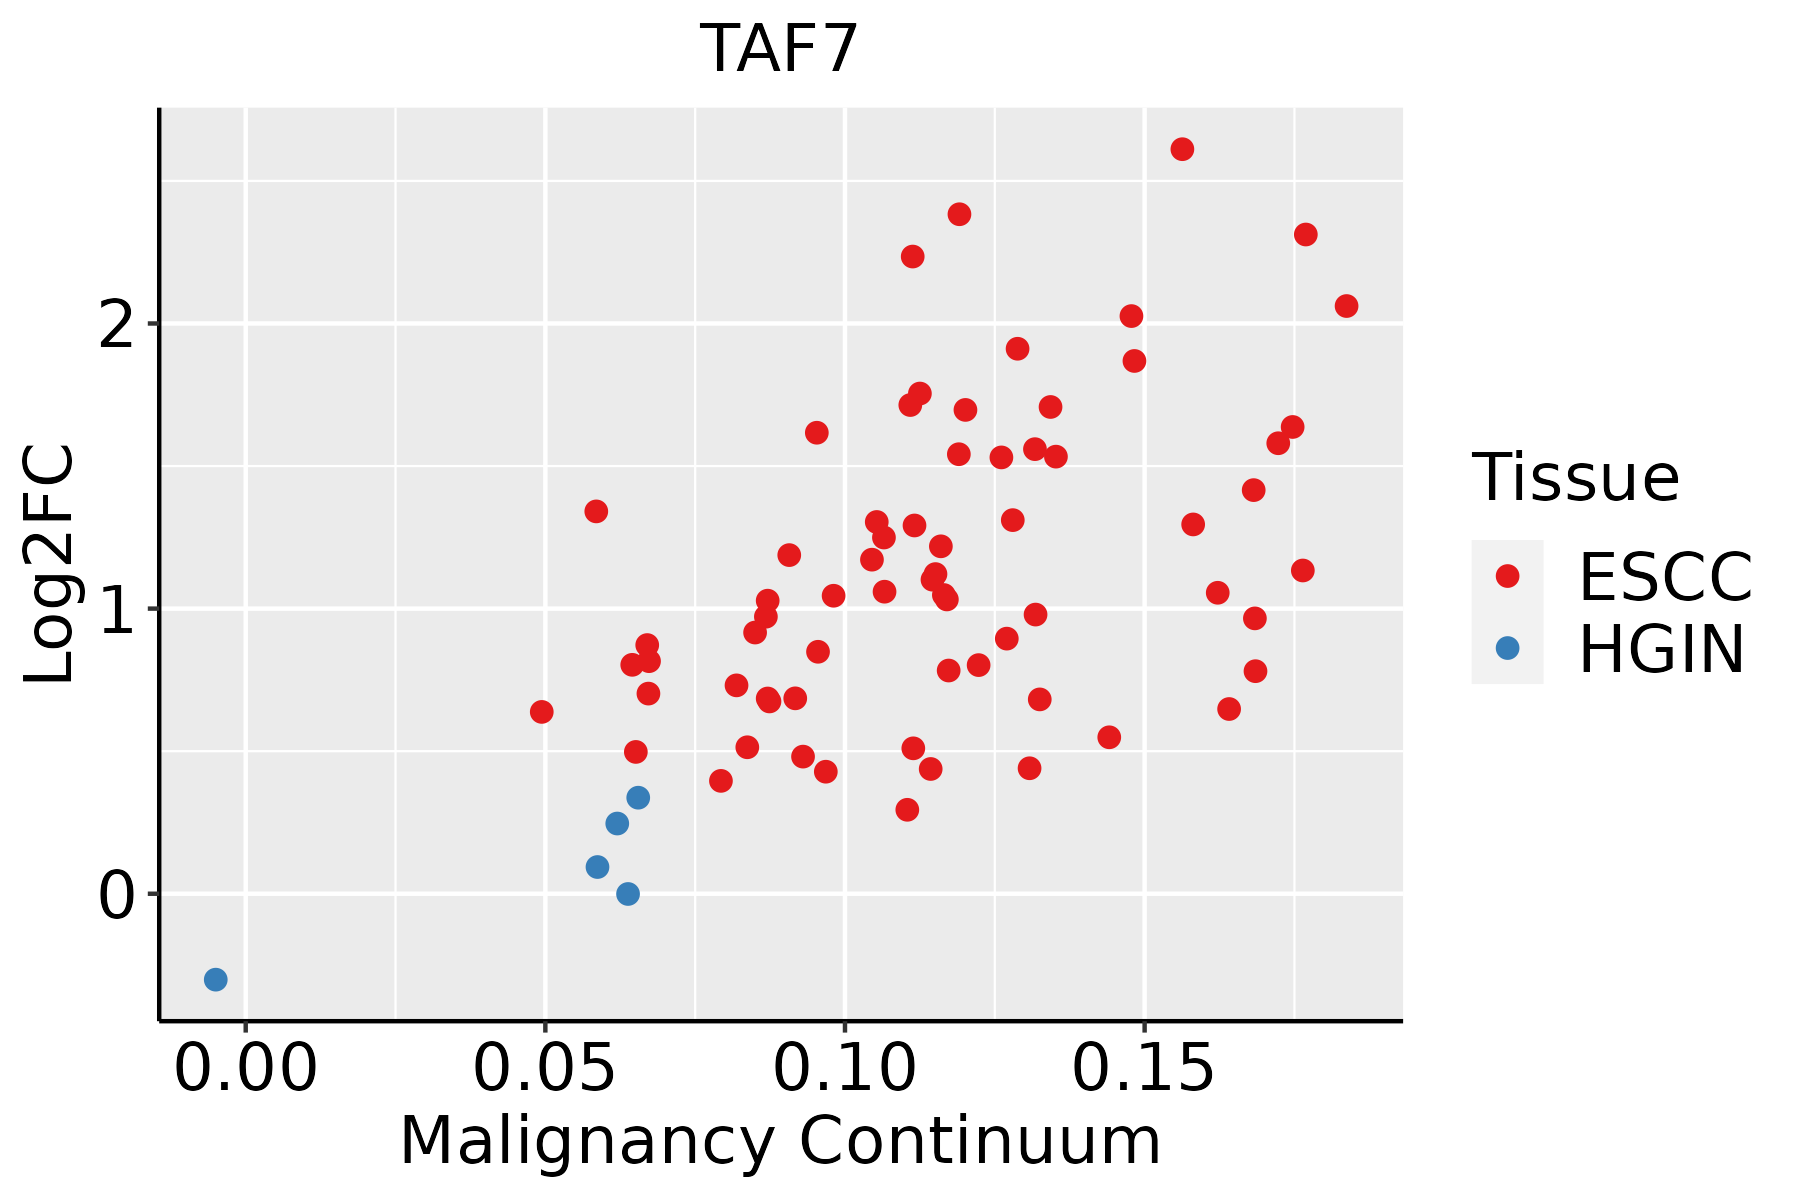 | ESCC: Esophageal squamous cell carcinoma |
| HGIN: High-grade intraepithelial neoplasias | ||
| LGIN: Low-grade intraepithelial neoplasias | ||
| Liver | 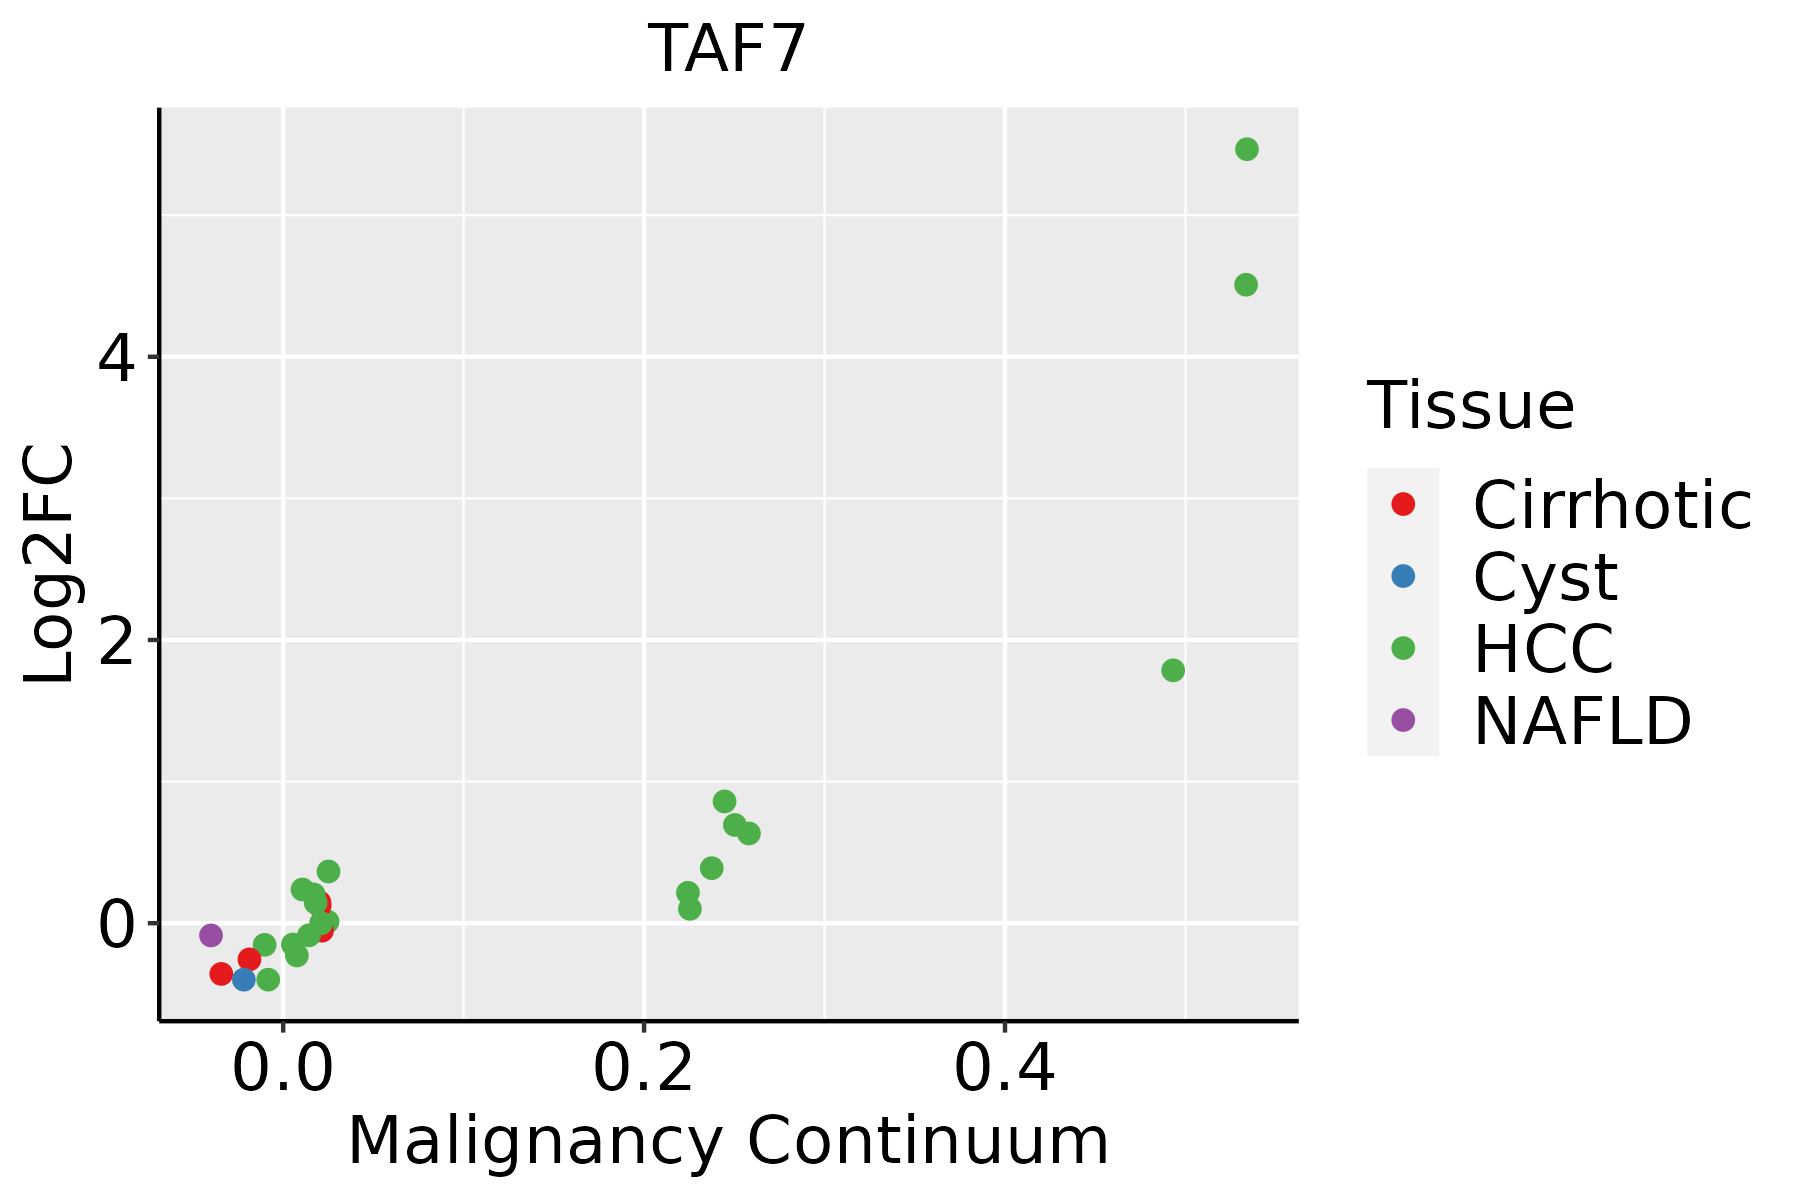 | HCC: Hepatocellular carcinoma |
| NAFLD: Non-alcoholic fatty liver disease | ||
| Lung | 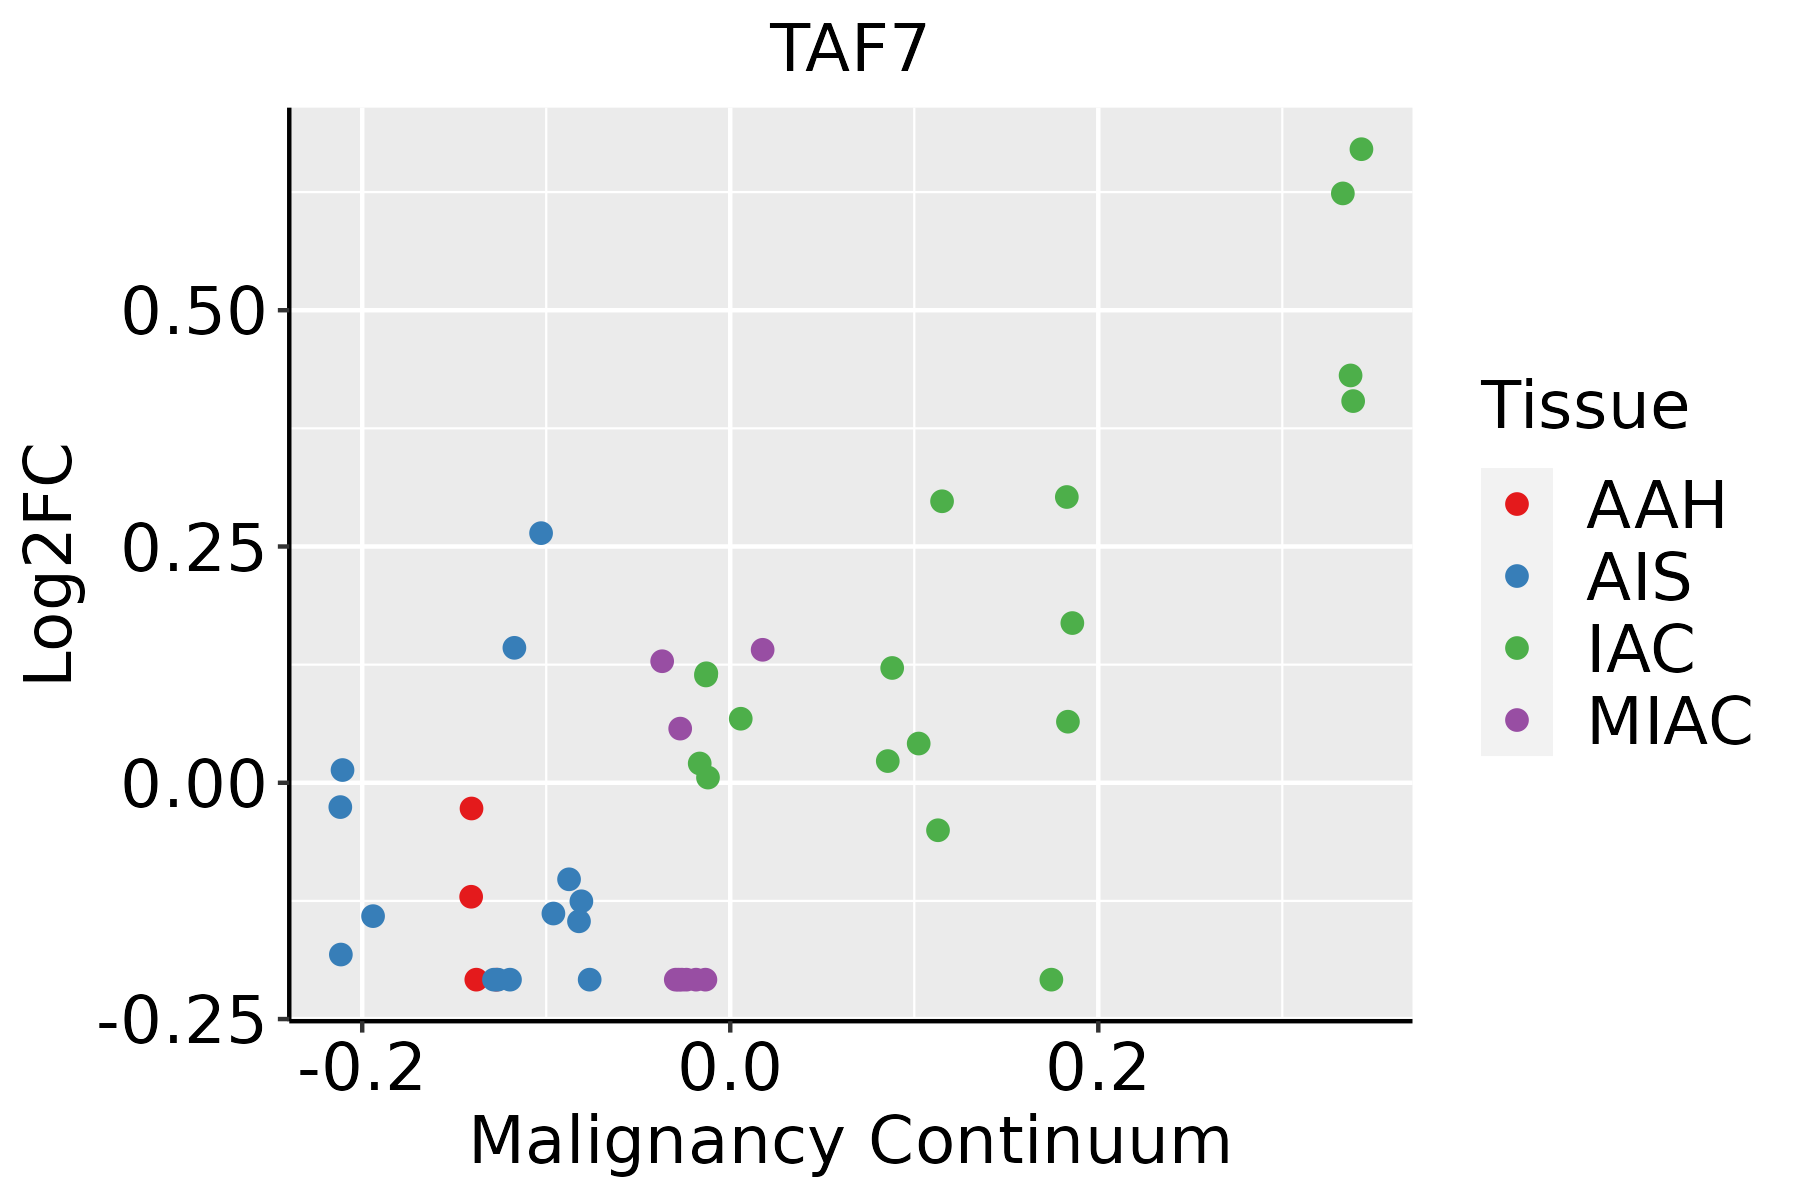 | AAH: Atypical adenomatous hyperplasia |
| AIS: Adenocarcinoma in situ | ||
| IAC: Invasive lung adenocarcinoma | ||
| MIA: Minimally invasive adenocarcinoma | ||
| Oral Cavity | 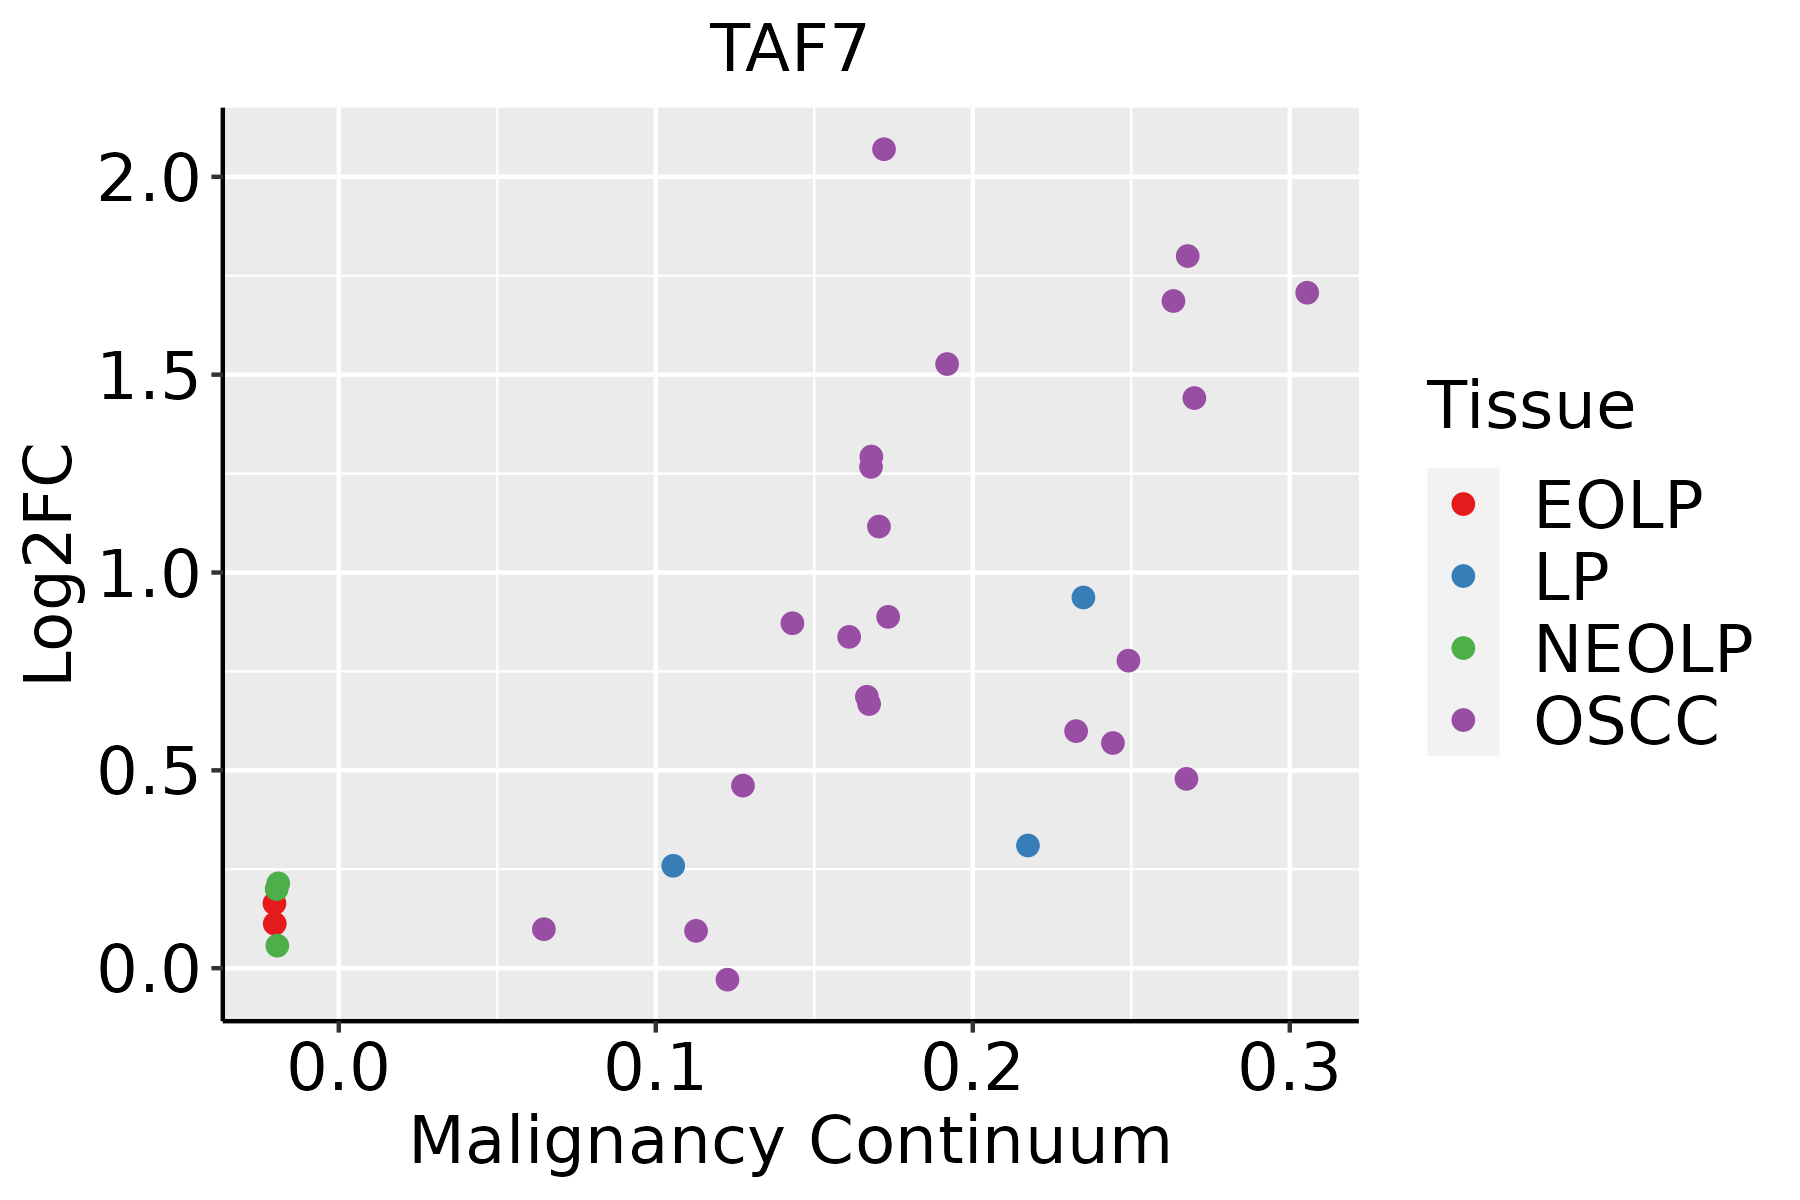 | EOLP: Erosive Oral lichen planus |
| LP: leukoplakia | ||
| NEOLP: Non-erosive oral lichen planus | ||
| OSCC: Oral squamous cell carcinoma | ||
| Prostate | 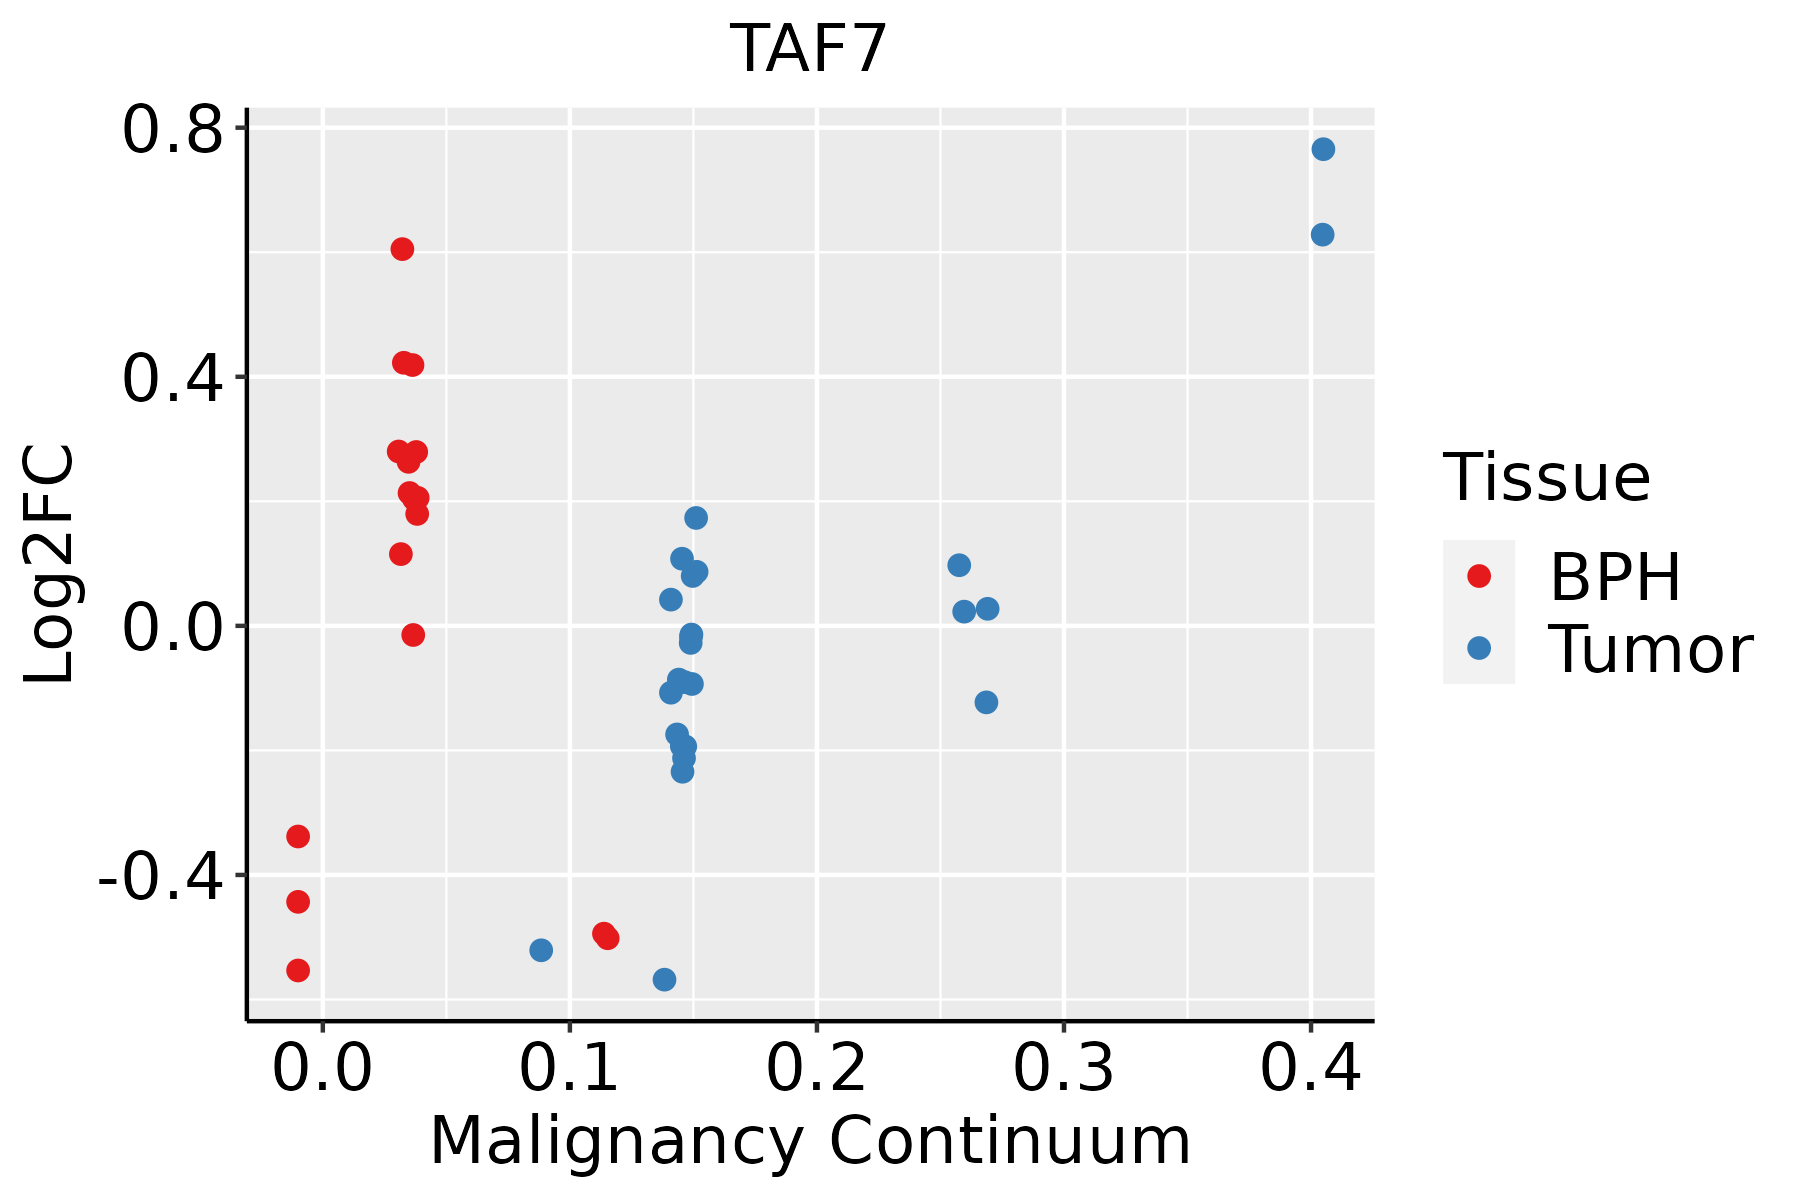 | BPH: Benign Prostatic Hyperplasia |
| Skin | 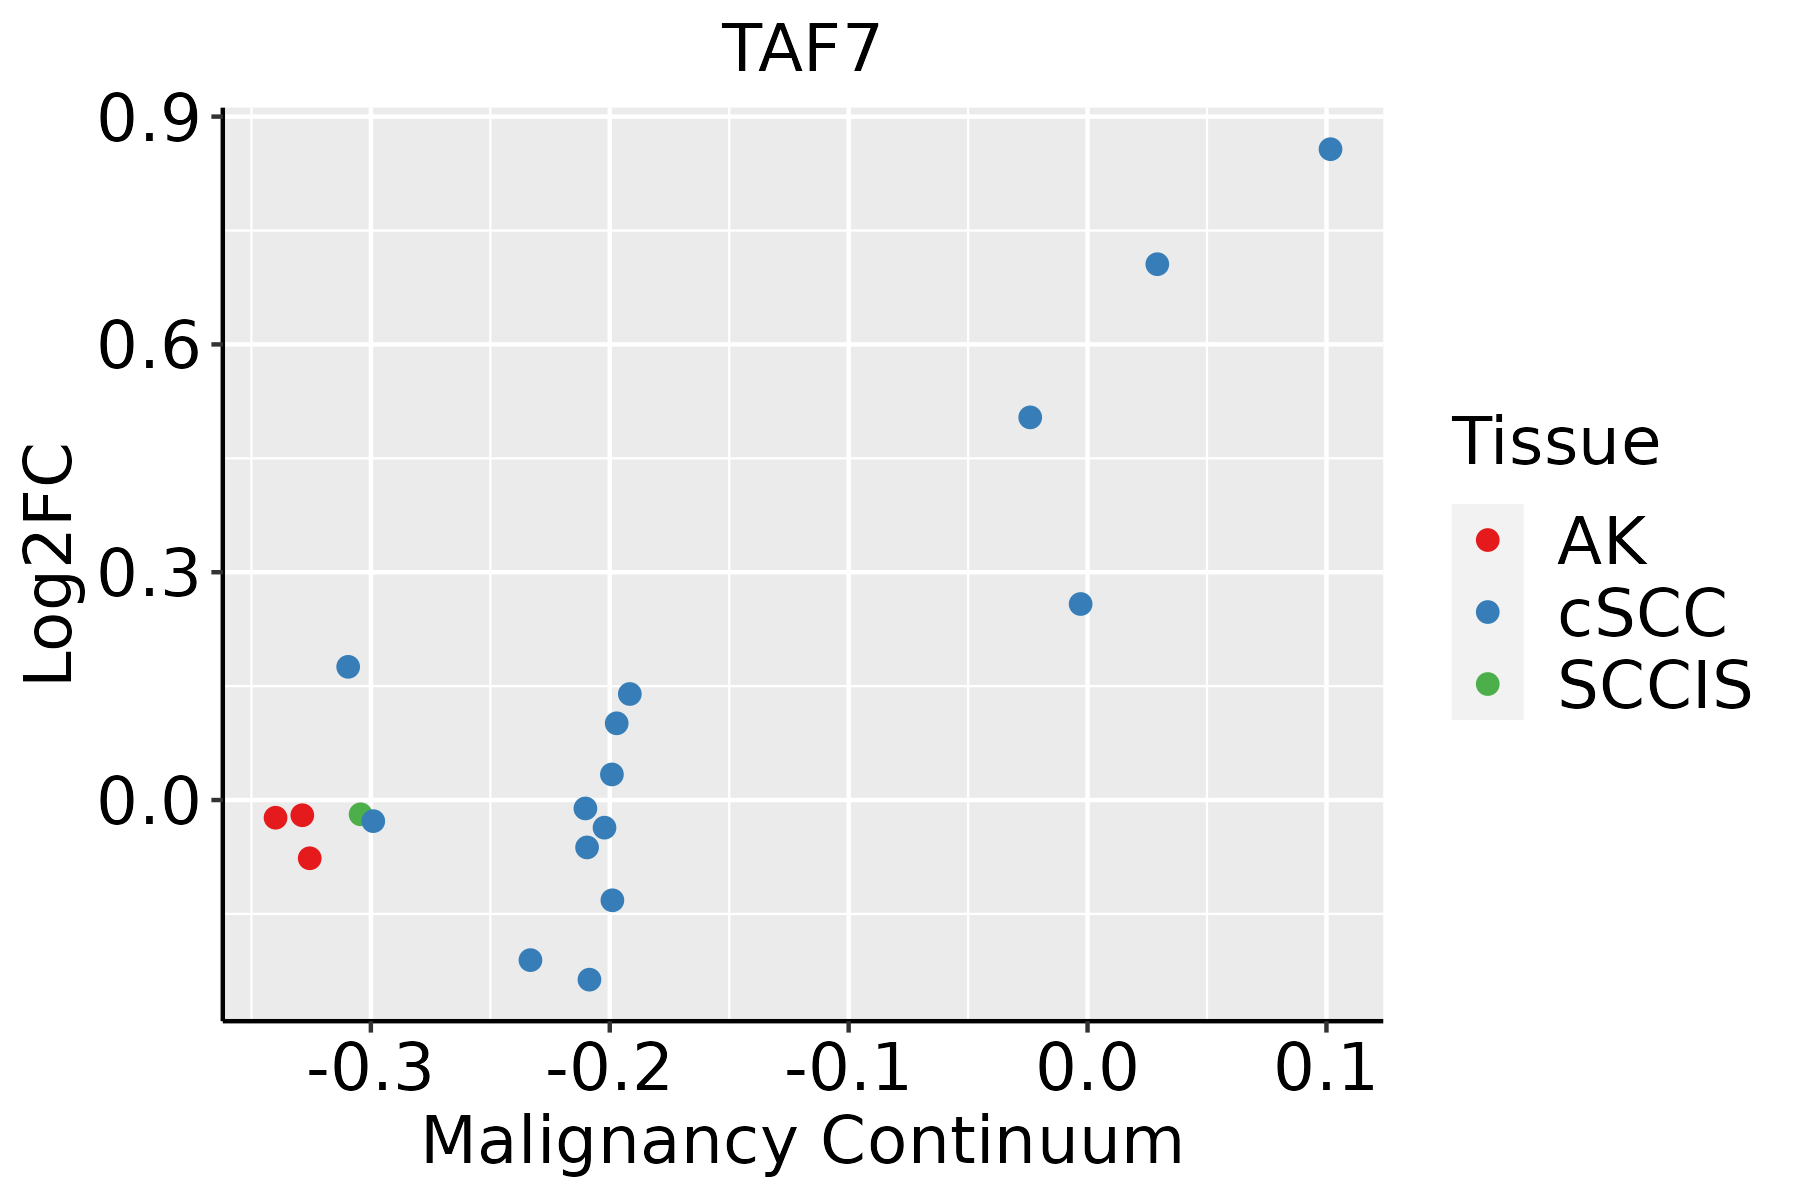 | AK: Actinic keratosis |
| cSCC: Cutaneous squamous cell carcinoma | ||
| SCCIS:squamous cell carcinoma in situ | ||
| Thyroid | 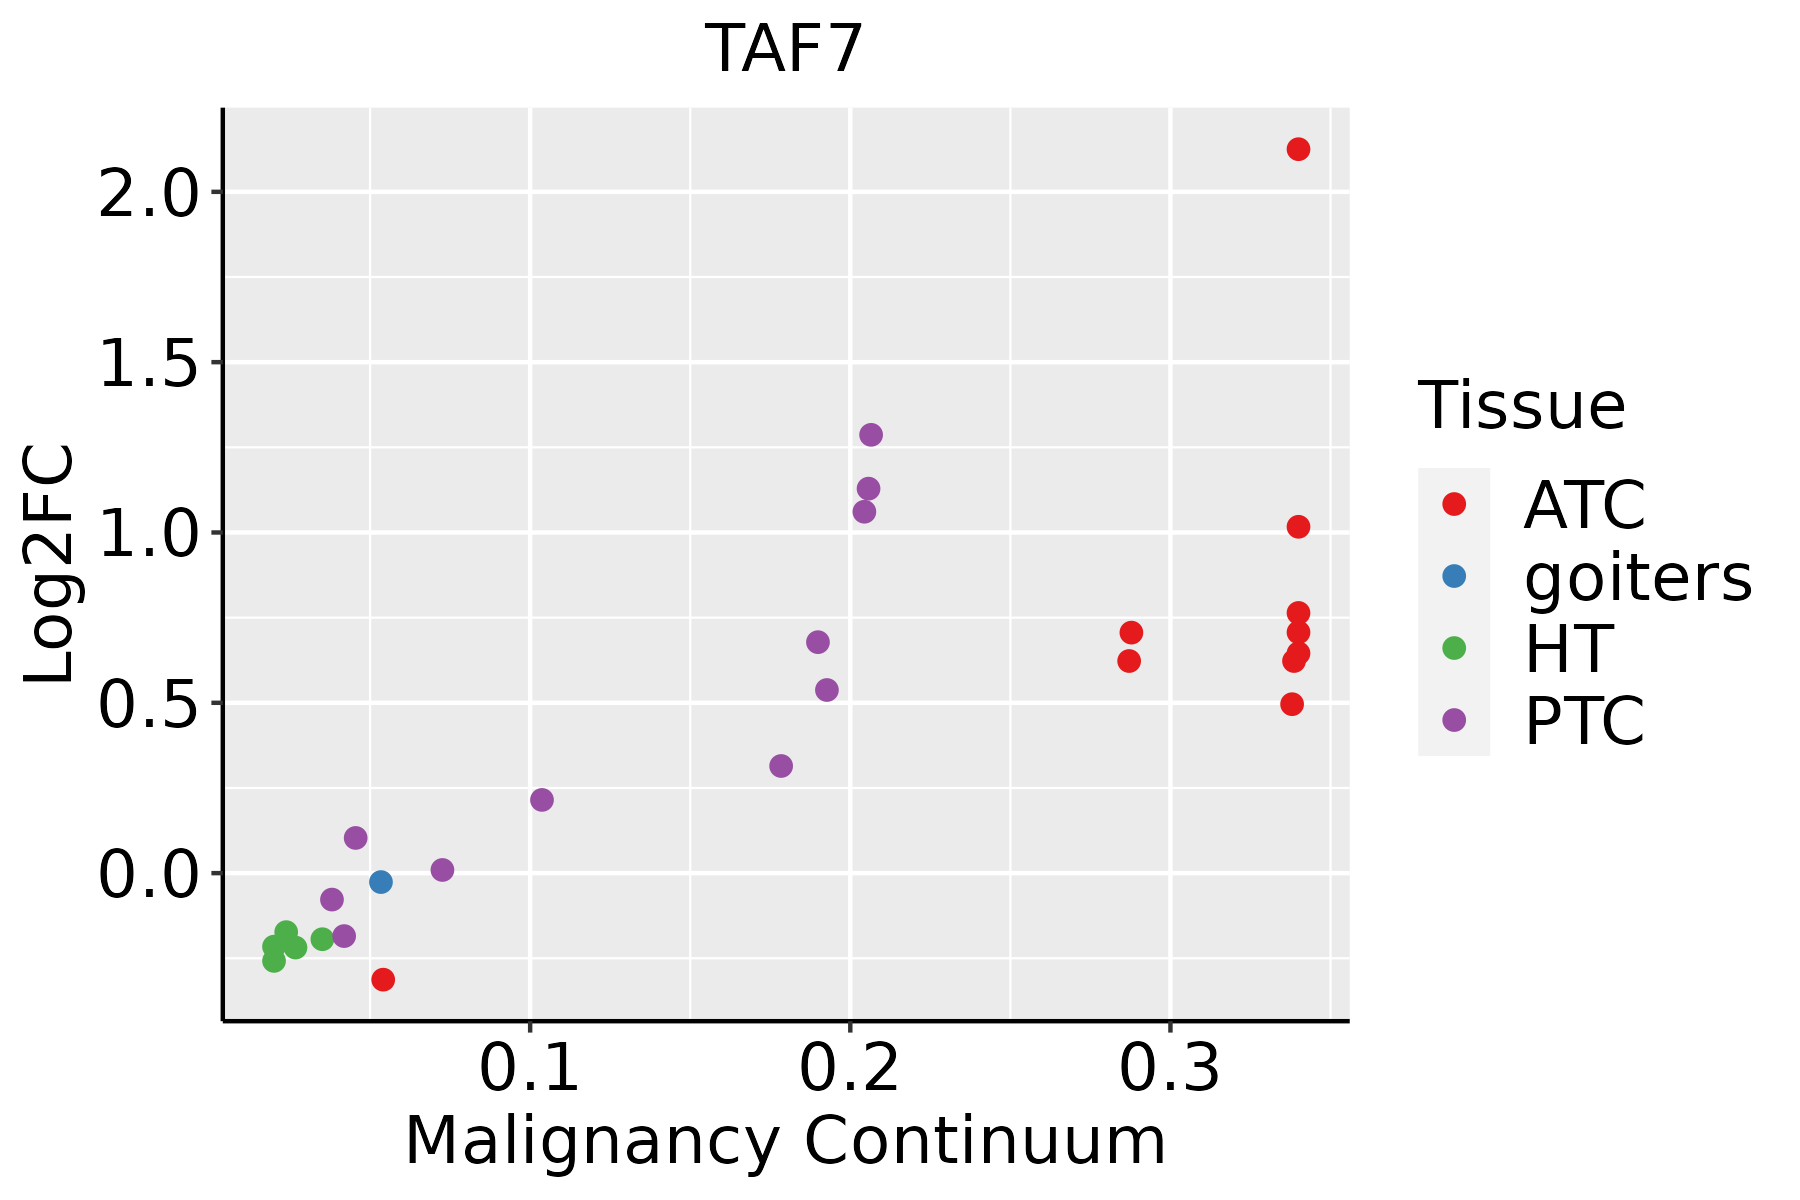 | ATC: Anaplastic thyroid cancer |
| HT: Hashimoto's thyroiditis | ||
| PTC: Papillary thyroid cancer |
| ∗log2FC in expression of this searched gene in stem-like cells from each diseased tissue sample relative to stem-like cells in normal samples in each tissue plotted against the malignancy continuum. Samples are colored based on if they are from different disease stage. |
Top |
Malignant transformation related pathway analysis |
| Find out the enriched GO biological processes and KEGG pathways involved in transition from healthy to precancer to cancer |
| Tissue | Disease Stage | Enriched GO biological Processes |
| Colorectum | AD |  |
| Colorectum | SER |  |
| Colorectum | MSS |  |
| Colorectum | MSI-H |  |
| Colorectum | FAP |  |
| ∗Top 15 enriched GO BP terms are showed in the bar plot of each disease state in each tissue. Each row represents a significant GO biological process which is colored according to the -log10(p.adjust). |
| Page: 1 2 3 4 5 6 7 8 9 |
| GO ID | Tissue | Disease Stage | Description | Gene Ratio | Bg Ratio | pvalue | p.adjust | Count |
| GO:00064698 | Lung | IAC | negative regulation of protein kinase activity | 39/2061 | 212/18723 | 8.93e-04 | 1.11e-02 | 39 |
| GO:00310564 | Lung | IAC | regulation of histone modification | 30/2061 | 152/18723 | 1.07e-03 | 1.26e-02 | 30 |
| GO:00336737 | Lung | IAC | negative regulation of kinase activity | 42/2061 | 237/18723 | 1.25e-03 | 1.44e-02 | 42 |
| GO:00305204 | Lung | IAC | intracellular estrogen receptor signaling pathway | 13/2061 | 54/18723 | 4.89e-03 | 3.78e-02 | 13 |
| GO:00165707 | Oral cavity | OSCC | histone modification | 270/7305 | 463/18723 | 1.59e-17 | 1.50e-15 | 270 |
| GO:005134820 | Oral cavity | OSCC | negative regulation of transferase activity | 165/7305 | 268/18723 | 5.02e-14 | 2.74e-12 | 165 |
| GO:00182056 | Oral cavity | OSCC | peptidyl-lysine modification | 216/7305 | 376/18723 | 2.32e-13 | 1.16e-11 | 216 |
| GO:001056320 | Oral cavity | OSCC | negative regulation of phosphorus metabolic process | 246/7305 | 442/18723 | 6.12e-13 | 2.89e-11 | 246 |
| GO:004593620 | Oral cavity | OSCC | negative regulation of phosphate metabolic process | 245/7305 | 441/18723 | 8.85e-13 | 4.09e-11 | 245 |
| GO:00435434 | Oral cavity | OSCC | protein acylation | 149/7305 | 243/18723 | 1.33e-12 | 5.80e-11 | 149 |
| GO:004232619 | Oral cavity | OSCC | negative regulation of phosphorylation | 214/7305 | 385/18723 | 2.30e-11 | 7.74e-10 | 214 |
| GO:00183944 | Oral cavity | OSCC | peptidyl-lysine acetylation | 108/7305 | 169/18723 | 4.55e-11 | 1.45e-09 | 108 |
| GO:00064734 | Oral cavity | OSCC | protein acetylation | 124/7305 | 201/18723 | 5.59e-11 | 1.74e-09 | 124 |
| GO:000193319 | Oral cavity | OSCC | negative regulation of protein phosphorylation | 191/7305 | 342/18723 | 1.58e-10 | 4.62e-09 | 191 |
| GO:003367317 | Oral cavity | OSCC | negative regulation of kinase activity | 140/7305 | 237/18723 | 2.74e-10 | 7.57e-09 | 140 |
| GO:000646918 | Oral cavity | OSCC | negative regulation of protein kinase activity | 127/7305 | 212/18723 | 5.21e-10 | 1.37e-08 | 127 |
| GO:00165734 | Oral cavity | OSCC | histone acetylation | 96/7305 | 152/18723 | 1.35e-09 | 3.29e-08 | 96 |
| GO:00183934 | Oral cavity | OSCC | internal peptidyl-lysine acetylation | 99/7305 | 158/18723 | 1.41e-09 | 3.39e-08 | 99 |
| GO:00064754 | Oral cavity | OSCC | internal protein amino acid acetylation | 100/7305 | 160/18723 | 1.43e-09 | 3.41e-08 | 100 |
| GO:004854520 | Oral cavity | OSCC | response to steroid hormone | 186/7305 | 339/18723 | 1.86e-09 | 4.42e-08 | 186 |
| Page: 1 2 3 4 5 6 7 8 9 10 11 12 13 14 15 16 17 18 19 20 21 22 |
| Pathway ID | Tissue | Disease Stage | Description | Gene Ratio | Bg Ratio | pvalue | p.adjust | qvalue | Count |
| hsa030222 | Esophagus | ESCC | Basal transcription factors | 35/4205 | 45/8465 | 1.01e-04 | 4.06e-04 | 2.08e-04 | 35 |
| hsa0302211 | Esophagus | ESCC | Basal transcription factors | 35/4205 | 45/8465 | 1.01e-04 | 4.06e-04 | 2.08e-04 | 35 |
| hsa03022 | Oral cavity | OSCC | Basal transcription factors | 28/3704 | 45/8465 | 9.53e-03 | 2.11e-02 | 1.08e-02 | 28 |
| hsa030221 | Oral cavity | OSCC | Basal transcription factors | 28/3704 | 45/8465 | 9.53e-03 | 2.11e-02 | 1.08e-02 | 28 |
| Page: 1 |
Top |
Cell-cell communication analysis |
| Identification of potential cell-cell interactions between two cell types and their ligand-receptor pairs for different disease states |
| Ligand | Receptor | LRpair | Pathway | Tissue | Disease Stage |
| Page: 1 |
Top |
Single-cell gene regulatory network inference analysis |
| Find out the significant the regulons (TFs) and the target genes of each regulon across cell types for different disease states |
| TF | Cell Type | Tissue | Disease Stage | Target Gene | RSS | Regulon Activity |
| TAF7 | CD8TEXINT | Esophagus | ADJ | RGMB-AS1,CASP10,ECE1, etc. | 2.57e-01 |  |
| TAF7 | CD8TEXINT | Esophagus | ESCC | RGMB-AS1,CASP10,ECE1, etc. | 1.58e-01 |  |
| TAF7 | LUM | Prostate | Tumor | HSPB1,HSP90AB1,ARGLU1, etc. | 7.43e-01 |  |
| TAF7 | PLA | Thyroid | Healthy | DNAJB1,HSPA6,DEDD2, etc. | 6.47e-01 |  |
| ∗The dot plots of a searched regulon are shown for all cell subpopulations in each disease state of each tissue based on the regulon specific score inferred using pySCENIC and by calculating the average expression. |
| Page: 1 |
Top |
Somatic mutation of malignant transformation related genes |
| Annotation of somatic variants for genes involved in malignant transformation |
| Hugo Symbol | Variant Class | Variant Classification | dbSNP RS | HGVSc | HGVSp | HGVSp Short | SWISSPROT | BIOTYPE | SIFT | PolyPhen | Tumor Sample Barcode | Tissue | Histology | Sex | Age | Stage | Therapy Types | Drugs | Outcome |
| TAF7 | SNV | Missense_Mutation | c.539N>C | p.Arg180Pro | p.R180P | Q15545 | protein_coding | deleterious(0) | possibly_damaging(0.851) | TCGA-AR-A1AI-01 | Breast | breast invasive carcinoma | Female | <65 | I/II | Chemotherapy | cytoxan | PD | |
| TAF7 | insertion | In_Frame_Ins | novel | c.924_925insTCTGTTTTTCACTTTATAGTGTATCTTGTTCTTTCATGGTTG | p.Lys308_Val309insSerValPheHisPheIleValTyrLeuValLeuSerTrpLeu | p.K308_V309insSVFHFIVYLVLSWL | Q15545 | protein_coding | TCGA-A8-A07U-01 | Breast | breast invasive carcinoma | Female | >=65 | III/IV | Chemotherapy | 5-fluorouracil | SD | ||
| TAF7 | SNV | Missense_Mutation | c.928N>A | p.Glu310Lys | p.E310K | Q15545 | protein_coding | deleterious(0.02) | probably_damaging(0.985) | TCGA-AA-A010-01 | Colorectum | colon adenocarcinoma | Female | <65 | I/II | Chemotherapy | folinic | CR | |
| TAF7 | SNV | Missense_Mutation | c.674N>C | p.Asp225Ala | p.D225A | Q15545 | protein_coding | deleterious(0.01) | probably_damaging(0.996) | TCGA-CA-6717-01 | Colorectum | colon adenocarcinoma | Male | <65 | I/II | Chemotherapy | oxaliplatin | CR | |
| TAF7 | SNV | Missense_Mutation | novel | c.750G>T | p.Glu250Asp | p.E250D | Q15545 | protein_coding | tolerated(0.17) | probably_damaging(0.978) | TCGA-AG-A002-01 | Colorectum | rectum adenocarcinoma | Male | <65 | I/II | Unknown | Unknown | SD |
| TAF7 | deletion | Frame_Shift_Del | rs761173015 | c.250delN | p.Thr84LeufsTer57 | p.T84Lfs*57 | Q15545 | protein_coding | TCGA-G4-6302-01 | Colorectum | colon adenocarcinoma | Female | >=65 | I/II | Unknown | Unknown | SD | ||
| TAF7 | deletion | Frame_Shift_Del | rs761173015 | c.250delN | p.Thr84LeufsTer57 | p.T84Lfs*57 | Q15545 | protein_coding | TCGA-G4-6320-01 | Colorectum | colon adenocarcinoma | Male | >=65 | III/IV | Chemotherapy | oxaliplatin | SD | ||
| TAF7 | SNV | Missense_Mutation | c.403G>A | p.Gly135Arg | p.G135R | Q15545 | protein_coding | deleterious(0.02) | probably_damaging(1) | TCGA-A5-A2K3-01 | Endometrium | uterine corpus endometrioid carcinoma | Female | >=65 | I/II | Chemotherapy | carboplatin | SD | |
| TAF7 | SNV | Missense_Mutation | novel | c.742G>T | p.Asp248Tyr | p.D248Y | Q15545 | protein_coding | tolerated(0.24) | probably_damaging(0.915) | TCGA-AP-A0LM-01 | Endometrium | uterine corpus endometrioid carcinoma | Female | <65 | III/IV | Chemotherapy | cisplatin | SD |
| TAF7 | SNV | Missense_Mutation | novel | c.375C>G | p.Asp125Glu | p.D125E | Q15545 | protein_coding | tolerated(1) | benign(0.047) | TCGA-AP-A0LM-01 | Endometrium | uterine corpus endometrioid carcinoma | Female | <65 | III/IV | Chemotherapy | cisplatin | SD |
| Page: 1 2 3 4 |
Top |
Related drugs of malignant transformation related genes |
| Identification of chemicals and drugs interact with genes involved in malignant transfromation |
| (DGIdb 4.0) |
| Entrez ID | Symbol | Category | Interaction Types | Drug Claim Name | Drug Name | PMIDs |
| Page: 1 |

Copyright 2023-Present -The University of Texas Health Science Center at Houston |