
|
|||||
|
 | |
| |
| |
| |
| |
| |
|
Gene: STX8 |
Gene summary for STX8 |
| Gene information | Species | Human | Gene symbol | STX8 | Gene ID | 9482 |
| Gene name | syntaxin 8 | |
| Gene Alias | CARB | |
| Cytomap | 17p13.1 | |
| Gene Type | protein-coding | GO ID | GO:0002376 | UniProtAcc | Q9UNK0 |
Top |
Malignant transformation analysis |
| Identification of the aberrant gene expression in precancerous and cancerous lesions by comparing the gene expression of stem-like cells in diseased tissues with normal stem cells |
| Entrez ID | Symbol | Replicates | Species | Organ | Tissue | Adj P-value | Log2FC | Malignancy |
| 9482 | STX8 | HTA11_3410_2000001011 | Human | Colorectum | AD | 6.09e-04 | -2.61e-01 | 0.0155 |
| 9482 | STX8 | HTA11_99999970781_79442 | Human | Colorectum | MSS | 3.24e-02 | -2.74e-01 | 0.294 |
| 9482 | STX8 | HTA11_99999971662_82457 | Human | Colorectum | MSS | 3.64e-03 | -3.57e-01 | 0.3859 |
| 9482 | STX8 | HTA11_99999973899_84307 | Human | Colorectum | MSS | 8.19e-03 | -3.80e-01 | 0.2585 |
| 9482 | STX8 | HTA11_99999974143_84620 | Human | Colorectum | MSS | 8.38e-03 | -3.07e-01 | 0.3005 |
| 9482 | STX8 | A015-C-203 | Human | Colorectum | FAP | 1.67e-21 | -4.15e-01 | -0.1294 |
| 9482 | STX8 | A015-C-204 | Human | Colorectum | FAP | 1.41e-04 | -3.34e-01 | -0.0228 |
| 9482 | STX8 | A014-C-040 | Human | Colorectum | FAP | 3.83e-04 | -5.28e-01 | -0.1184 |
| 9482 | STX8 | A002-C-201 | Human | Colorectum | FAP | 3.05e-09 | -3.17e-01 | 0.0324 |
| 9482 | STX8 | A001-C-119 | Human | Colorectum | FAP | 1.11e-03 | -4.41e-02 | -0.1557 |
| 9482 | STX8 | A001-C-108 | Human | Colorectum | FAP | 7.68e-12 | -2.86e-01 | -0.0272 |
| 9482 | STX8 | A002-C-205 | Human | Colorectum | FAP | 5.27e-19 | -4.35e-01 | -0.1236 |
| 9482 | STX8 | A015-C-005 | Human | Colorectum | FAP | 1.25e-02 | -3.00e-01 | -0.0336 |
| 9482 | STX8 | A015-C-006 | Human | Colorectum | FAP | 9.70e-13 | -5.36e-01 | -0.0994 |
| 9482 | STX8 | A015-C-106 | Human | Colorectum | FAP | 1.56e-10 | -2.44e-01 | -0.0511 |
| 9482 | STX8 | A002-C-114 | Human | Colorectum | FAP | 8.63e-18 | -4.65e-01 | -0.1561 |
| 9482 | STX8 | A015-C-104 | Human | Colorectum | FAP | 9.95e-24 | -4.63e-01 | -0.1899 |
| 9482 | STX8 | A001-C-014 | Human | Colorectum | FAP | 3.07e-10 | -3.22e-01 | 0.0135 |
| 9482 | STX8 | A002-C-016 | Human | Colorectum | FAP | 1.61e-15 | -4.05e-01 | 0.0521 |
| 9482 | STX8 | A015-C-002 | Human | Colorectum | FAP | 7.85e-13 | -6.14e-01 | -0.0763 |
| Page: 1 2 3 4 5 6 7 8 |
| Tissue | Expression Dynamics | Abbreviation |
| Colorectum (GSE201348) |  | FAP: Familial adenomatous polyposis |
| CRC: Colorectal cancer | ||
| Colorectum (HTA11) |  | AD: Adenomas |
| SER: Sessile serrated lesions | ||
| MSI-H: Microsatellite-high colorectal cancer | ||
| MSS: Microsatellite stable colorectal cancer | ||
| Esophagus | 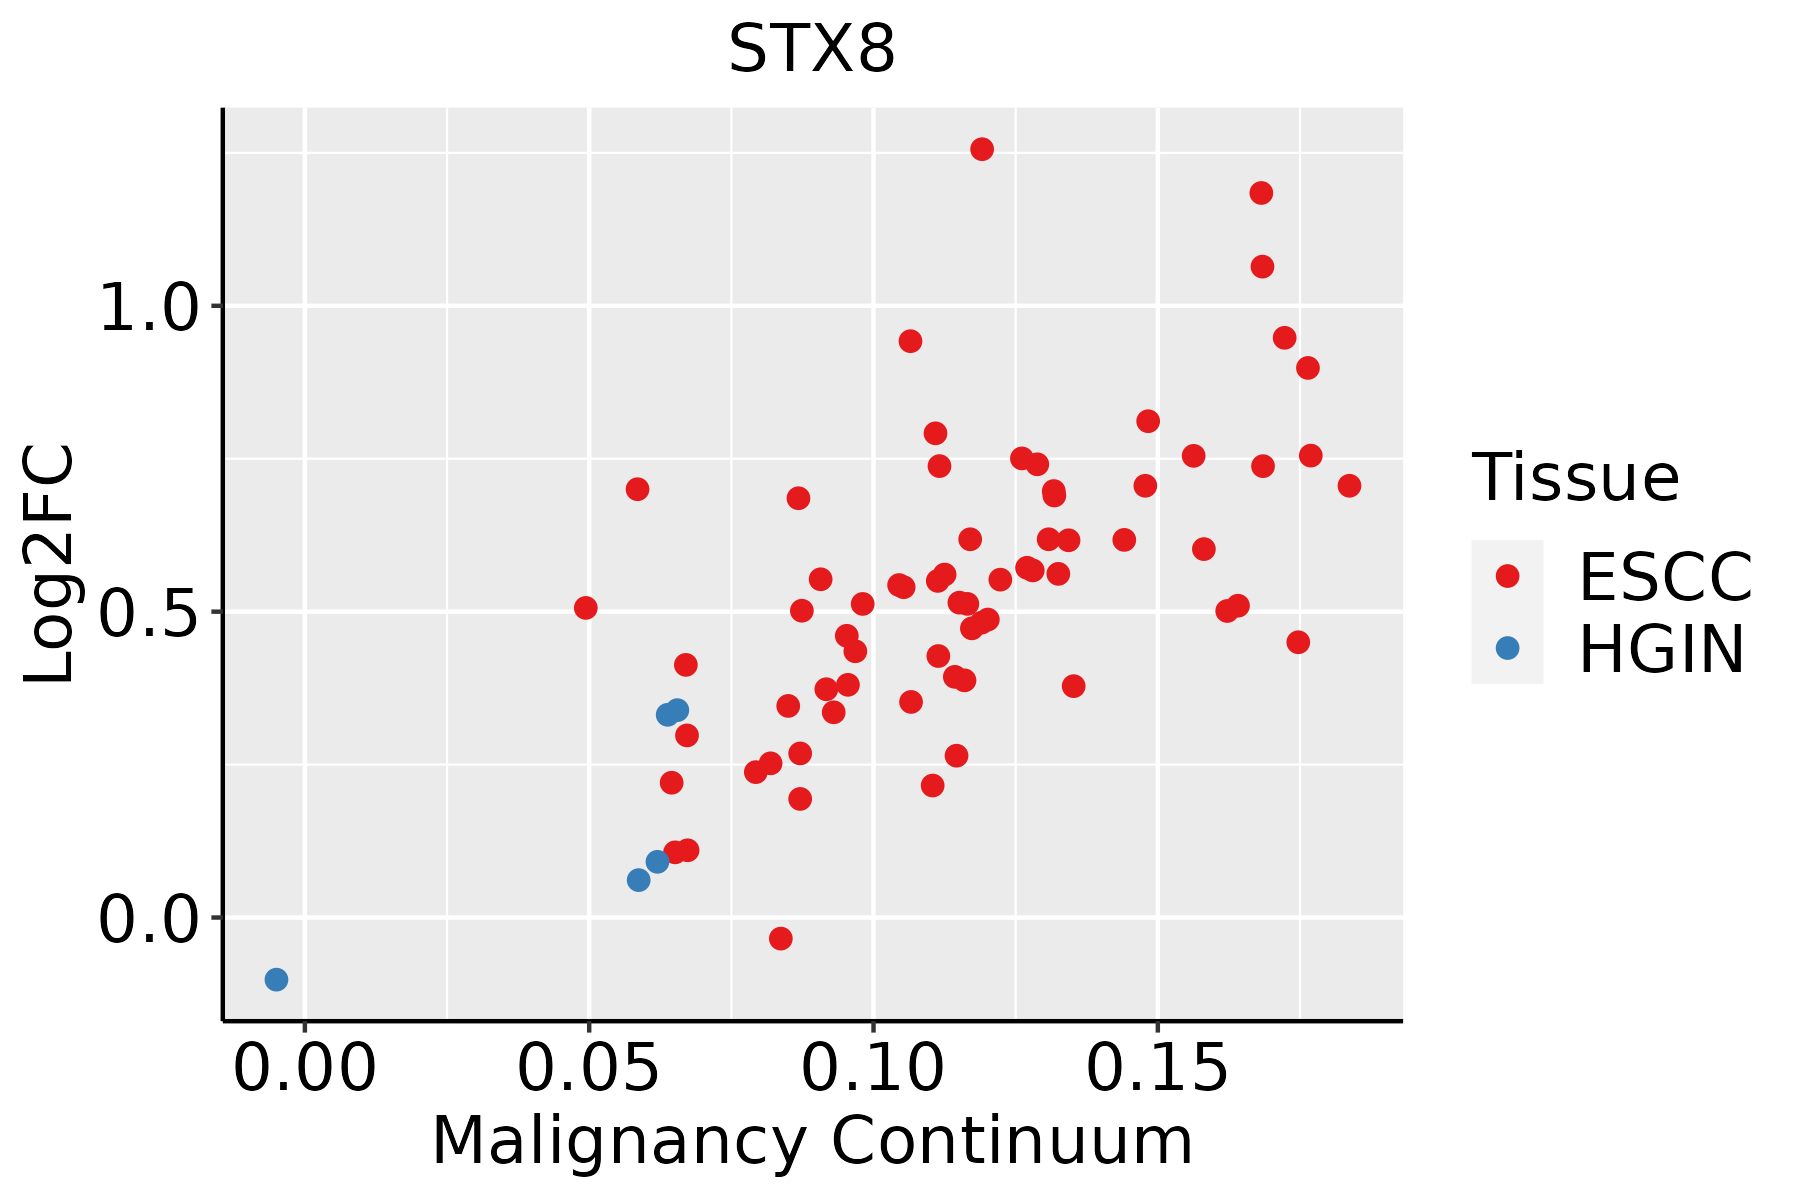 | ESCC: Esophageal squamous cell carcinoma |
| HGIN: High-grade intraepithelial neoplasias | ||
| LGIN: Low-grade intraepithelial neoplasias | ||
| Lung | 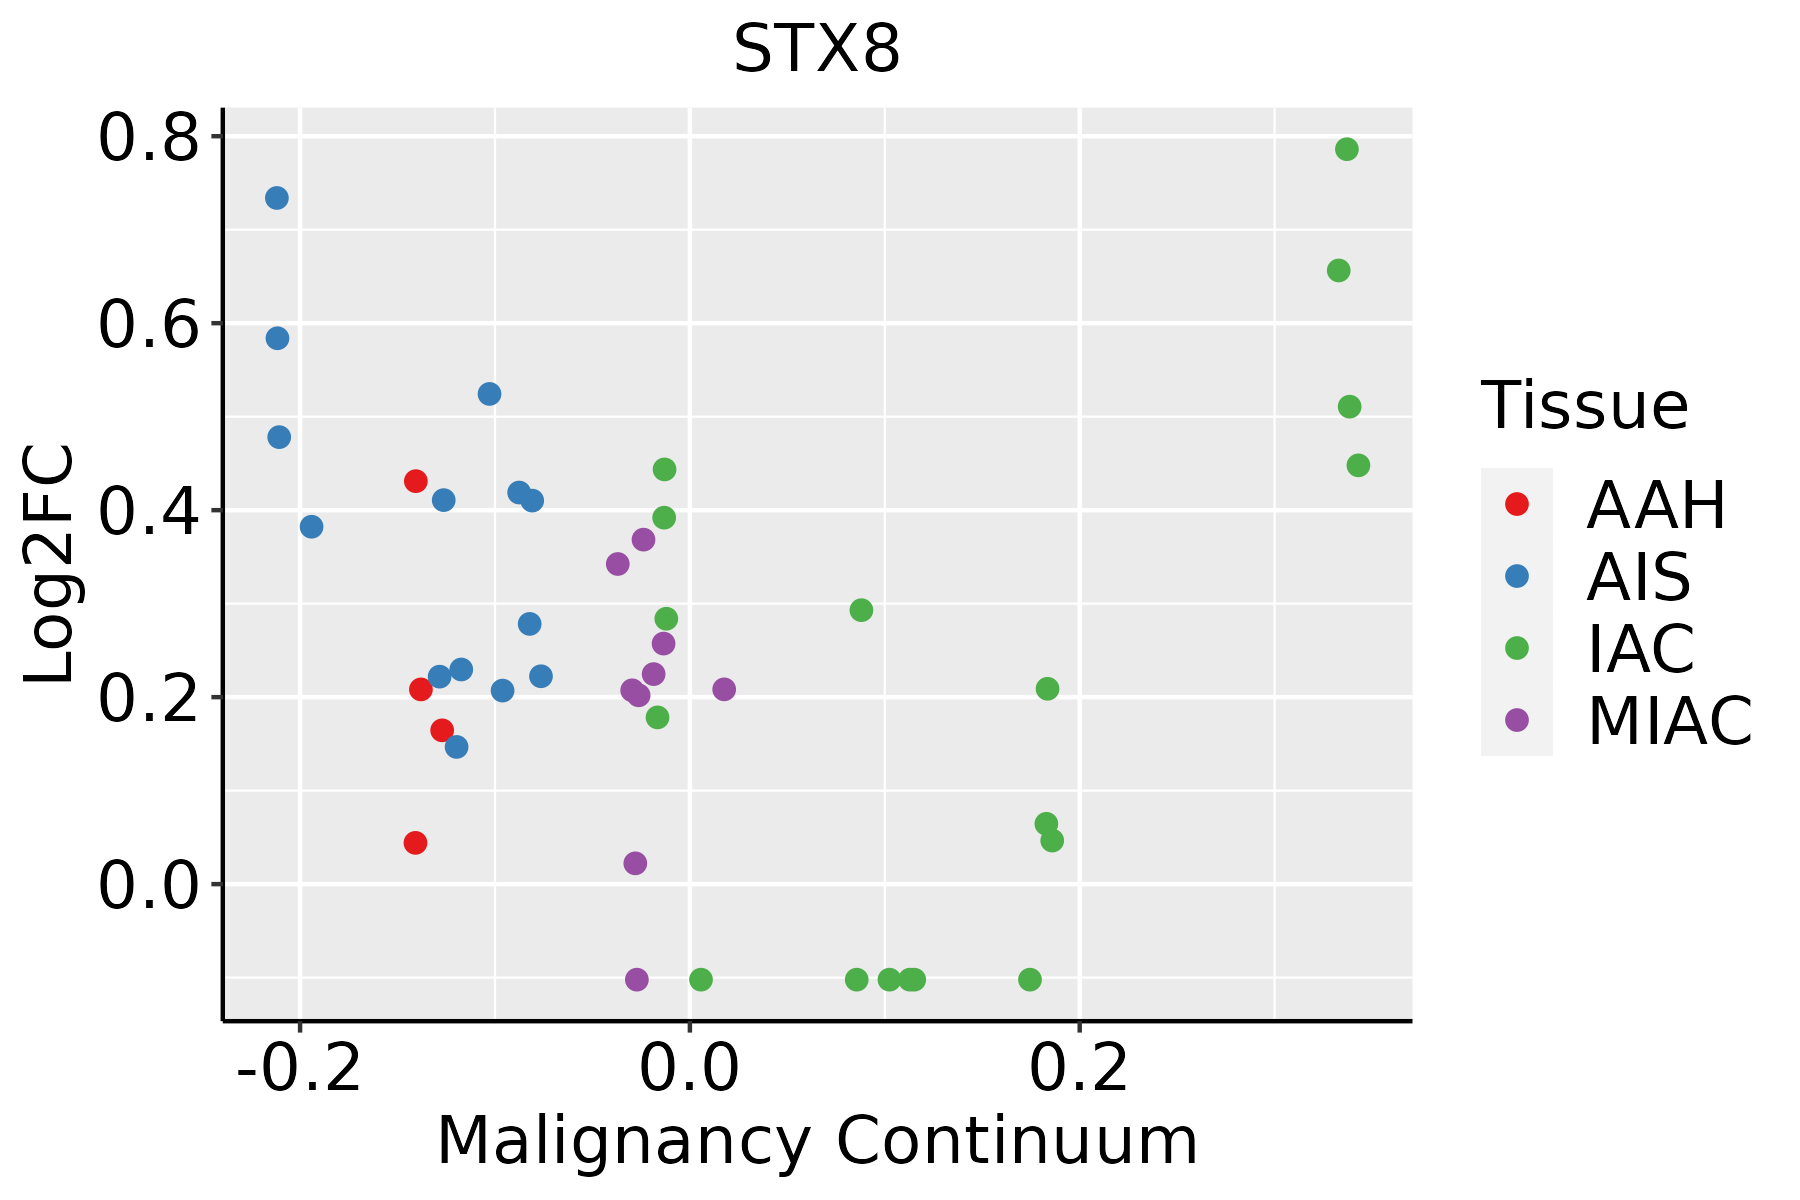 | AAH: Atypical adenomatous hyperplasia |
| AIS: Adenocarcinoma in situ | ||
| IAC: Invasive lung adenocarcinoma | ||
| MIA: Minimally invasive adenocarcinoma | ||
| Oral Cavity | 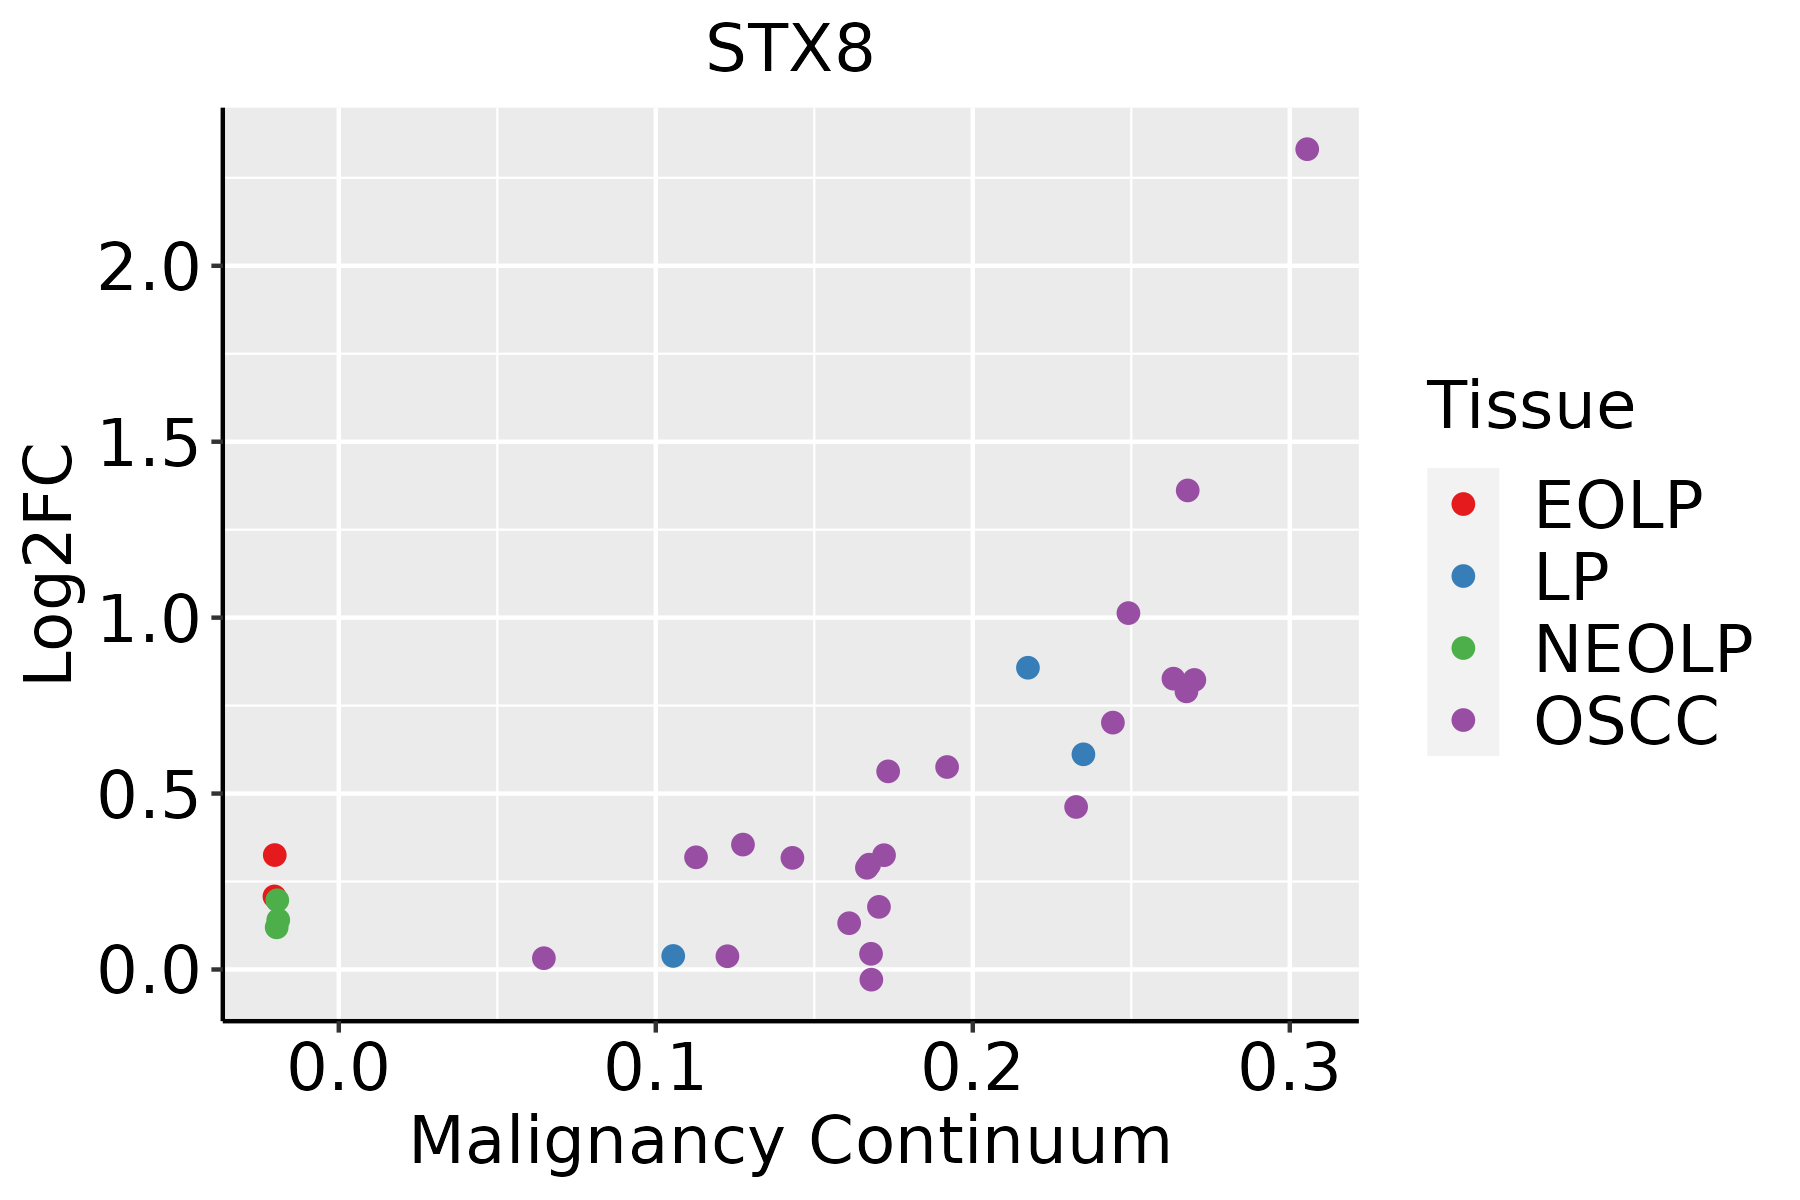 | EOLP: Erosive Oral lichen planus |
| LP: leukoplakia | ||
| NEOLP: Non-erosive oral lichen planus | ||
| OSCC: Oral squamous cell carcinoma | ||
| Skin | 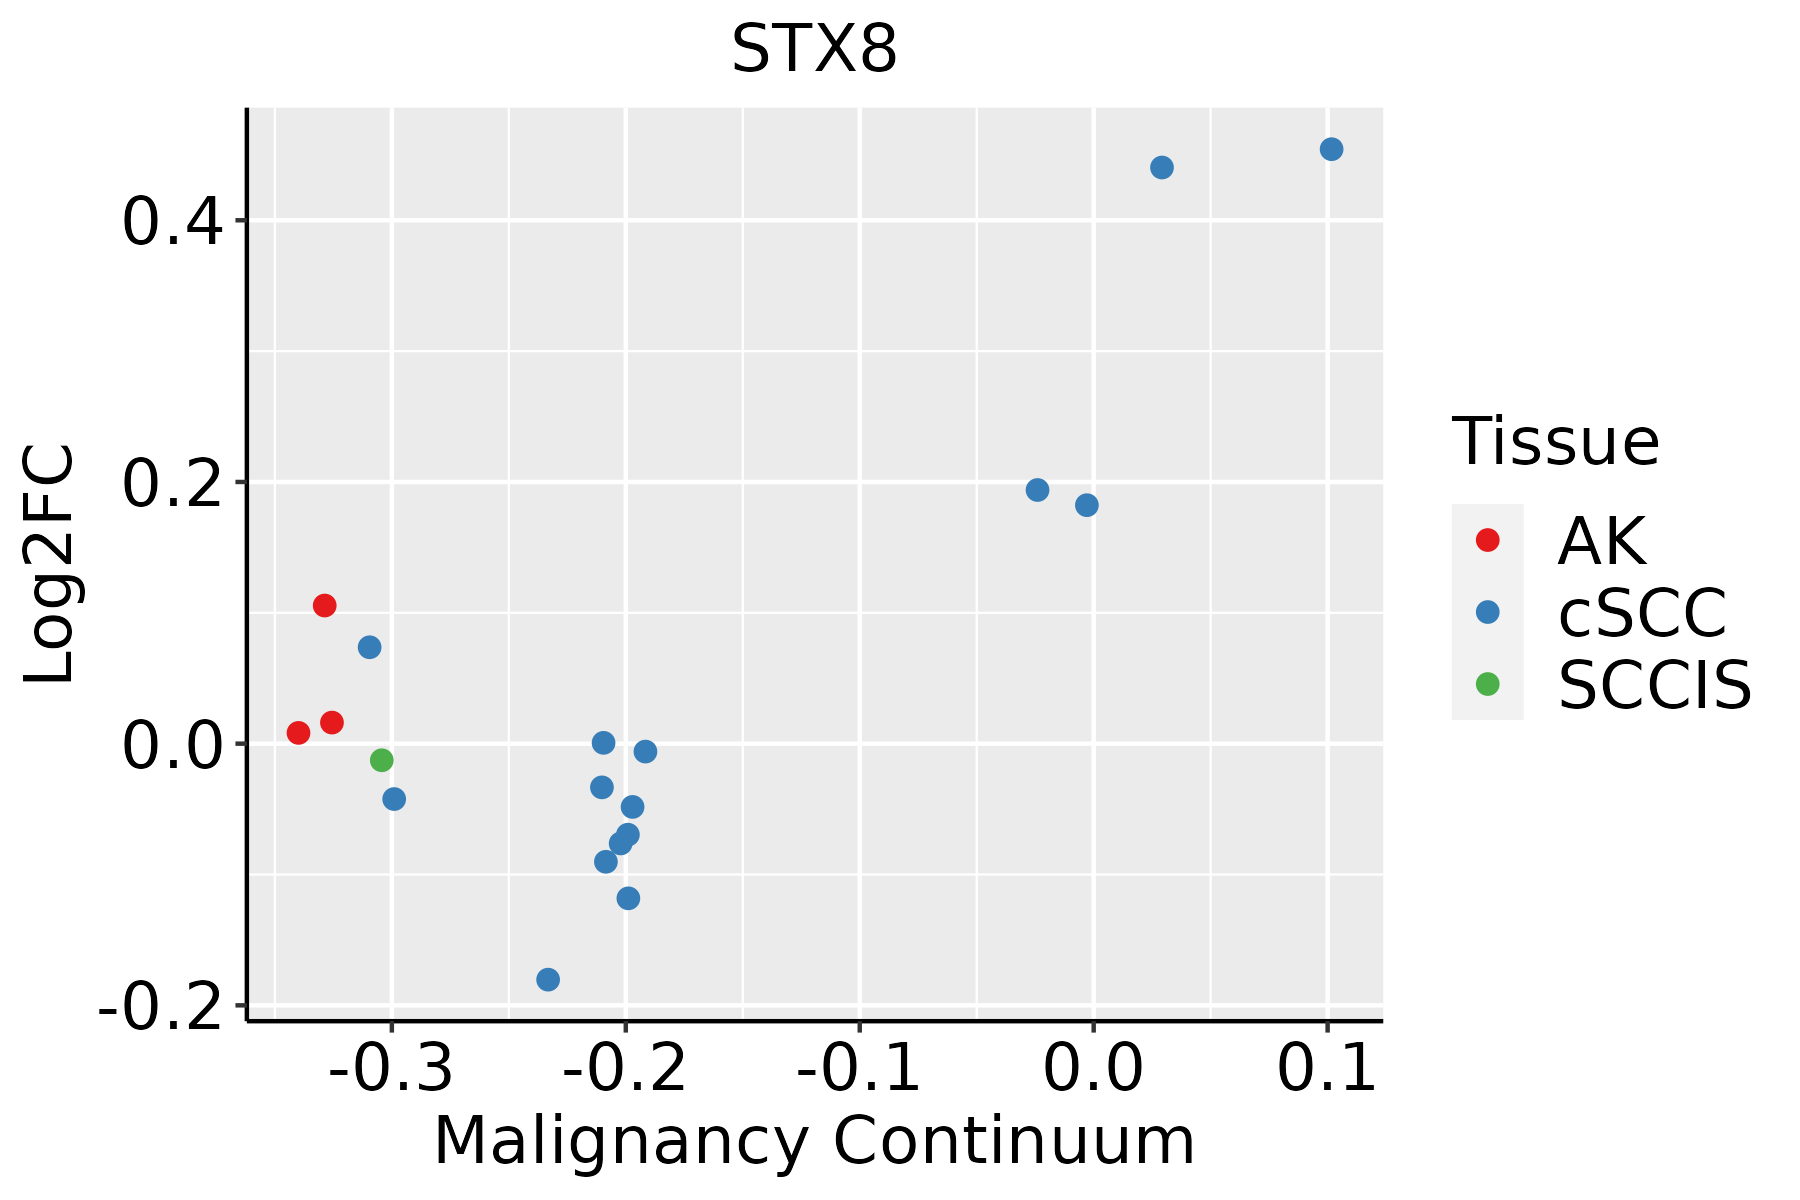 | AK: Actinic keratosis |
| cSCC: Cutaneous squamous cell carcinoma | ||
| SCCIS:squamous cell carcinoma in situ | ||
| Thyroid | 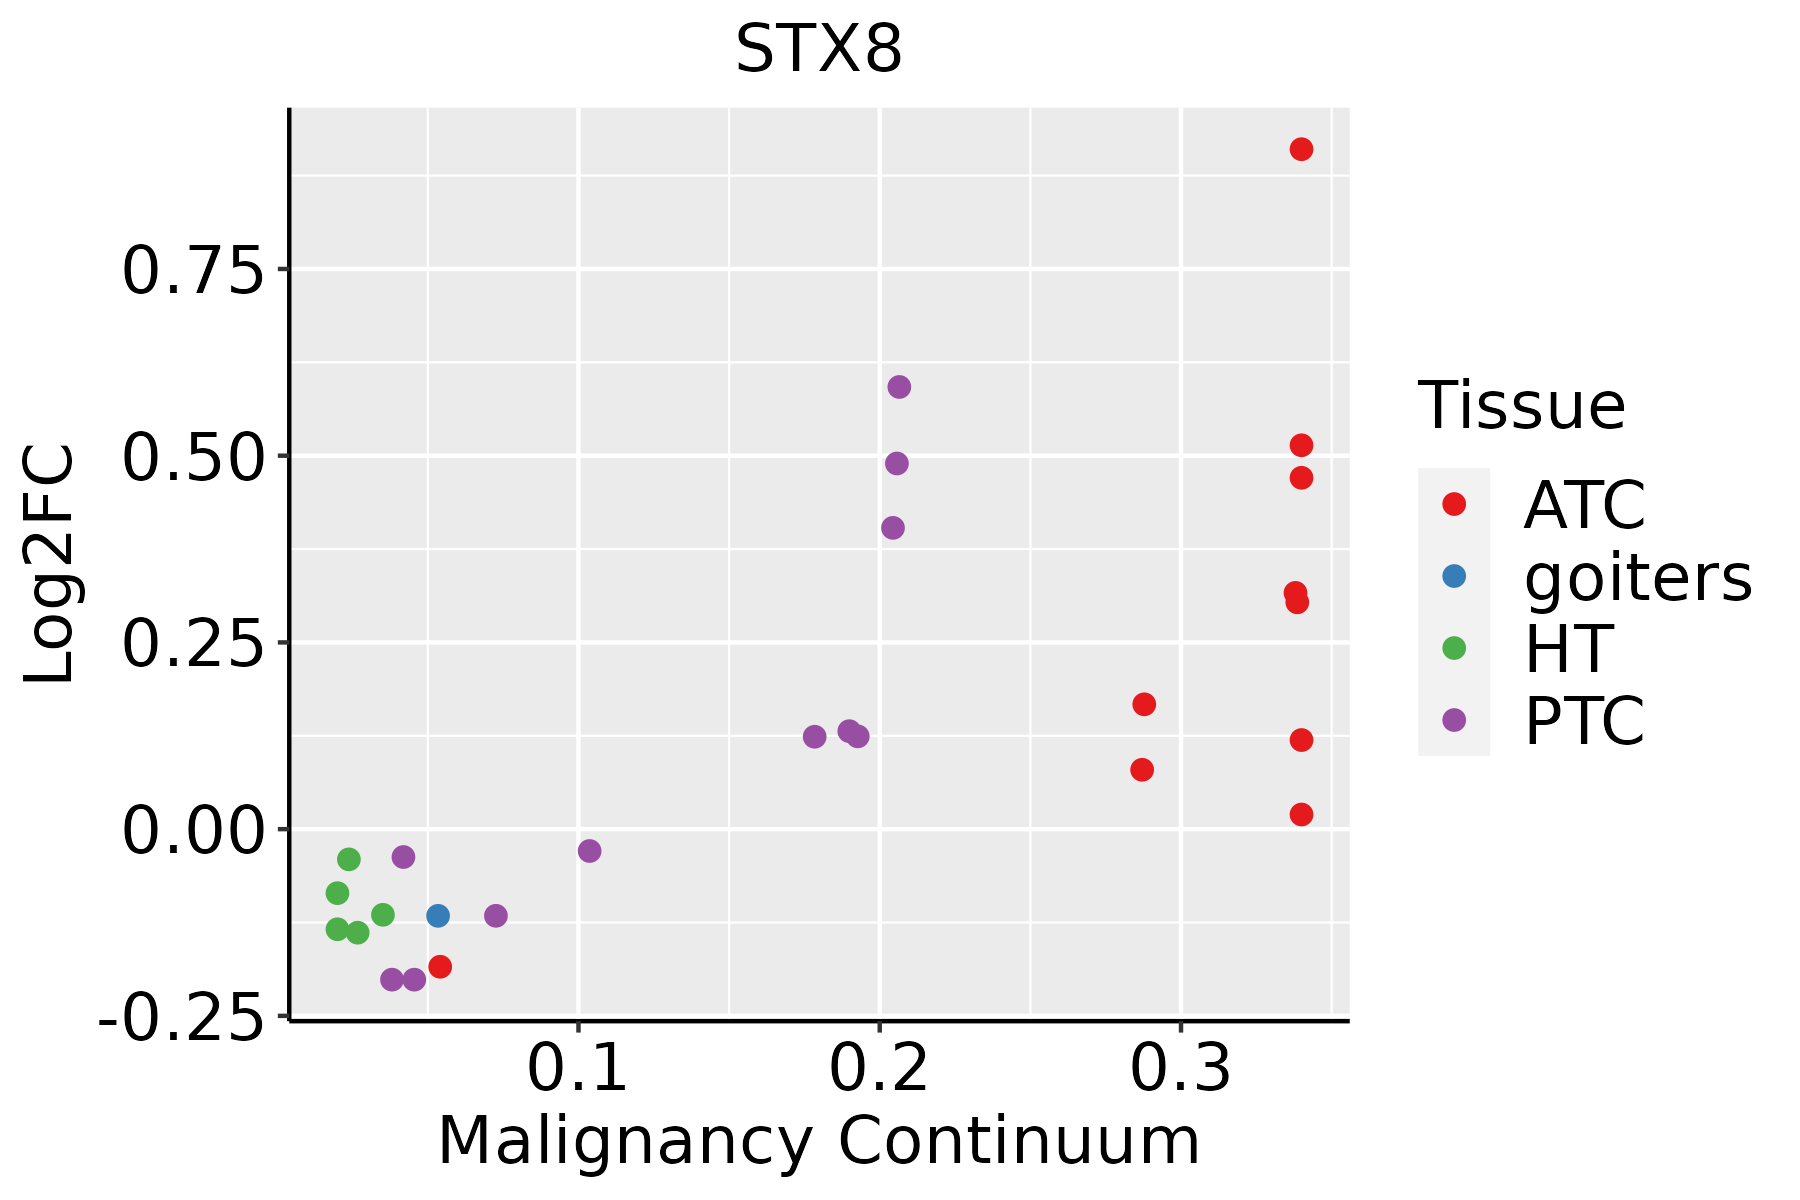 | ATC: Anaplastic thyroid cancer |
| HT: Hashimoto's thyroiditis | ||
| PTC: Papillary thyroid cancer |
| ∗log2FC in expression of this searched gene in stem-like cells from each diseased tissue sample relative to stem-like cells in normal samples in each tissue plotted against the malignancy continuum. Samples are colored based on if they are from different disease stage. |
Top |
Malignant transformation related pathway analysis |
| Find out the enriched GO biological processes and KEGG pathways involved in transition from healthy to precancer to cancer |
| Tissue | Disease Stage | Enriched GO biological Processes |
| Colorectum | AD |  |
| Colorectum | SER |  |
| Colorectum | MSS |  |
| Colorectum | MSI-H |  |
| Colorectum | FAP |  |
| ∗Top 15 enriched GO BP terms are showed in the bar plot of each disease state in each tissue. Each row represents a significant GO biological process which is colored according to the -log10(p.adjust). |
| Page: 1 2 3 4 5 6 7 8 9 |
| GO ID | Tissue | Disease Stage | Description | Gene Ratio | Bg Ratio | pvalue | p.adjust | Count |
| GO:00069064 | Skin | cSCC | vesicle fusion | 43/4864 | 106/18723 | 7.14e-04 | 5.03e-03 | 43 |
| GO:00901744 | Skin | cSCC | organelle membrane fusion | 44/4864 | 110/18723 | 8.82e-04 | 6.07e-03 | 44 |
| GO:004502214 | Skin | cSCC | early endosome to late endosome transport | 20/4864 | 40/18723 | 9.58e-04 | 6.48e-03 | 20 |
| GO:00083334 | Skin | cSCC | endosome to lysosome transport | 23/4864 | 55/18723 | 7.54e-03 | 3.53e-02 | 23 |
| GO:00482782 | Skin | cSCC | vesicle docking | 24/4864 | 59/18723 | 9.59e-03 | 4.30e-02 | 24 |
| GO:001605017 | Thyroid | PTC | vesicle organization | 163/5968 | 300/18723 | 4.74e-16 | 3.69e-14 | 163 |
| GO:0072659112 | Thyroid | PTC | protein localization to plasma membrane | 153/5968 | 284/18723 | 9.90e-15 | 6.50e-13 | 153 |
| GO:1990778111 | Thyroid | PTC | protein localization to cell periphery | 172/5968 | 333/18723 | 3.71e-14 | 2.30e-12 | 172 |
| GO:0007034110 | Thyroid | PTC | vacuolar transport | 90/5968 | 157/18723 | 3.74e-11 | 1.35e-09 | 90 |
| GO:001648217 | Thyroid | PTC | cytosolic transport | 92/5968 | 168/18723 | 6.41e-10 | 1.97e-08 | 92 |
| GO:1904375111 | Thyroid | PTC | regulation of protein localization to cell periphery | 70/5968 | 125/18723 | 2.04e-08 | 4.71e-07 | 70 |
| GO:190547525 | Thyroid | PTC | regulation of protein localization to membrane | 91/5968 | 175/18723 | 2.41e-08 | 5.43e-07 | 91 |
| GO:000704115 | Thyroid | PTC | lysosomal transport | 63/5968 | 114/18723 | 1.97e-07 | 3.54e-06 | 63 |
| GO:1903076112 | Thyroid | PTC | regulation of protein localization to plasma membrane | 58/5968 | 104/18723 | 3.91e-07 | 6.51e-06 | 58 |
| GO:00482846 | Thyroid | PTC | organelle fusion | 71/5968 | 141/18723 | 3.68e-06 | 4.70e-05 | 71 |
| GO:002240615 | Thyroid | PTC | membrane docking | 48/5968 | 86/18723 | 3.72e-06 | 4.73e-05 | 48 |
| GO:00610256 | Thyroid | PTC | membrane fusion | 77/5968 | 163/18723 | 2.86e-05 | 2.78e-04 | 77 |
| GO:00069065 | Thyroid | PTC | vesicle fusion | 54/5968 | 106/18723 | 3.39e-05 | 3.21e-04 | 54 |
| GO:00901745 | Thyroid | PTC | organelle membrane fusion | 55/5968 | 110/18723 | 5.64e-05 | 4.99e-04 | 55 |
| GO:01400569 | Thyroid | PTC | organelle localization by membrane tethering | 40/5968 | 77/18723 | 1.98e-04 | 1.49e-03 | 40 |
| Page: 1 2 3 4 5 6 7 8 9 10 11 |
| Pathway ID | Tissue | Disease Stage | Description | Gene Ratio | Bg Ratio | pvalue | p.adjust | qvalue | Count |
| hsa041305 | Esophagus | ESCC | SNARE interactions in vesicular transport | 28/4205 | 33/8465 | 2.75e-05 | 1.32e-04 | 6.75e-05 | 28 |
| hsa0413012 | Esophagus | ESCC | SNARE interactions in vesicular transport | 28/4205 | 33/8465 | 2.75e-05 | 1.32e-04 | 6.75e-05 | 28 |
| hsa041304 | Oral cavity | OSCC | SNARE interactions in vesicular transport | 28/3704 | 33/8465 | 1.31e-06 | 7.18e-06 | 3.66e-06 | 28 |
| hsa0413011 | Oral cavity | OSCC | SNARE interactions in vesicular transport | 28/3704 | 33/8465 | 1.31e-06 | 7.18e-06 | 3.66e-06 | 28 |
| hsa0413021 | Oral cavity | LP | SNARE interactions in vesicular transport | 22/2418 | 33/8465 | 6.00e-06 | 4.76e-05 | 3.07e-05 | 22 |
| hsa0413031 | Oral cavity | LP | SNARE interactions in vesicular transport | 22/2418 | 33/8465 | 6.00e-06 | 4.76e-05 | 3.07e-05 | 22 |
| Page: 1 |
Top |
Cell-cell communication analysis |
| Identification of potential cell-cell interactions between two cell types and their ligand-receptor pairs for different disease states |
| Ligand | Receptor | LRpair | Pathway | Tissue | Disease Stage |
| Page: 1 |
Top |
Single-cell gene regulatory network inference analysis |
| Find out the significant the regulons (TFs) and the target genes of each regulon across cell types for different disease states |
| TF | Cell Type | Tissue | Disease Stage | Target Gene | RSS | Regulon Activity |
| ∗The dot plots of a searched regulon are shown for all cell subpopulations in each disease state of each tissue based on the regulon specific score inferred using pySCENIC and by calculating the average expression. |
| Page: 1 |
Top |
Somatic mutation of malignant transformation related genes |
| Annotation of somatic variants for genes involved in malignant transformation |
| Hugo Symbol | Variant Class | Variant Classification | dbSNP RS | HGVSc | HGVSp | HGVSp Short | SWISSPROT | BIOTYPE | SIFT | PolyPhen | Tumor Sample Barcode | Tissue | Histology | Sex | Age | Stage | Therapy Types | Drugs | Outcome |
| STX8 | SNV | Missense_Mutation | c.343N>C | p.Glu115Gln | p.E115Q | Q9UNK0 | protein_coding | deleterious(0.01) | benign(0.003) | TCGA-BH-A1F8-01 | Breast | breast invasive carcinoma | Female | >=65 | III/IV | Unknown | Unknown | PD | |
| STX8 | insertion | In_Frame_Ins | novel | c.469_470insGCAATCCCGTGCCCCCGTATTTCTTCC | p.Ala157delinsGlyAsnProValProProTyrPhePhePro | p.A157delinsGNPVPPYFFP | Q9UNK0 | protein_coding | TCGA-A8-A07J-01 | Breast | breast invasive carcinoma | Female | <65 | I/II | Chemotherapy | 5-fluorouracil | CR | ||
| STX8 | insertion | Nonsense_Mutation | novel | c.53_54insTGTCTCAGCCTAAAGCTGGGGCCAATCCACATATC | p.Gln18HisfsTer5 | p.Q18Hfs*5 | Q9UNK0 | protein_coding | TCGA-AC-A2QH-01 | Breast | breast invasive carcinoma | Female | <65 | I/II | Chemotherapy | cytoxan | CR | ||
| STX8 | insertion | Frame_Shift_Ins | novel | c.469_470insTAAAATCACTGGCAATCCCGTGCCCCCGTATTTCTTCC | p.Ala157ValfsTer19 | p.A157Vfs*19 | Q9UNK0 | protein_coding | TCGA-AR-A0TY-01 | Breast | breast invasive carcinoma | Female | <65 | I/II | Unspecific | Paclitaxel | PD | ||
| STX8 | insertion | Frame_Shift_Ins | novel | c.469_470insTAAAATCACTGGCAATCCCGTGCCCCCGTATTTCTTCC | p.Ala157ValfsTer19 | p.A157Vfs*19 | Q9UNK0 | protein_coding | TCGA-E9-A1NC-01 | Breast | breast invasive carcinoma | Female | <65 | I/II | Chemotherapy | doxorubicin | CR | ||
| STX8 | SNV | Missense_Mutation | rs755945693 | c.31N>A | p.Asp11Asn | p.D11N | Q9UNK0 | protein_coding | tolerated(0.06) | possibly_damaging(0.791) | TCGA-FU-A3HZ-01 | Cervix | cervical & endocervical cancer | Female | <65 | I/II | Chemotherapy | cisplatin | CR |
| STX8 | SNV | Missense_Mutation | novel | c.155N>T | p.Lys52Met | p.K52M | Q9UNK0 | protein_coding | deleterious(0.01) | benign(0.084) | TCGA-VS-A958-01 | Cervix | cervical & endocervical cancer | Female | <65 | I/II | Chemotherapy | cisplatin | CR |
| STX8 | SNV | Missense_Mutation | rs752149374 | c.592N>T | p.Arg198Cys | p.R198C | Q9UNK0 | protein_coding | tolerated(0.1) | possibly_damaging(0.87) | TCGA-AA-A00N-01 | Colorectum | colon adenocarcinoma | Male | >=65 | I/II | Unknown | Unknown | PD |
| STX8 | SNV | Missense_Mutation | rs140592918 | c.80N>A | p.Arg27Gln | p.R27Q | Q9UNK0 | protein_coding | deleterious(0.05) | benign(0.042) | TCGA-AA-A00N-01 | Colorectum | colon adenocarcinoma | Male | >=65 | I/II | Unknown | Unknown | PD |
| STX8 | SNV | Missense_Mutation | c.193N>A | p.Ala65Thr | p.A65T | Q9UNK0 | protein_coding | tolerated(0.05) | benign(0.339) | TCGA-AY-6197-01 | Colorectum | colon adenocarcinoma | Male | <65 | I/II | Unknown | Unknown | SD |
| Page: 1 2 3 4 5 |
Top |
Related drugs of malignant transformation related genes |
| Identification of chemicals and drugs interact with genes involved in malignant transfromation |
| (DGIdb 4.0) |
| Entrez ID | Symbol | Category | Interaction Types | Drug Claim Name | Drug Name | PMIDs |
| Page: 1 |

Copyright 2023-Present -The University of Texas Health Science Center at Houston |