
|
|||||
|
 | |
| |
| |
| |
| |
| |
|
Gene: SRSF4 |
Gene summary for SRSF4 |
| Gene information | Species | Human | Gene symbol | SRSF4 | Gene ID | 6429 |
| Gene name | serine and arginine rich splicing factor 4 | |
| Gene Alias | SFRS4 | |
| Cytomap | 1p35.3 | |
| Gene Type | protein-coding | GO ID | GO:0000375 | UniProtAcc | Q08170 |
Top |
Malignant transformation analysis |
| Identification of the aberrant gene expression in precancerous and cancerous lesions by comparing the gene expression of stem-like cells in diseased tissues with normal stem cells |
| Entrez ID | Symbol | Replicates | Species | Organ | Tissue | Adj P-value | Log2FC | Malignancy |
| 6429 | SRSF4 | CA_HPV_1 | Human | Cervix | CC | 2.66e-02 | -1.96e-02 | 0.0264 |
| 6429 | SRSF4 | CCI_1 | Human | Cervix | CC | 4.30e-02 | 6.94e-01 | 0.528 |
| 6429 | SRSF4 | CCI_3 | Human | Cervix | CC | 1.27e-11 | 8.81e-01 | 0.516 |
| 6429 | SRSF4 | sample3 | Human | Cervix | CC | 5.73e-03 | 1.96e-01 | 0.1387 |
| 6429 | SRSF4 | T3 | Human | Cervix | CC | 2.67e-05 | 2.04e-01 | 0.1389 |
| 6429 | SRSF4 | HTA11_347_2000001011 | Human | Colorectum | AD | 1.14e-18 | 8.07e-01 | -0.1954 |
| 6429 | SRSF4 | HTA11_1391_2000001011 | Human | Colorectum | AD | 1.23e-03 | 5.45e-01 | -0.059 |
| 6429 | SRSF4 | F007 | Human | Colorectum | FAP | 1.83e-02 | -2.20e-01 | 0.1176 |
| 6429 | SRSF4 | A001-C-207 | Human | Colorectum | FAP | 4.58e-02 | -5.40e-02 | 0.1278 |
| 6429 | SRSF4 | A015-C-203 | Human | Colorectum | FAP | 7.59e-35 | -3.64e-01 | -0.1294 |
| 6429 | SRSF4 | A015-C-204 | Human | Colorectum | FAP | 7.66e-10 | -2.91e-01 | -0.0228 |
| 6429 | SRSF4 | A014-C-040 | Human | Colorectum | FAP | 9.86e-05 | -2.99e-01 | -0.1184 |
| 6429 | SRSF4 | A002-C-201 | Human | Colorectum | FAP | 4.70e-17 | -2.86e-01 | 0.0324 |
| 6429 | SRSF4 | A002-C-203 | Human | Colorectum | FAP | 5.06e-08 | -1.95e-01 | 0.2786 |
| 6429 | SRSF4 | A001-C-119 | Human | Colorectum | FAP | 8.67e-06 | -1.39e-01 | -0.1557 |
| 6429 | SRSF4 | A001-C-108 | Human | Colorectum | FAP | 1.39e-20 | -1.70e-01 | -0.0272 |
| 6429 | SRSF4 | A002-C-205 | Human | Colorectum | FAP | 1.14e-25 | -2.40e-01 | -0.1236 |
| 6429 | SRSF4 | A001-C-104 | Human | Colorectum | FAP | 9.03e-04 | -2.82e-02 | 0.0184 |
| 6429 | SRSF4 | A015-C-005 | Human | Colorectum | FAP | 3.66e-05 | -1.60e-01 | -0.0336 |
| 6429 | SRSF4 | A015-C-006 | Human | Colorectum | FAP | 2.50e-19 | -2.85e-01 | -0.0994 |
| Page: 1 2 3 4 5 6 7 8 9 10 11 |
| Tissue | Expression Dynamics | Abbreviation |
| Cervix |  | CC: Cervix cancer |
| HSIL_HPV: HPV-infected high-grade squamous intraepithelial lesions | ||
| N_HPV: HPV-infected normal cervix | ||
| Colorectum (GSE201348) |  | FAP: Familial adenomatous polyposis |
| CRC: Colorectal cancer | ||
| Colorectum (HTA11) |  | AD: Adenomas |
| SER: Sessile serrated lesions | ||
| MSI-H: Microsatellite-high colorectal cancer | ||
| MSS: Microsatellite stable colorectal cancer | ||
| Esophagus | 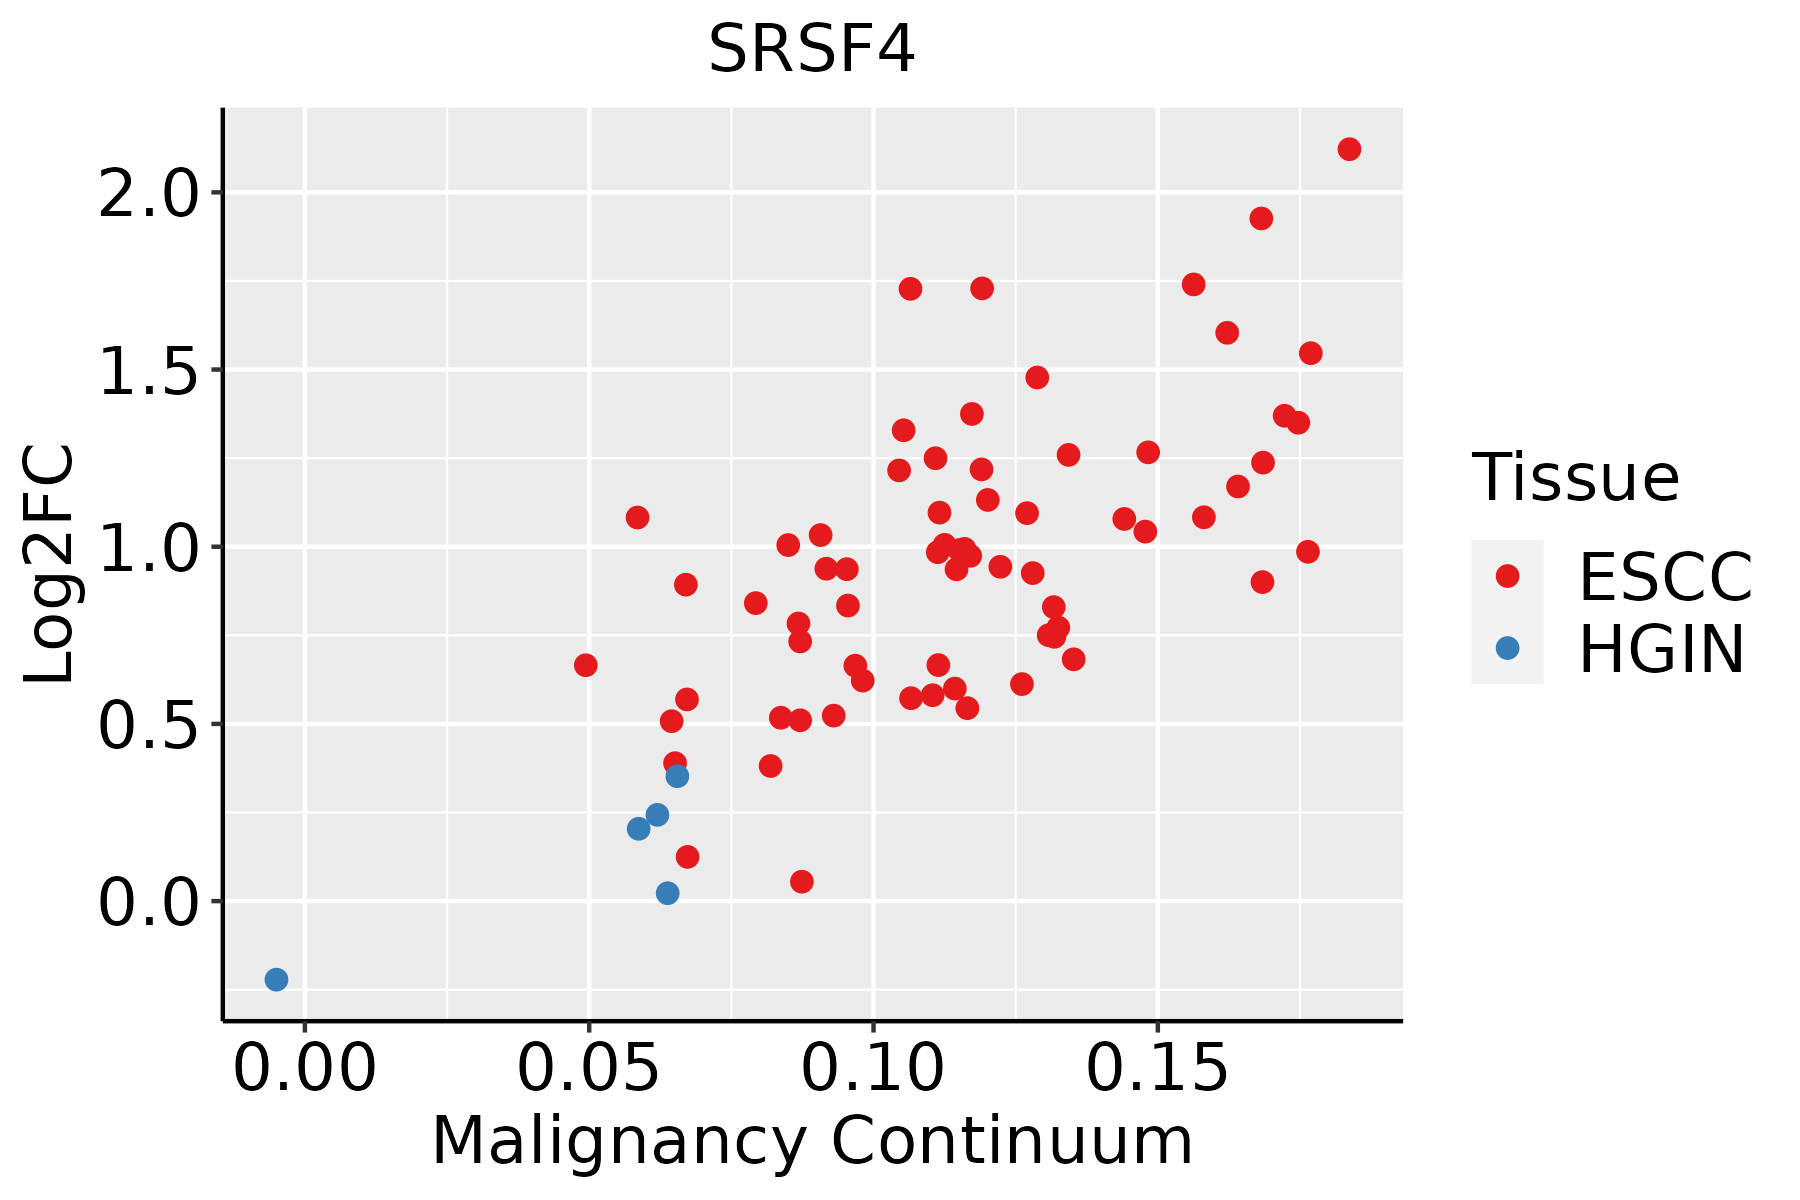 | ESCC: Esophageal squamous cell carcinoma |
| HGIN: High-grade intraepithelial neoplasias | ||
| LGIN: Low-grade intraepithelial neoplasias | ||
| Liver | 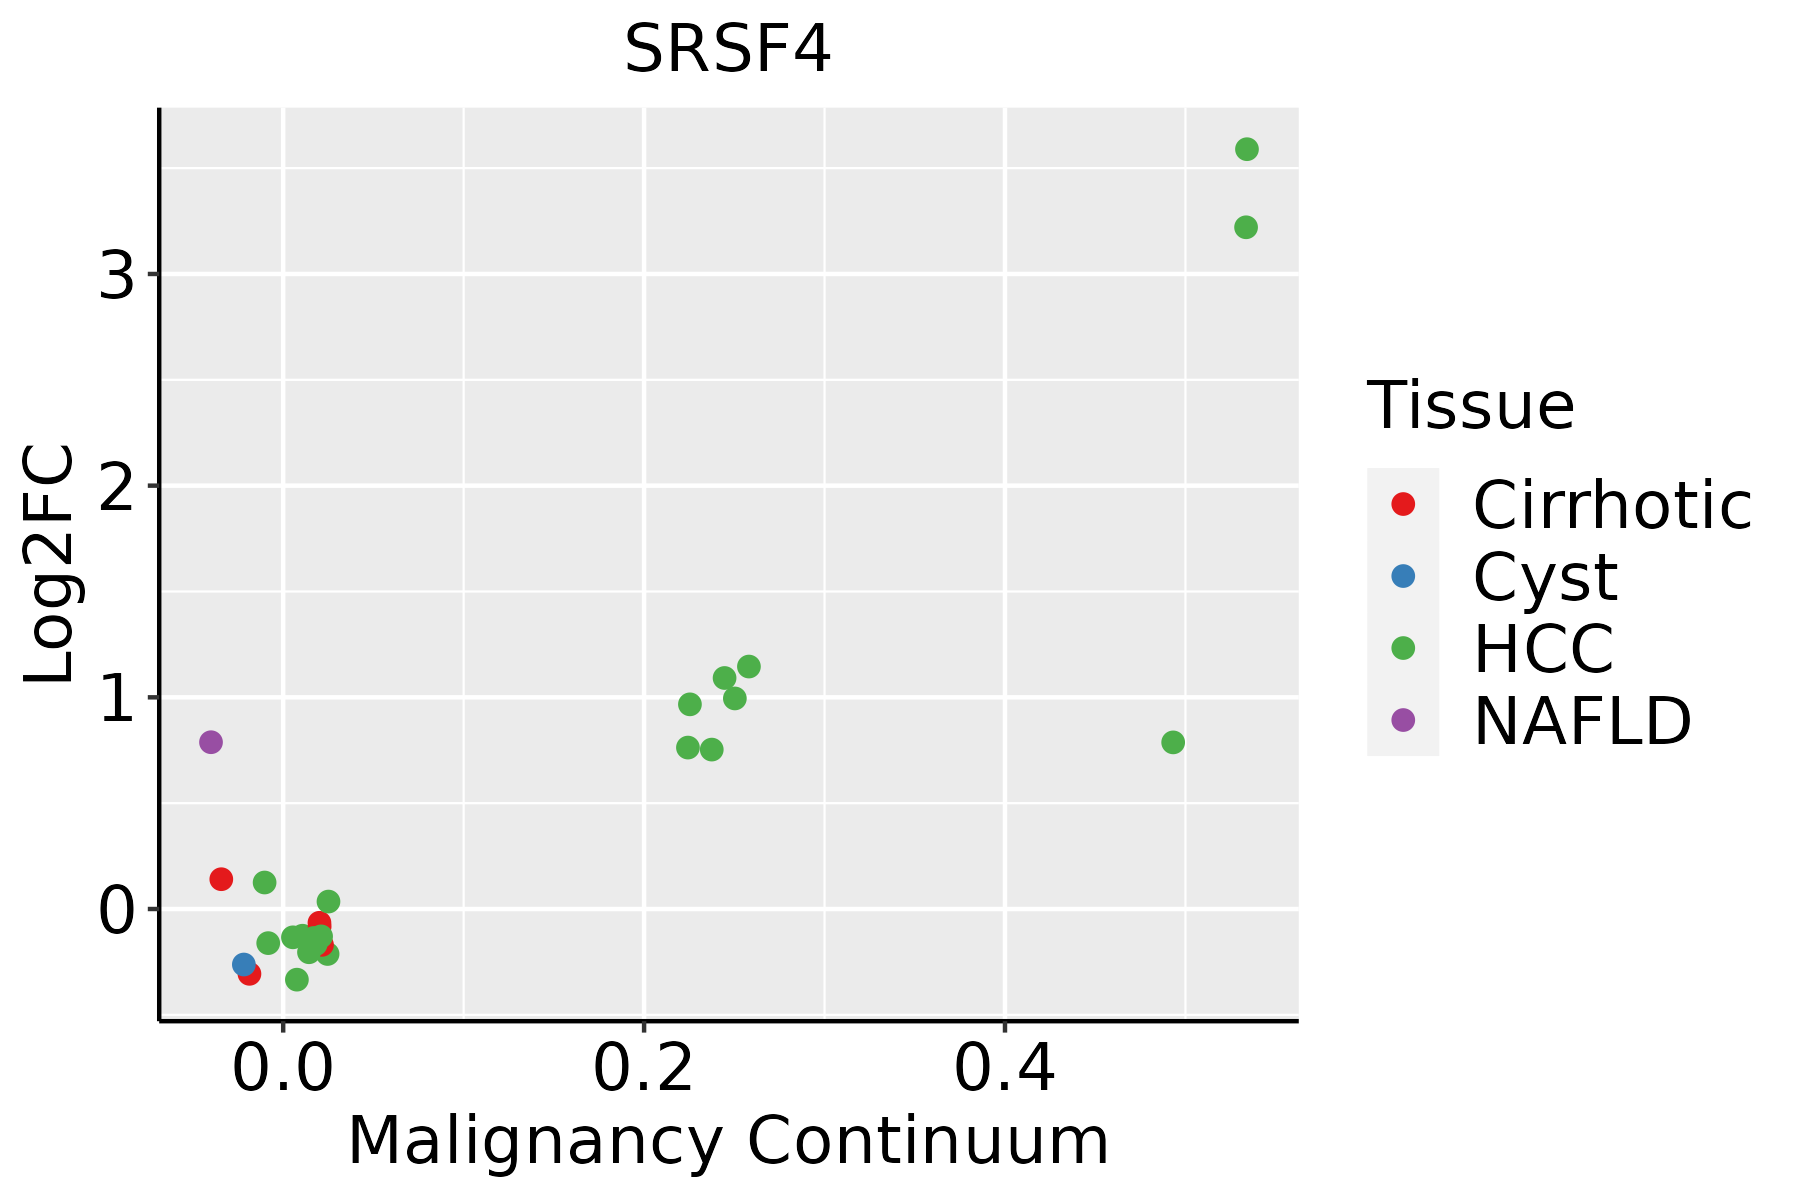 | HCC: Hepatocellular carcinoma |
| NAFLD: Non-alcoholic fatty liver disease | ||
| Lung |  | AAH: Atypical adenomatous hyperplasia |
| AIS: Adenocarcinoma in situ | ||
| IAC: Invasive lung adenocarcinoma | ||
| MIA: Minimally invasive adenocarcinoma | ||
| Oral Cavity | 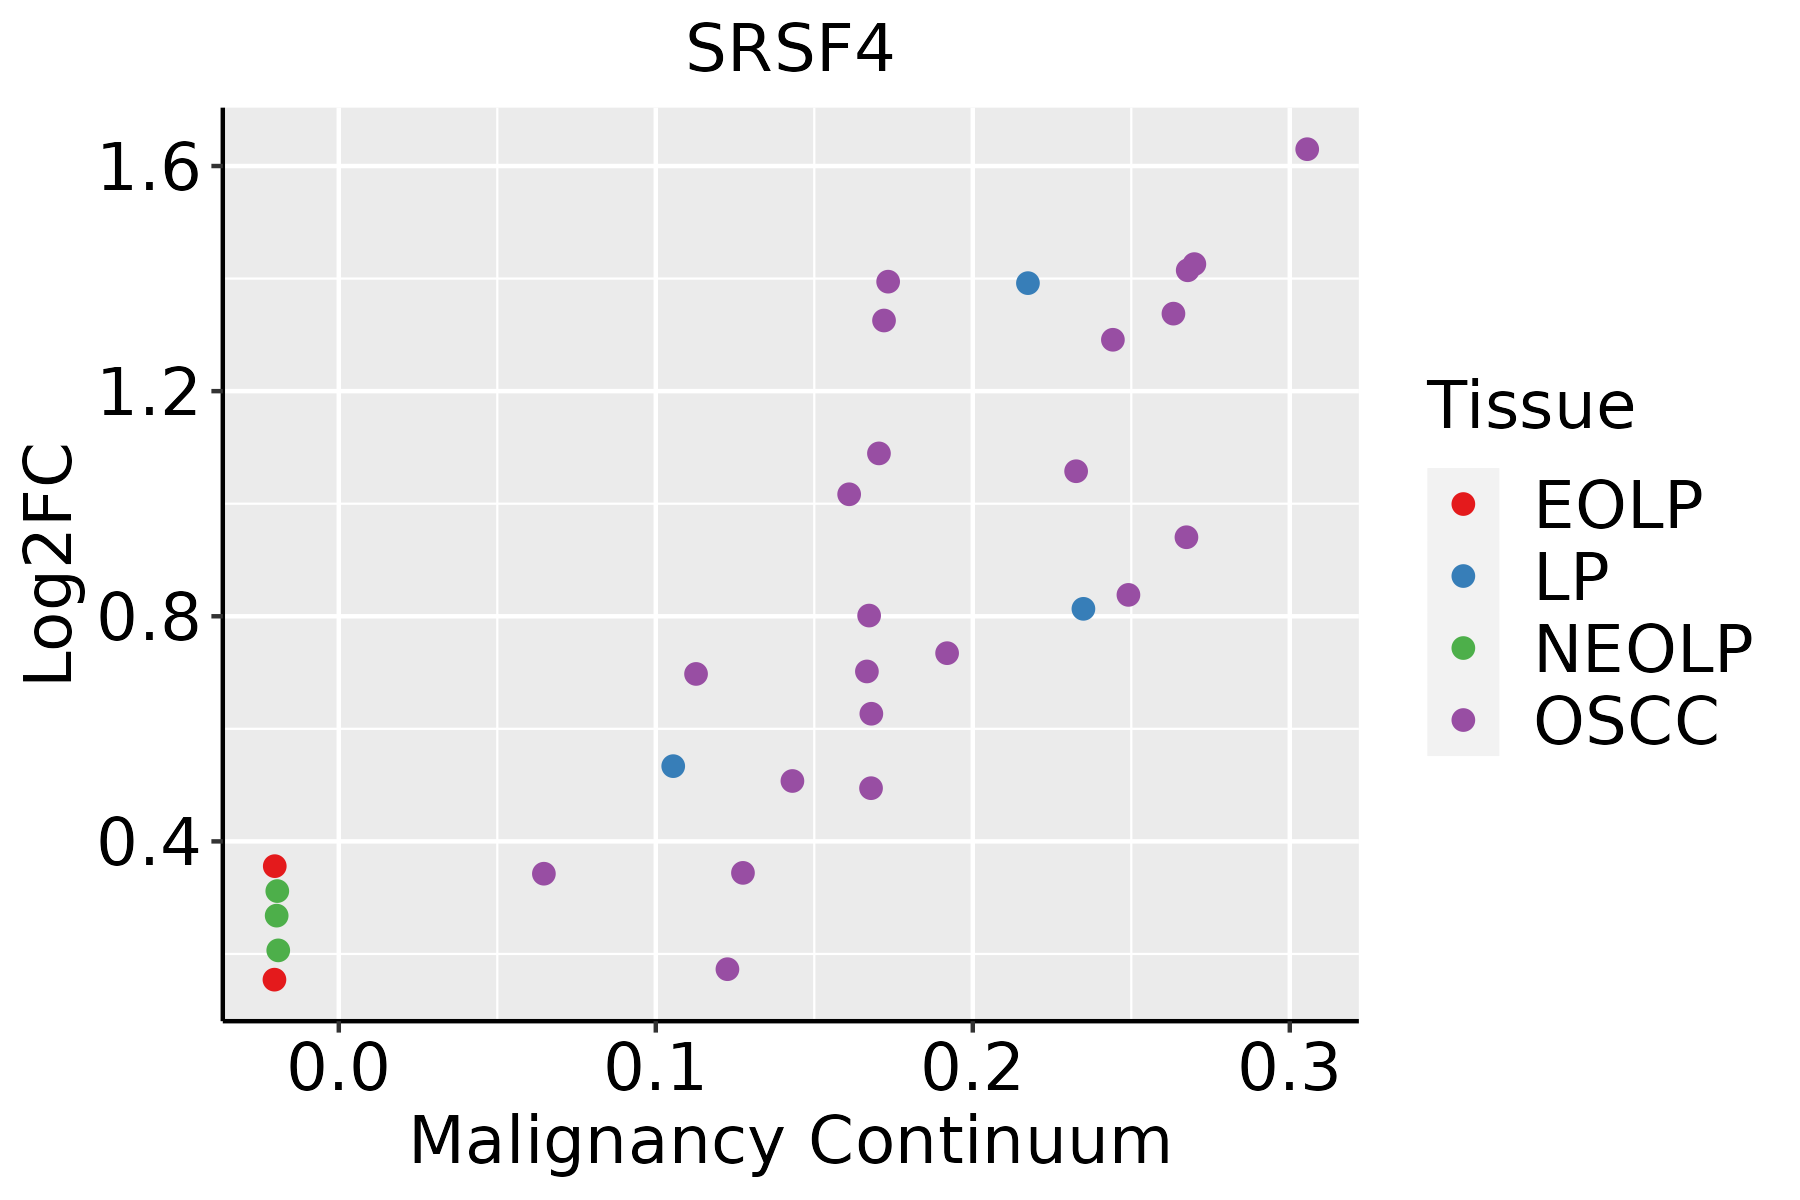 | EOLP: Erosive Oral lichen planus |
| LP: leukoplakia | ||
| NEOLP: Non-erosive oral lichen planus | ||
| OSCC: Oral squamous cell carcinoma | ||
| Prostate | 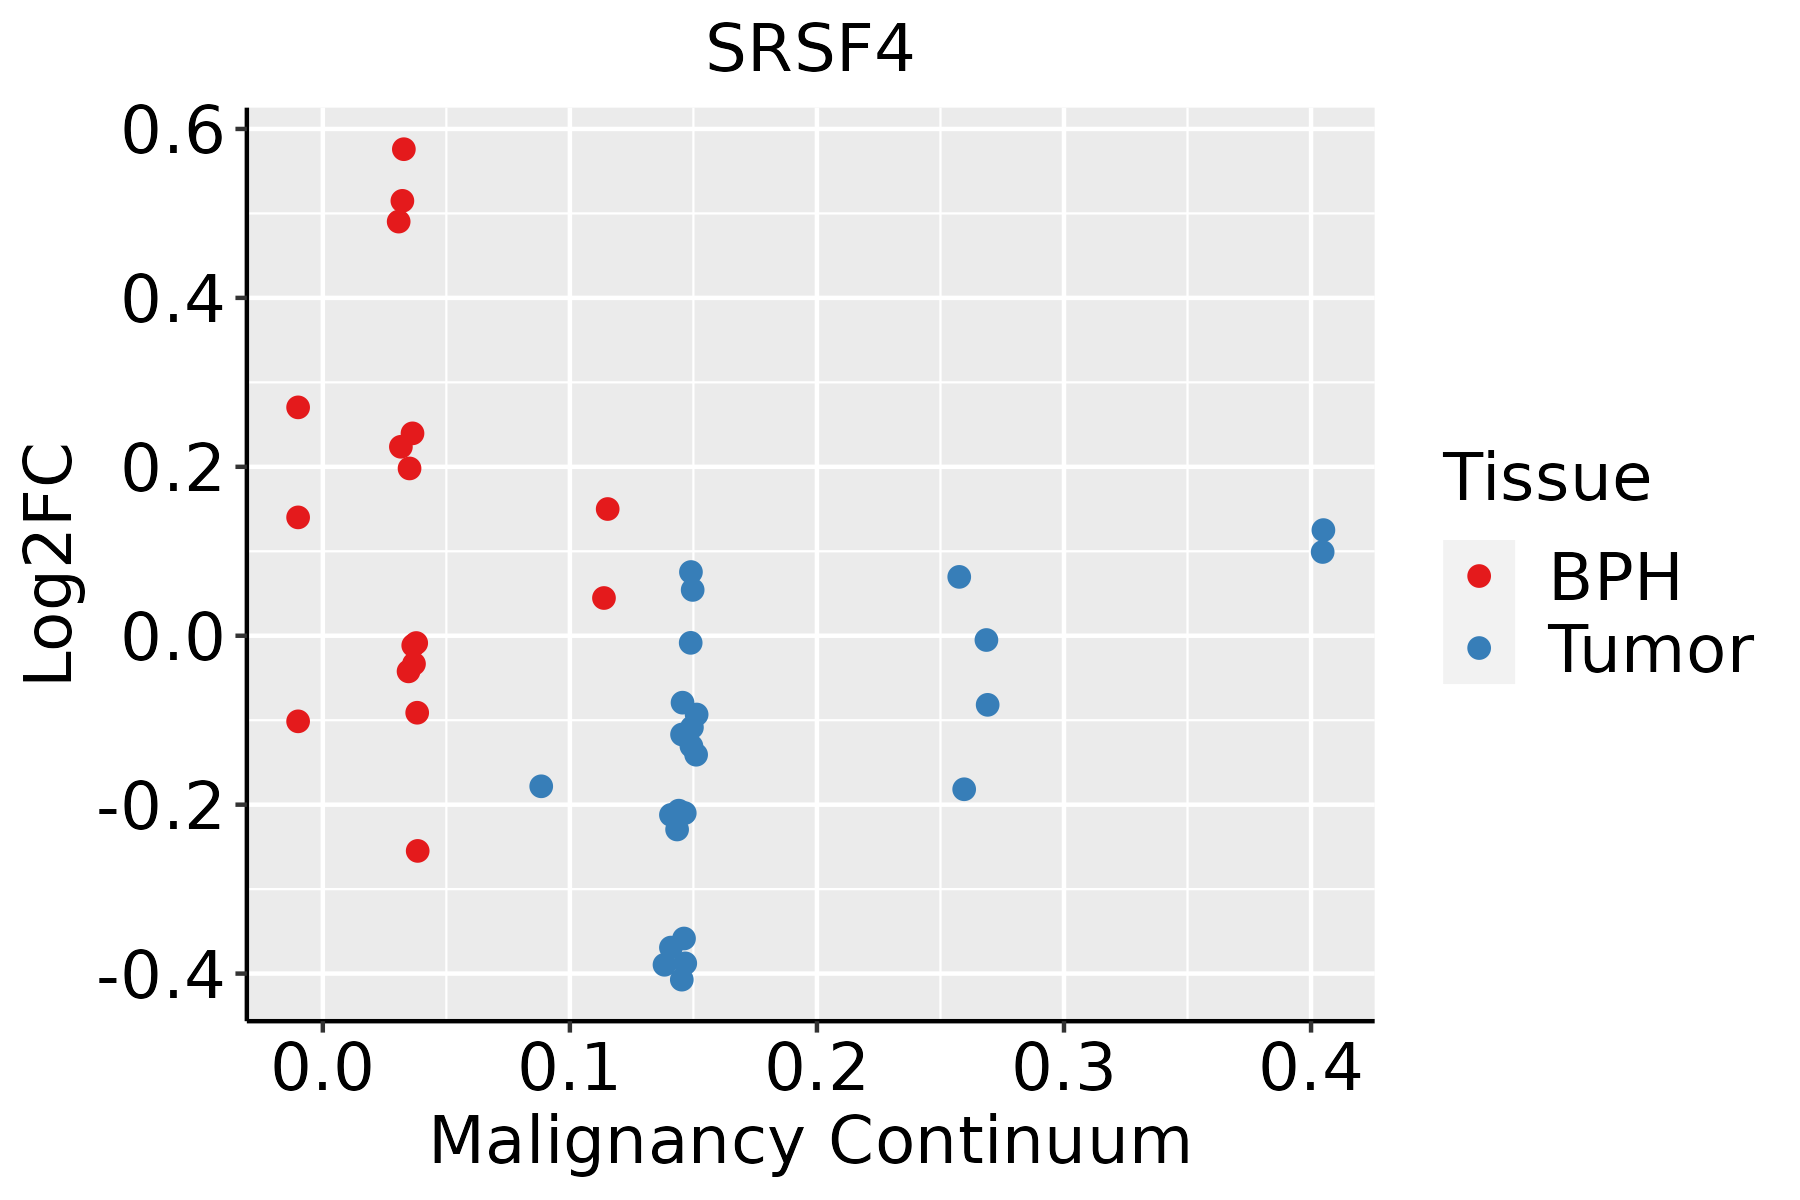 | BPH: Benign Prostatic Hyperplasia |
| Skin | 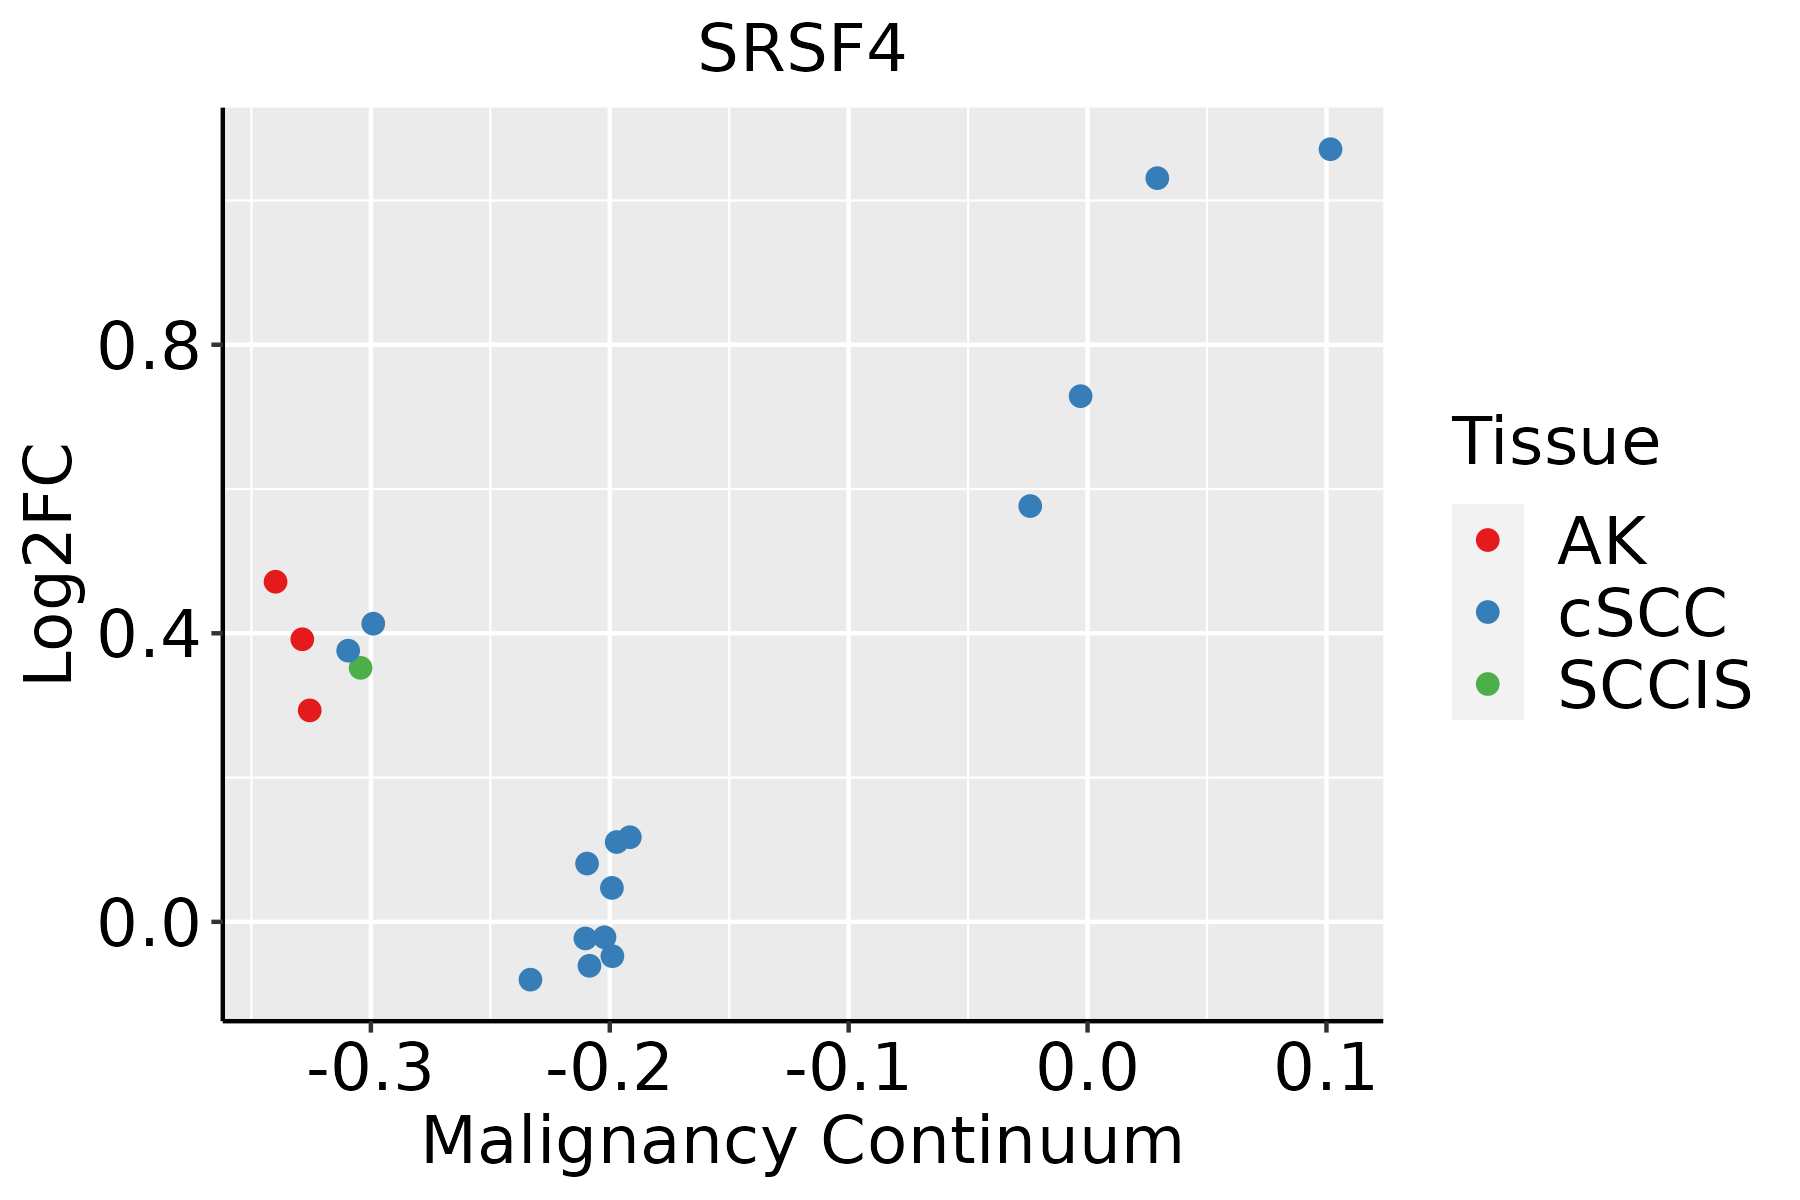 | AK: Actinic keratosis |
| cSCC: Cutaneous squamous cell carcinoma | ||
| SCCIS:squamous cell carcinoma in situ | ||
| Thyroid | 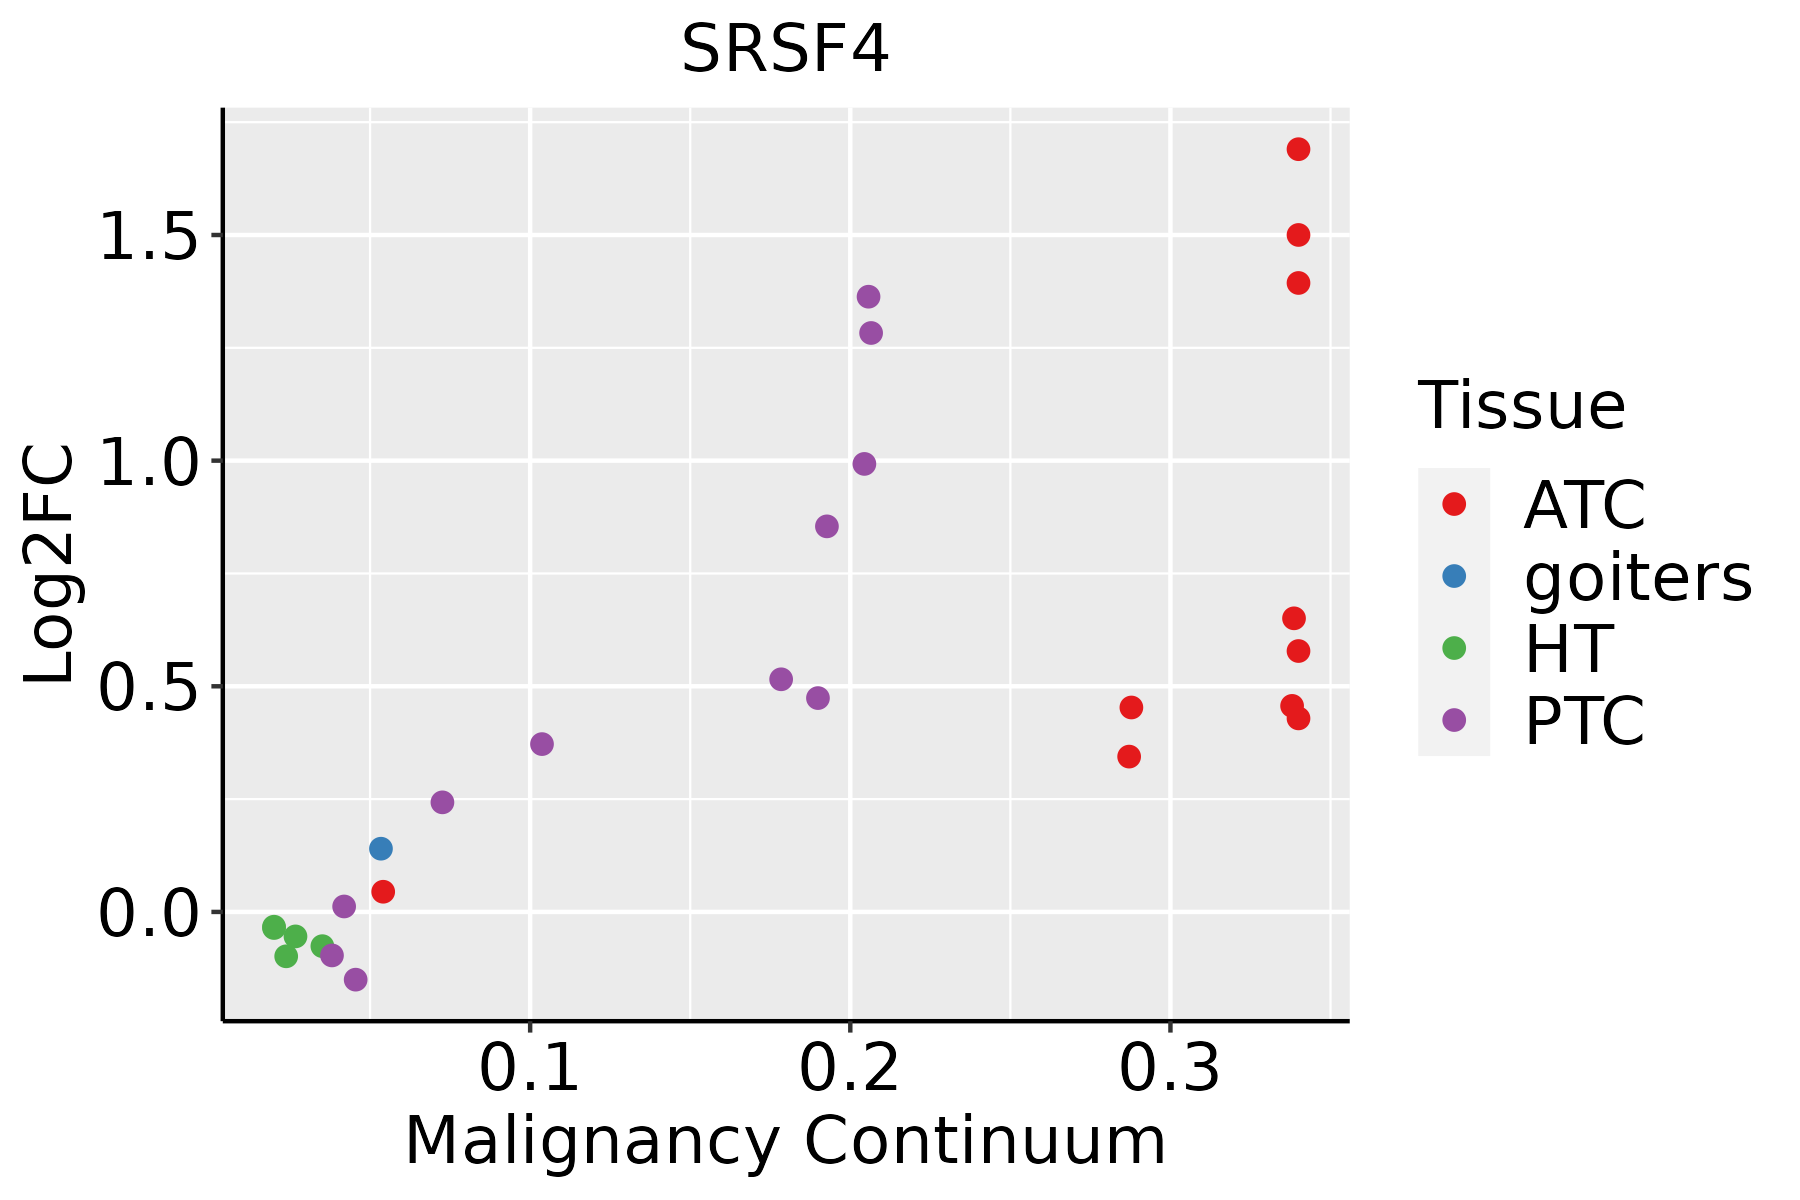 | ATC: Anaplastic thyroid cancer |
| HT: Hashimoto's thyroiditis | ||
| PTC: Papillary thyroid cancer |
| ∗log2FC in expression of this searched gene in stem-like cells from each diseased tissue sample relative to stem-like cells in normal samples in each tissue plotted against the malignancy continuum. Samples are colored based on if they are from different disease stage. |
Top |
Malignant transformation related pathway analysis |
| Find out the enriched GO biological processes and KEGG pathways involved in transition from healthy to precancer to cancer |
| Tissue | Disease Stage | Enriched GO biological Processes |
| Colorectum | AD |  |
| Colorectum | SER |  |
| Colorectum | MSS |  |
| Colorectum | MSI-H |  |
| Colorectum | FAP |  |
| ∗Top 15 enriched GO BP terms are showed in the bar plot of each disease state in each tissue. Each row represents a significant GO biological process which is colored according to the -log10(p.adjust). |
| Page: 1 2 3 4 5 6 7 8 9 |
| GO ID | Tissue | Disease Stage | Description | Gene Ratio | Bg Ratio | pvalue | p.adjust | Count |
| GO:000838020 | Oral cavity | OSCC | RNA splicing | 308/7305 | 434/18723 | 2.43e-42 | 7.70e-39 | 308 |
| GO:000037519 | Oral cavity | OSCC | RNA splicing, via transesterification reactions | 225/7305 | 324/18723 | 5.20e-29 | 2.99e-26 | 225 |
| GO:000037719 | Oral cavity | OSCC | RNA splicing, via transesterification reactions with bulged adenosine as nucleophile | 221/7305 | 320/18723 | 5.50e-28 | 2.18e-25 | 221 |
| GO:000039819 | Oral cavity | OSCC | mRNA splicing, via spliceosome | 221/7305 | 320/18723 | 5.50e-28 | 2.18e-25 | 221 |
| GO:190331118 | Oral cavity | OSCC | regulation of mRNA metabolic process | 197/7305 | 288/18723 | 2.83e-24 | 7.16e-22 | 197 |
| GO:005068417 | Oral cavity | OSCC | regulation of mRNA processing | 104/7305 | 137/18723 | 1.32e-18 | 1.58e-16 | 104 |
| GO:004348420 | Oral cavity | OSCC | regulation of RNA splicing | 108/7305 | 148/18723 | 4.25e-17 | 3.69e-15 | 108 |
| GO:004802420 | Oral cavity | OSCC | regulation of mRNA splicing, via spliceosome | 74/7305 | 101/18723 | 2.66e-12 | 1.09e-10 | 74 |
| GO:00506869 | Oral cavity | OSCC | negative regulation of mRNA processing | 25/7305 | 29/18723 | 2.15e-07 | 3.43e-06 | 25 |
| GO:004343419 | Oral cavity | OSCC | response to peptide hormone | 208/7305 | 414/18723 | 1.83e-06 | 2.35e-05 | 208 |
| GO:190331220 | Oral cavity | OSCC | negative regulation of mRNA metabolic process | 58/7305 | 92/18723 | 2.59e-06 | 3.23e-05 | 58 |
| GO:003311920 | Oral cavity | OSCC | negative regulation of RNA splicing | 21/7305 | 25/18723 | 5.07e-06 | 5.72e-05 | 21 |
| GO:003286816 | Oral cavity | OSCC | response to insulin | 138/7305 | 264/18723 | 7.54e-06 | 8.15e-05 | 138 |
| GO:00480259 | Oral cavity | OSCC | negative regulation of mRNA splicing, via spliceosome | 17/7305 | 20/18723 | 3.21e-05 | 2.90e-04 | 17 |
| GO:0008380110 | Oral cavity | LP | RNA splicing | 237/4623 | 434/18723 | 1.82e-41 | 3.79e-38 | 237 |
| GO:0000375110 | Oral cavity | LP | RNA splicing, via transesterification reactions | 181/4623 | 324/18723 | 1.36e-33 | 1.70e-30 | 181 |
| GO:0000377110 | Oral cavity | LP | RNA splicing, via transesterification reactions with bulged adenosine as nucleophile | 179/4623 | 320/18723 | 2.48e-33 | 2.22e-30 | 179 |
| GO:0000398110 | Oral cavity | LP | mRNA splicing, via spliceosome | 179/4623 | 320/18723 | 2.48e-33 | 2.22e-30 | 179 |
| GO:0043484110 | Oral cavity | LP | regulation of RNA splicing | 81/4623 | 148/18723 | 4.34e-15 | 5.79e-13 | 81 |
| GO:005068418 | Oral cavity | LP | regulation of mRNA processing | 76/4623 | 137/18723 | 1.14e-14 | 1.35e-12 | 76 |
| Page: 1 2 3 4 5 6 7 8 9 10 11 12 13 14 15 16 |
| Pathway ID | Tissue | Disease Stage | Description | Gene Ratio | Bg Ratio | pvalue | p.adjust | qvalue | Count |
| hsa03040 | Colorectum | AD | Spliceosome | 73/2092 | 217/8465 | 1.73e-03 | 9.68e-03 | 6.18e-03 | 73 |
| hsa030401 | Colorectum | AD | Spliceosome | 73/2092 | 217/8465 | 1.73e-03 | 9.68e-03 | 6.18e-03 | 73 |
| hsa0304018 | Esophagus | HGIN | Spliceosome | 79/1383 | 217/8465 | 3.22e-13 | 7.00e-12 | 5.56e-12 | 79 |
| hsa0304019 | Esophagus | HGIN | Spliceosome | 79/1383 | 217/8465 | 3.22e-13 | 7.00e-12 | 5.56e-12 | 79 |
| hsa0304027 | Esophagus | ESCC | Spliceosome | 128/4205 | 217/8465 | 3.31e-03 | 8.79e-03 | 4.50e-03 | 128 |
| hsa0304037 | Esophagus | ESCC | Spliceosome | 128/4205 | 217/8465 | 3.31e-03 | 8.79e-03 | 4.50e-03 | 128 |
| hsa030407 | Liver | Cirrhotic | Spliceosome | 102/2530 | 217/8465 | 5.69e-08 | 9.47e-07 | 5.84e-07 | 102 |
| hsa0304012 | Liver | Cirrhotic | Spliceosome | 102/2530 | 217/8465 | 5.69e-08 | 9.47e-07 | 5.84e-07 | 102 |
| hsa0304022 | Liver | HCC | Spliceosome | 122/4020 | 217/8465 | 5.55e-03 | 1.60e-02 | 8.91e-03 | 122 |
| hsa0304032 | Liver | HCC | Spliceosome | 122/4020 | 217/8465 | 5.55e-03 | 1.60e-02 | 8.91e-03 | 122 |
| hsa0304016 | Oral cavity | OSCC | Spliceosome | 123/3704 | 217/8465 | 7.21e-05 | 2.74e-04 | 1.40e-04 | 123 |
| hsa0304017 | Oral cavity | OSCC | Spliceosome | 123/3704 | 217/8465 | 7.21e-05 | 2.74e-04 | 1.40e-04 | 123 |
| hsa0304026 | Oral cavity | LP | Spliceosome | 106/2418 | 217/8465 | 1.30e-10 | 2.40e-09 | 1.55e-09 | 106 |
| hsa0304036 | Oral cavity | LP | Spliceosome | 106/2418 | 217/8465 | 1.30e-10 | 2.40e-09 | 1.55e-09 | 106 |
| hsa0304010 | Prostate | BPH | Spliceosome | 62/1718 | 217/8465 | 1.99e-03 | 7.92e-03 | 4.90e-03 | 62 |
| hsa0304015 | Prostate | BPH | Spliceosome | 62/1718 | 217/8465 | 1.99e-03 | 7.92e-03 | 4.90e-03 | 62 |
| hsa0304025 | Prostate | Tumor | Spliceosome | 66/1791 | 217/8465 | 7.53e-04 | 3.59e-03 | 2.23e-03 | 66 |
| hsa0304035 | Prostate | Tumor | Spliceosome | 66/1791 | 217/8465 | 7.53e-04 | 3.59e-03 | 2.23e-03 | 66 |
| Page: 1 |
Top |
Cell-cell communication analysis |
| Identification of potential cell-cell interactions between two cell types and their ligand-receptor pairs for different disease states |
| Ligand | Receptor | LRpair | Pathway | Tissue | Disease Stage |
| Page: 1 |
Top |
Single-cell gene regulatory network inference analysis |
| Find out the significant the regulons (TFs) and the target genes of each regulon across cell types for different disease states |
| TF | Cell Type | Tissue | Disease Stage | Target Gene | RSS | Regulon Activity |
| ∗The dot plots of a searched regulon are shown for all cell subpopulations in each disease state of each tissue based on the regulon specific score inferred using pySCENIC and by calculating the average expression. |
| Page: 1 |
Top |
Somatic mutation of malignant transformation related genes |
| Annotation of somatic variants for genes involved in malignant transformation |
| Hugo Symbol | Variant Class | Variant Classification | dbSNP RS | HGVSc | HGVSp | HGVSp Short | SWISSPROT | BIOTYPE | SIFT | PolyPhen | Tumor Sample Barcode | Tissue | Histology | Sex | Age | Stage | Therapy Types | Drugs | Outcome |
| SRSF4 | SNV | Missense_Mutation | c.1015N>A | p.Gly339Ser | p.G339S | Q08170 | protein_coding | deleterious_low_confidence(0.03) | benign(0.01) | TCGA-A1-A0SO-01 | Breast | breast invasive carcinoma | Female | >=65 | I/II | Chemotherapy | SD | ||
| SRSF4 | SNV | Missense_Mutation | novel | c.22C>A | p.Arg8Ser | p.R8S | Q08170 | protein_coding | deleterious(0.01) | probably_damaging(0.947) | TCGA-A7-A0DB-01 | Breast | breast invasive carcinoma | Female | <65 | I/II | Hormone Therapy | arimidex | SD |
| SRSF4 | SNV | Missense_Mutation | c.460N>G | p.Lys154Glu | p.K154E | Q08170 | protein_coding | tolerated(0.13) | possibly_damaging(0.549) | TCGA-AR-A0TT-01 | Breast | breast invasive carcinoma | Female | <65 | III/IV | Chemotherapy | doxorubicin | SD | |
| SRSF4 | SNV | Missense_Mutation | novel | c.620G>C | p.Arg207Pro | p.R207P | Q08170 | protein_coding | deleterious(0.03) | probably_damaging(0.995) | TCGA-JL-A3YW-01 | Breast | breast invasive carcinoma | Female | <65 | I/II | Unknown | Unknown | SD |
| SRSF4 | insertion | In_Frame_Ins | novel | c.1279_1280insTGCTAA | p.Gly427delinsValLeuSer | p.G427delinsVLS | Q08170 | protein_coding | TCGA-AN-A0FX-01 | Breast | breast invasive carcinoma | Female | <65 | I/II | Unknown | Unknown | SD | ||
| SRSF4 | insertion | Frame_Shift_Ins | novel | c.1238_1239insCCCCGTCTCTACTGAAAATACAAAAATTAGCCAGGCAT | p.Lys413AsnfsTer114 | p.K413Nfs*114 | Q08170 | protein_coding | TCGA-AO-A0JB-01 | Breast | breast invasive carcinoma | Female | <65 | III/IV | Chemotherapy | cyclophosphamide | SD | ||
| SRSF4 | SNV | Missense_Mutation | novel | c.71N>T | p.Gly24Val | p.G24V | Q08170 | protein_coding | deleterious(0.01) | probably_damaging(0.914) | TCGA-VS-A94Z-01 | Cervix | cervical & endocervical cancer | Female | <65 | I/II | Chemotherapy | cisplatin | CR |
| SRSF4 | SNV | Missense_Mutation | rs201863361 | c.1133G>A | p.Arg378Lys | p.R378K | Q08170 | protein_coding | tolerated_low_confidence(0.81) | benign(0) | TCGA-VS-A958-01 | Cervix | cervical & endocervical cancer | Female | <65 | I/II | Chemotherapy | cisplatin | CR |
| SRSF4 | SNV | Missense_Mutation | novel | c.961N>G | p.Arg321Gly | p.R321G | Q08170 | protein_coding | deleterious_low_confidence(0) | benign(0.051) | TCGA-AA-3811-01 | Colorectum | colon adenocarcinoma | Female | >=65 | III/IV | Unknown | Unknown | PD |
| SRSF4 | SNV | Missense_Mutation | c.1409N>A | p.Ser470Tyr | p.S470Y | Q08170 | protein_coding | deleterious_low_confidence(0) | probably_damaging(0.996) | TCGA-AA-A010-01 | Colorectum | colon adenocarcinoma | Female | <65 | I/II | Chemotherapy | folinic | CR |
| Page: 1 2 3 4 5 6 |
Top |
Related drugs of malignant transformation related genes |
| Identification of chemicals and drugs interact with genes involved in malignant transfromation |
| (DGIdb 4.0) |
| Entrez ID | Symbol | Category | Interaction Types | Drug Claim Name | Drug Name | PMIDs |
| Page: 1 |

Copyright 2023-Present -The University of Texas Health Science Center at Houston |