
|
|||||
|
 | |
| |
| |
| |
| |
| |
|
Gene: SRI |
Gene summary for SRI |
| Gene information | Species | Human | Gene symbol | SRI | Gene ID | 6717 |
| Gene name | sorcin | |
| Gene Alias | CP-22 | |
| Cytomap | 7q21.12 | |
| Gene Type | protein-coding | GO ID | GO:0001508 | UniProtAcc | P30626 |
Top |
Malignant transformation analysis |
| Identification of the aberrant gene expression in precancerous and cancerous lesions by comparing the gene expression of stem-like cells in diseased tissues with normal stem cells |
| Entrez ID | Symbol | Replicates | Species | Organ | Tissue | Adj P-value | Log2FC | Malignancy |
| 6717 | SRI | GSM4909282 | Human | Breast | IDC | 3.29e-02 | 2.73e-01 | -0.0288 |
| 6717 | SRI | GSM4909288 | Human | Breast | IDC | 7.79e-06 | 2.28e-02 | 0.0988 |
| 6717 | SRI | GSM4909294 | Human | Breast | IDC | 2.33e-03 | 9.88e-02 | 0.2022 |
| 6717 | SRI | GSM4909296 | Human | Breast | IDC | 2.67e-06 | 6.44e-02 | 0.1524 |
| 6717 | SRI | GSM4909297 | Human | Breast | IDC | 1.39e-21 | 3.34e-01 | 0.1517 |
| 6717 | SRI | GSM4909311 | Human | Breast | IDC | 4.30e-29 | -3.10e-01 | 0.1534 |
| 6717 | SRI | GSM4909312 | Human | Breast | IDC | 1.07e-06 | 2.71e-02 | 0.1552 |
| 6717 | SRI | GSM4909313 | Human | Breast | IDC | 1.33e-02 | -9.55e-02 | 0.0391 |
| 6717 | SRI | GSM4909315 | Human | Breast | IDC | 3.43e-10 | -3.65e-01 | 0.21 |
| 6717 | SRI | GSM4909316 | Human | Breast | IDC | 1.76e-03 | -2.99e-01 | 0.21 |
| 6717 | SRI | GSM4909319 | Human | Breast | IDC | 6.22e-31 | -3.79e-01 | 0.1563 |
| 6717 | SRI | GSM4909320 | Human | Breast | IDC | 3.60e-05 | -1.34e-01 | 0.1575 |
| 6717 | SRI | GSM4909321 | Human | Breast | IDC | 8.65e-12 | -6.99e-02 | 0.1559 |
| 6717 | SRI | brca1 | Human | Breast | Precancer | 1.26e-22 | 6.95e-01 | -0.0338 |
| 6717 | SRI | brca2 | Human | Breast | Precancer | 1.13e-27 | 6.65e-01 | -0.024 |
| 6717 | SRI | brca3 | Human | Breast | Precancer | 1.48e-34 | 6.80e-01 | -0.0263 |
| 6717 | SRI | brca10 | Human | Breast | Precancer | 4.10e-03 | 3.04e-01 | -0.0029 |
| 6717 | SRI | M2 | Human | Breast | IDC | 3.71e-09 | 3.87e-01 | 0.21 |
| 6717 | SRI | NCCBC14 | Human | Breast | DCIS | 2.72e-14 | 8.87e-02 | 0.2021 |
| 6717 | SRI | NCCBC5 | Human | Breast | DCIS | 1.48e-12 | -1.40e-01 | 0.2046 |
| Page: 1 2 3 4 5 6 7 8 9 10 11 12 13 14 |
| Tissue | Expression Dynamics | Abbreviation |
| Breast |  | IDC: Invasive ductal carcinoma |
| DCIS: Ductal carcinoma in situ | ||
| Precancer(BRCA1-mut): Precancerous lesion from BRCA1 mutation carriers | ||
| Cervix |  | CC: Cervix cancer |
| HSIL_HPV: HPV-infected high-grade squamous intraepithelial lesions | ||
| N_HPV: HPV-infected normal cervix | ||
| Colorectum (GSE201348) |  | FAP: Familial adenomatous polyposis |
| CRC: Colorectal cancer | ||
| Colorectum (HTA11) | 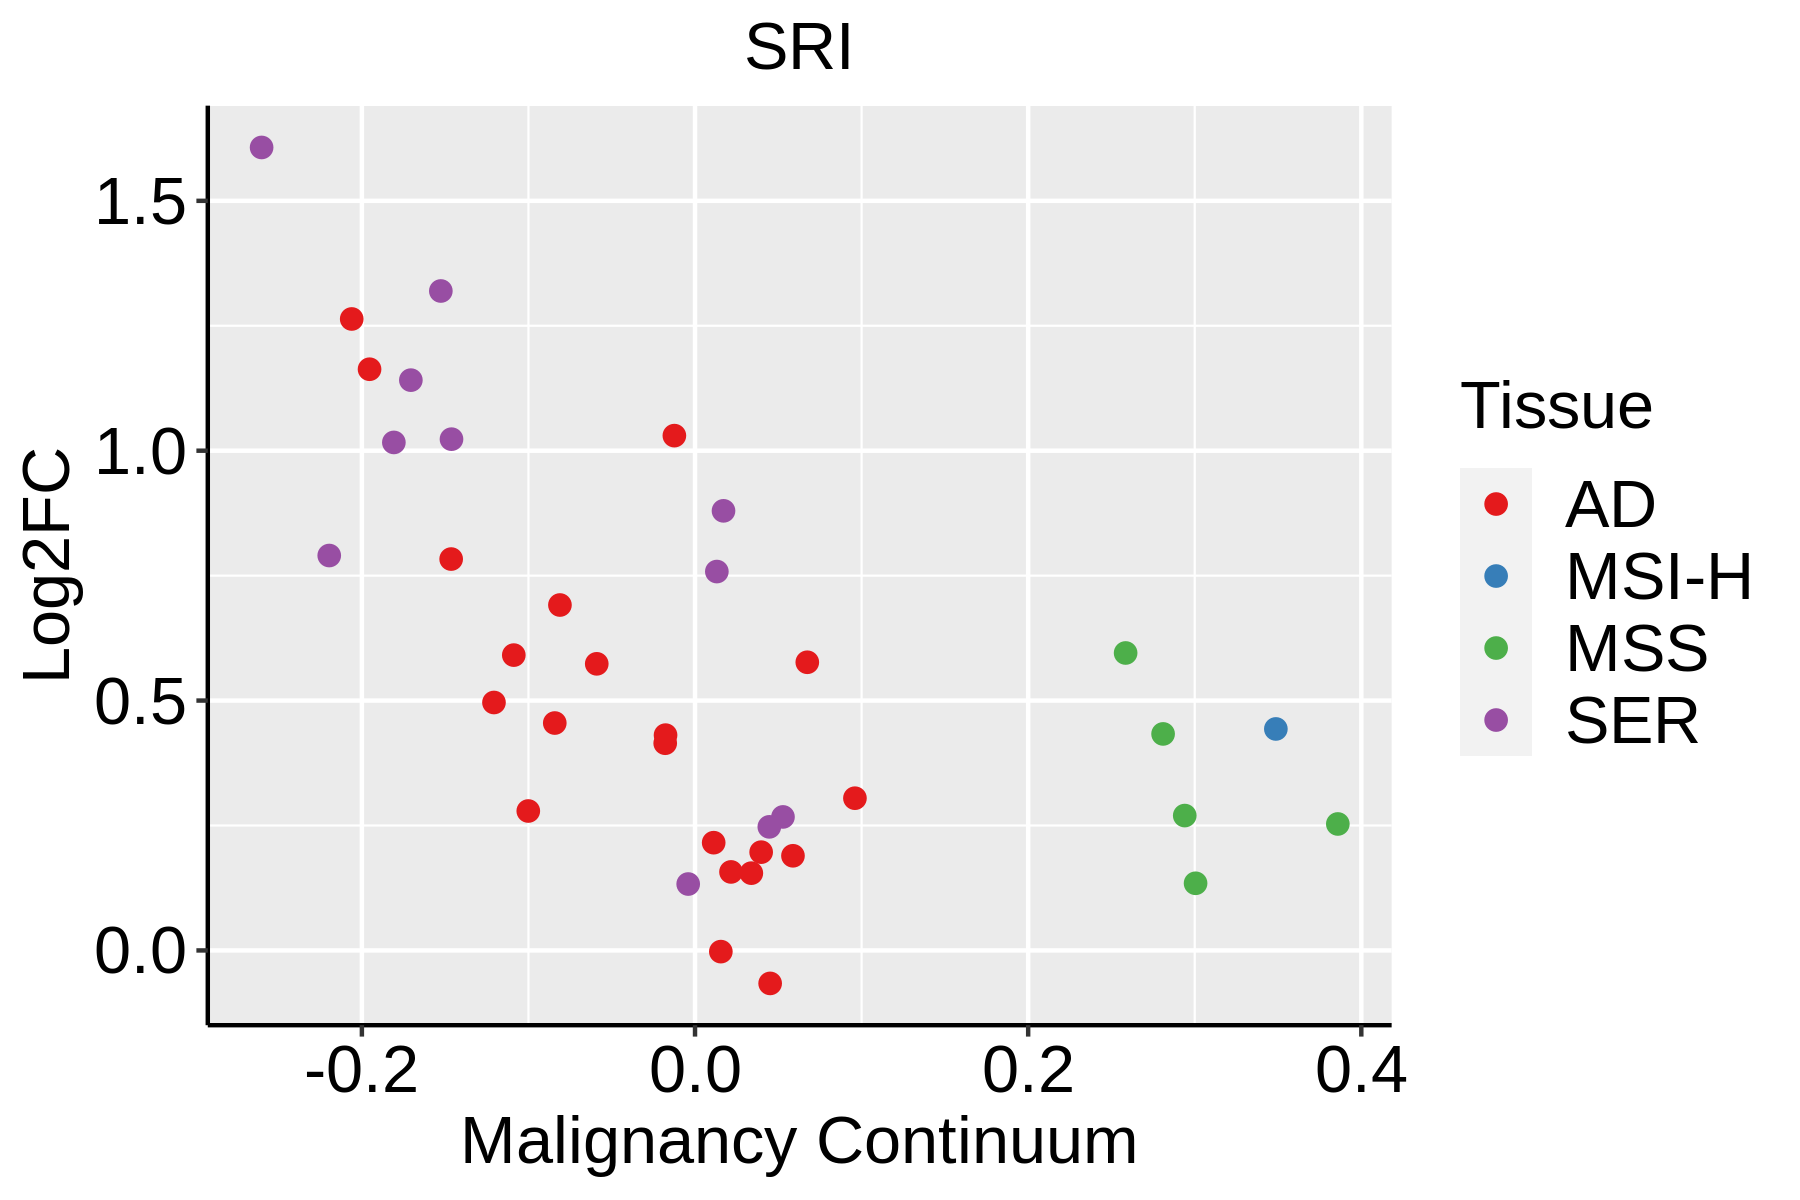 | AD: Adenomas |
| SER: Sessile serrated lesions | ||
| MSI-H: Microsatellite-high colorectal cancer | ||
| MSS: Microsatellite stable colorectal cancer | ||
| Endometrium | 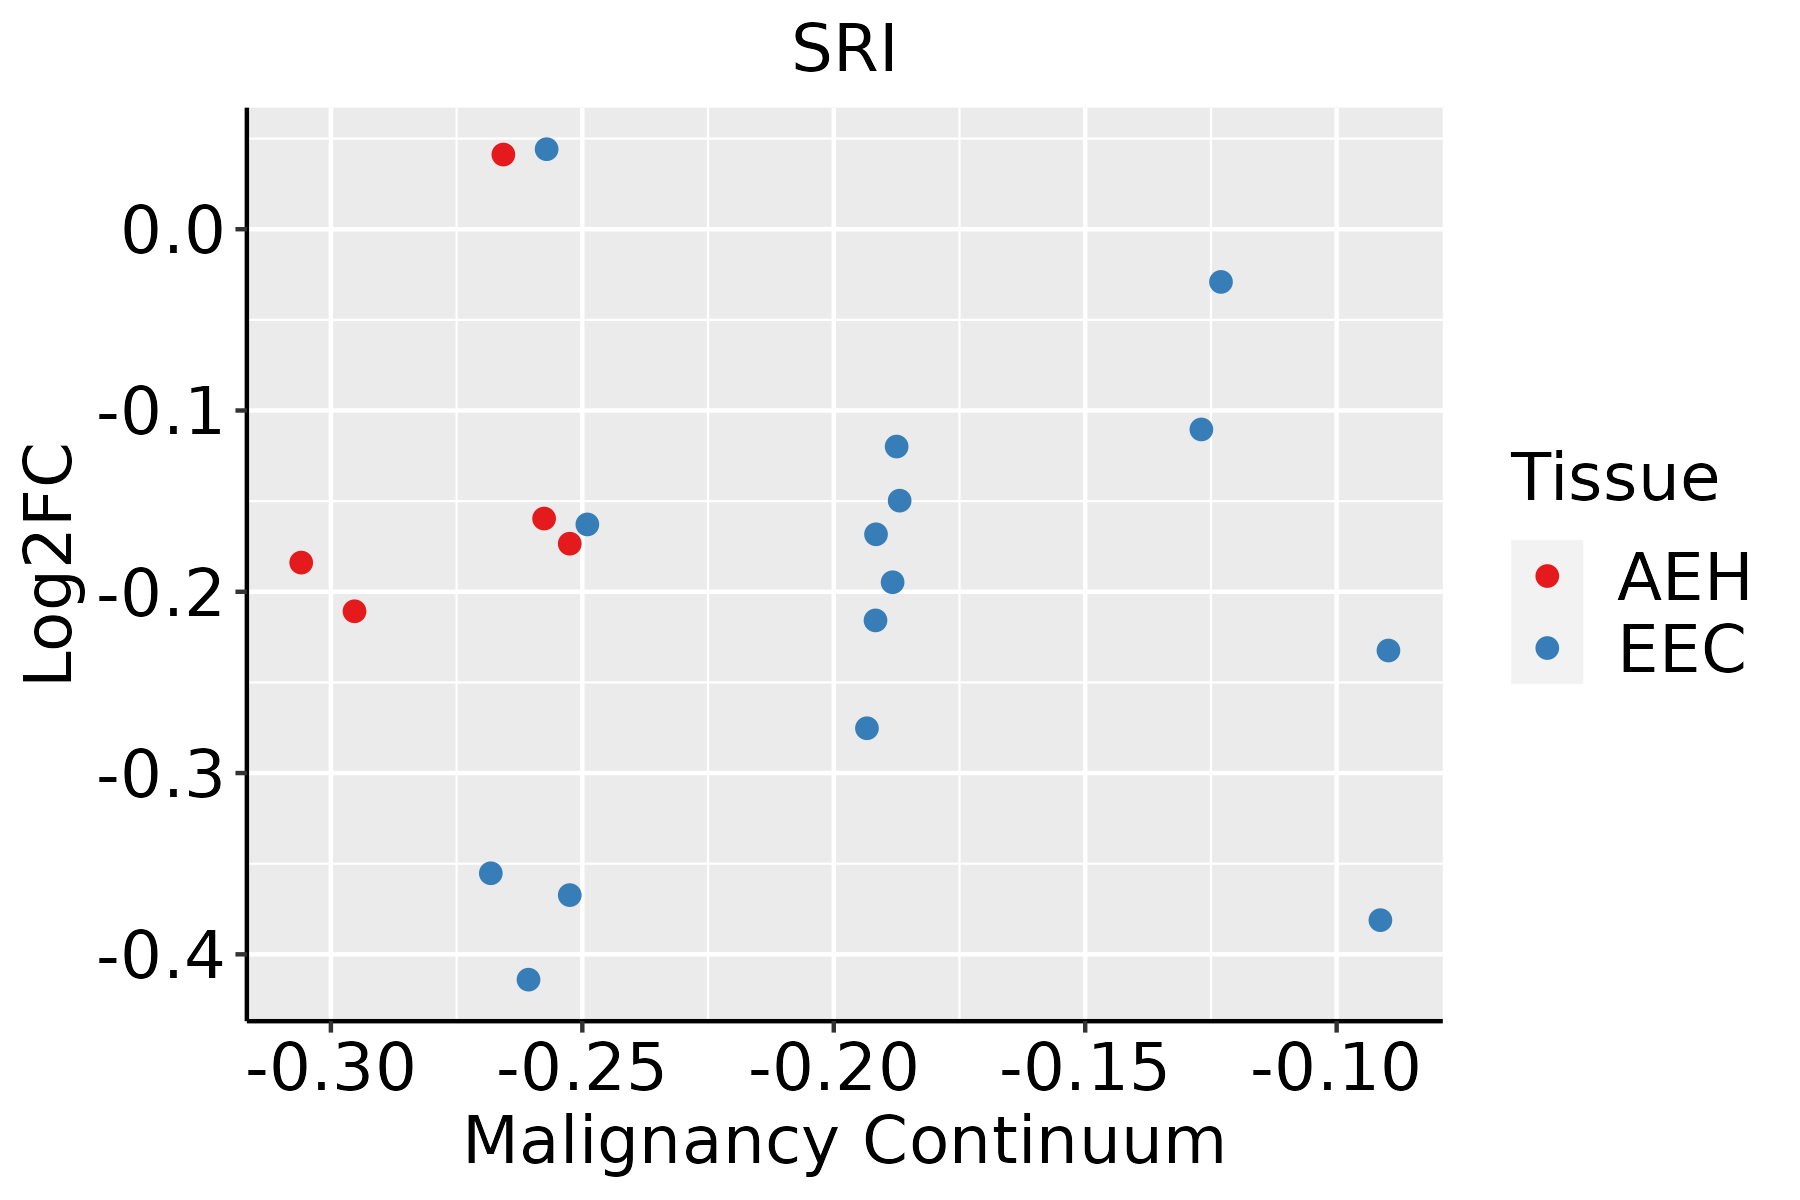 | AEH: Atypical endometrial hyperplasia |
| EEC: Endometrioid Cancer | ||
| Esophagus |  | ESCC: Esophageal squamous cell carcinoma |
| HGIN: High-grade intraepithelial neoplasias | ||
| LGIN: Low-grade intraepithelial neoplasias | ||
| GC |  | CAG: Chronic atrophic gastritis |
| CAG with IM: Chronic atrophic gastritis with intestinal metaplasia | ||
| CSG: Chronic superficial gastritis | ||
| GC: Gastric cancer | ||
| SIM: Severe intestinal metaplasia | ||
| WIM: Wild intestinal metaplasia | ||
| Liver | 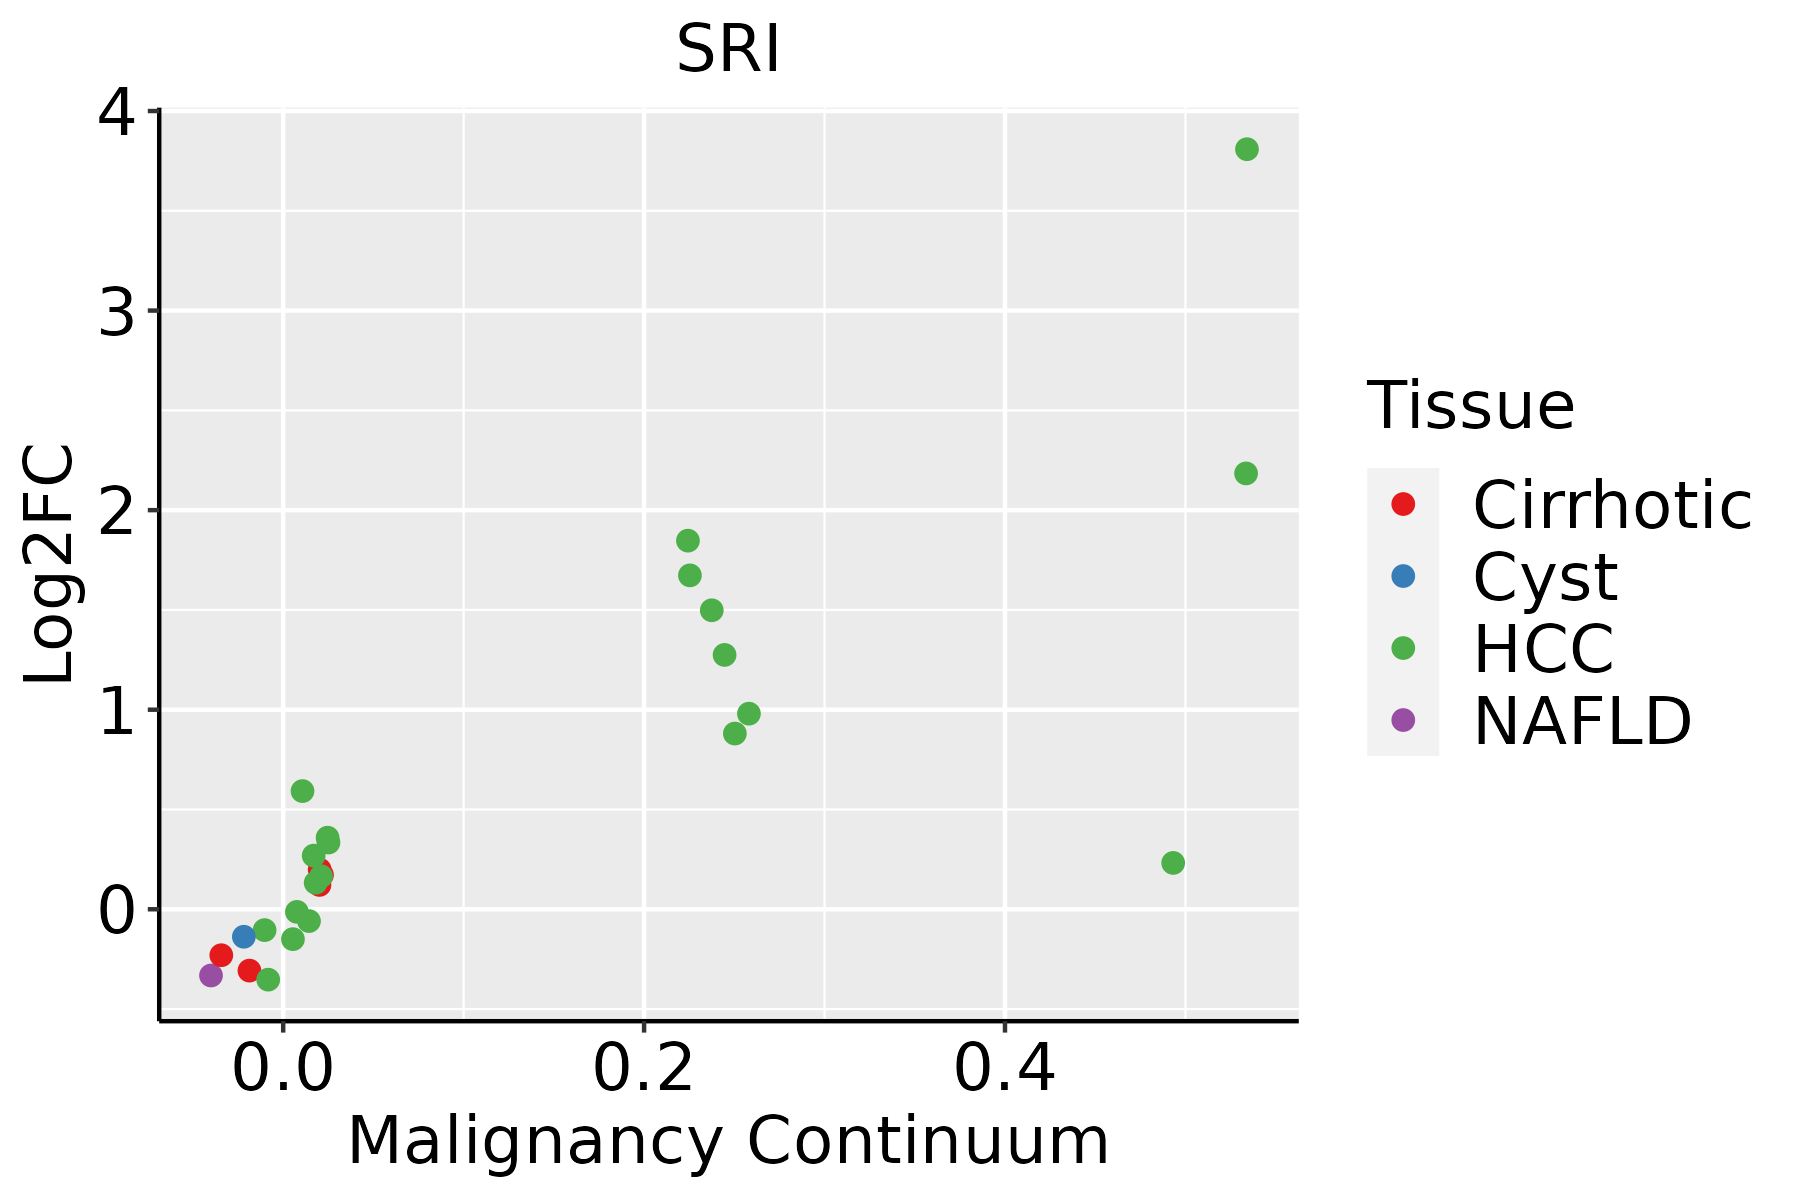 | HCC: Hepatocellular carcinoma |
| NAFLD: Non-alcoholic fatty liver disease | ||
| Oral Cavity |  | EOLP: Erosive Oral lichen planus |
| LP: leukoplakia | ||
| NEOLP: Non-erosive oral lichen planus | ||
| OSCC: Oral squamous cell carcinoma | ||
| Prostate | 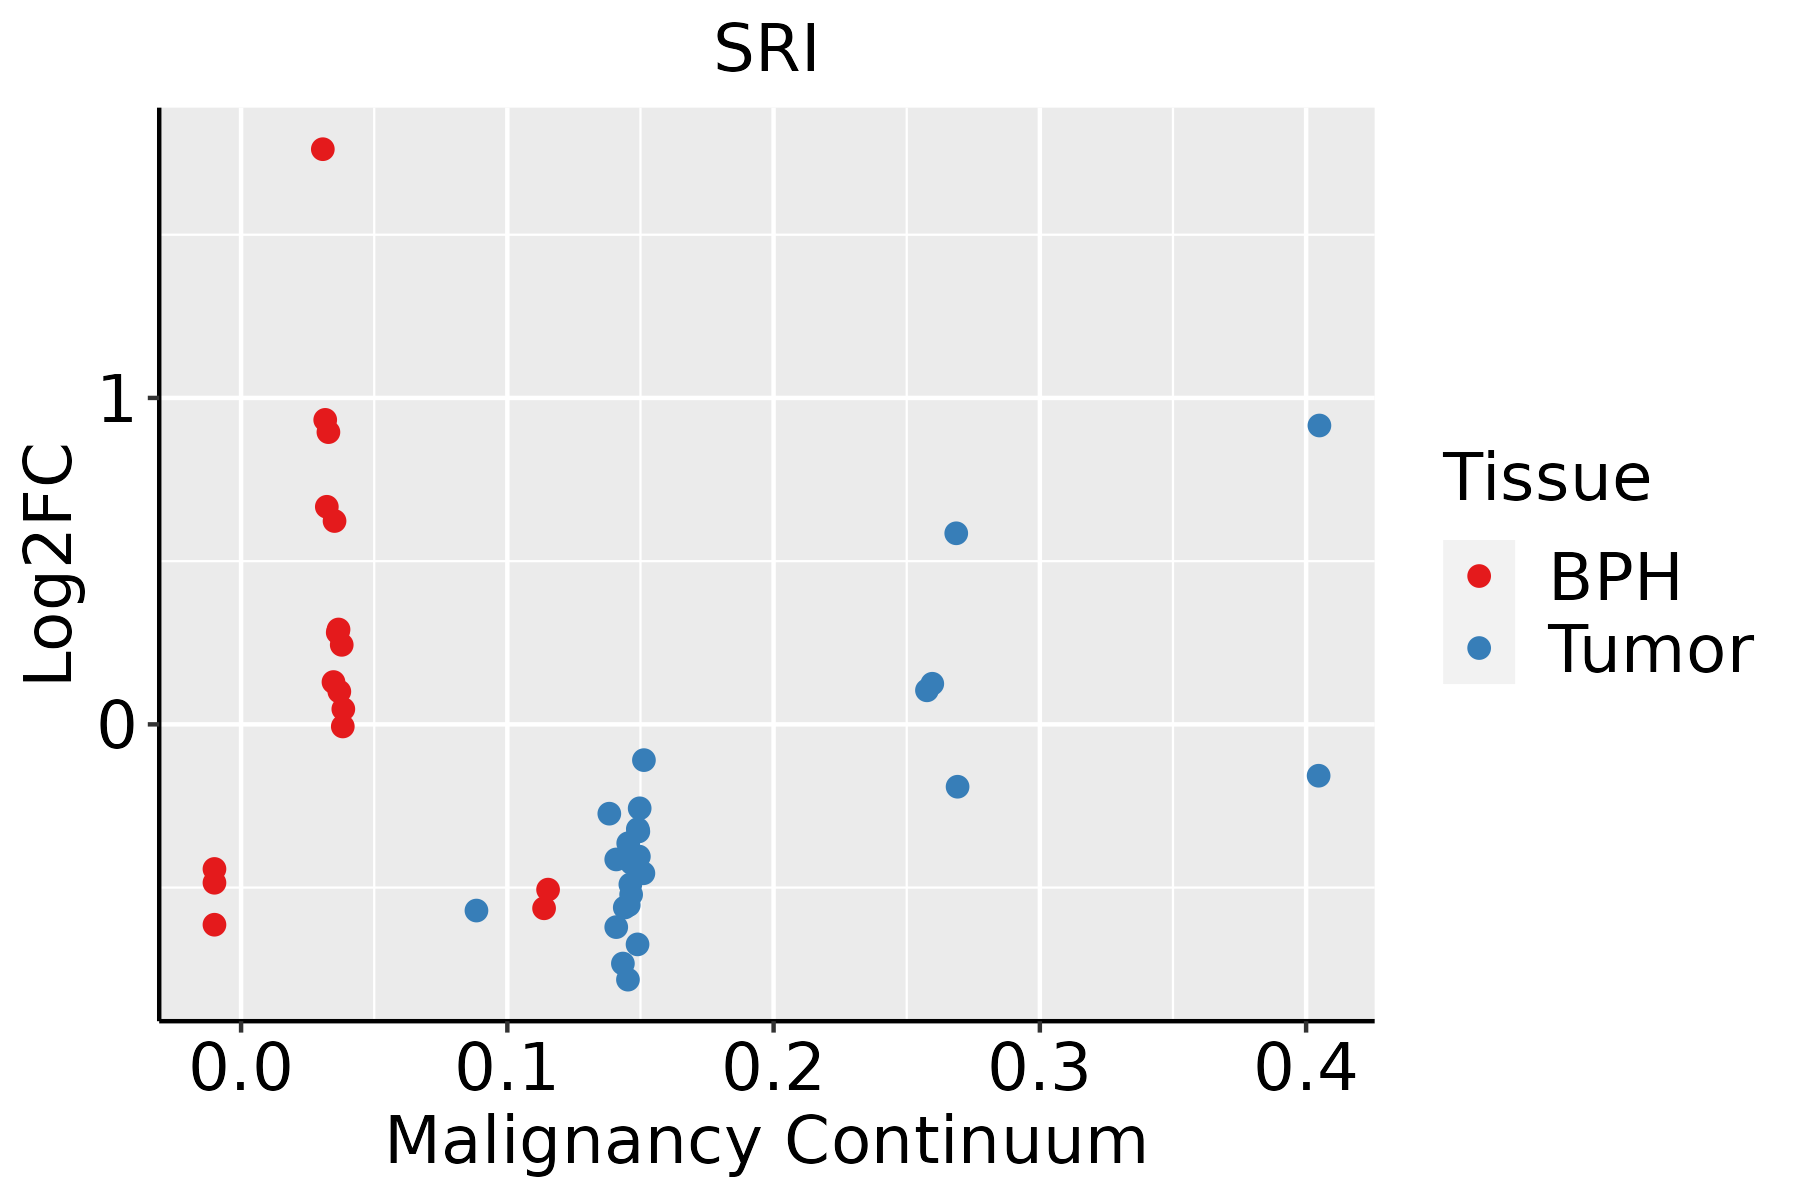 | BPH: Benign Prostatic Hyperplasia |
| Skin | 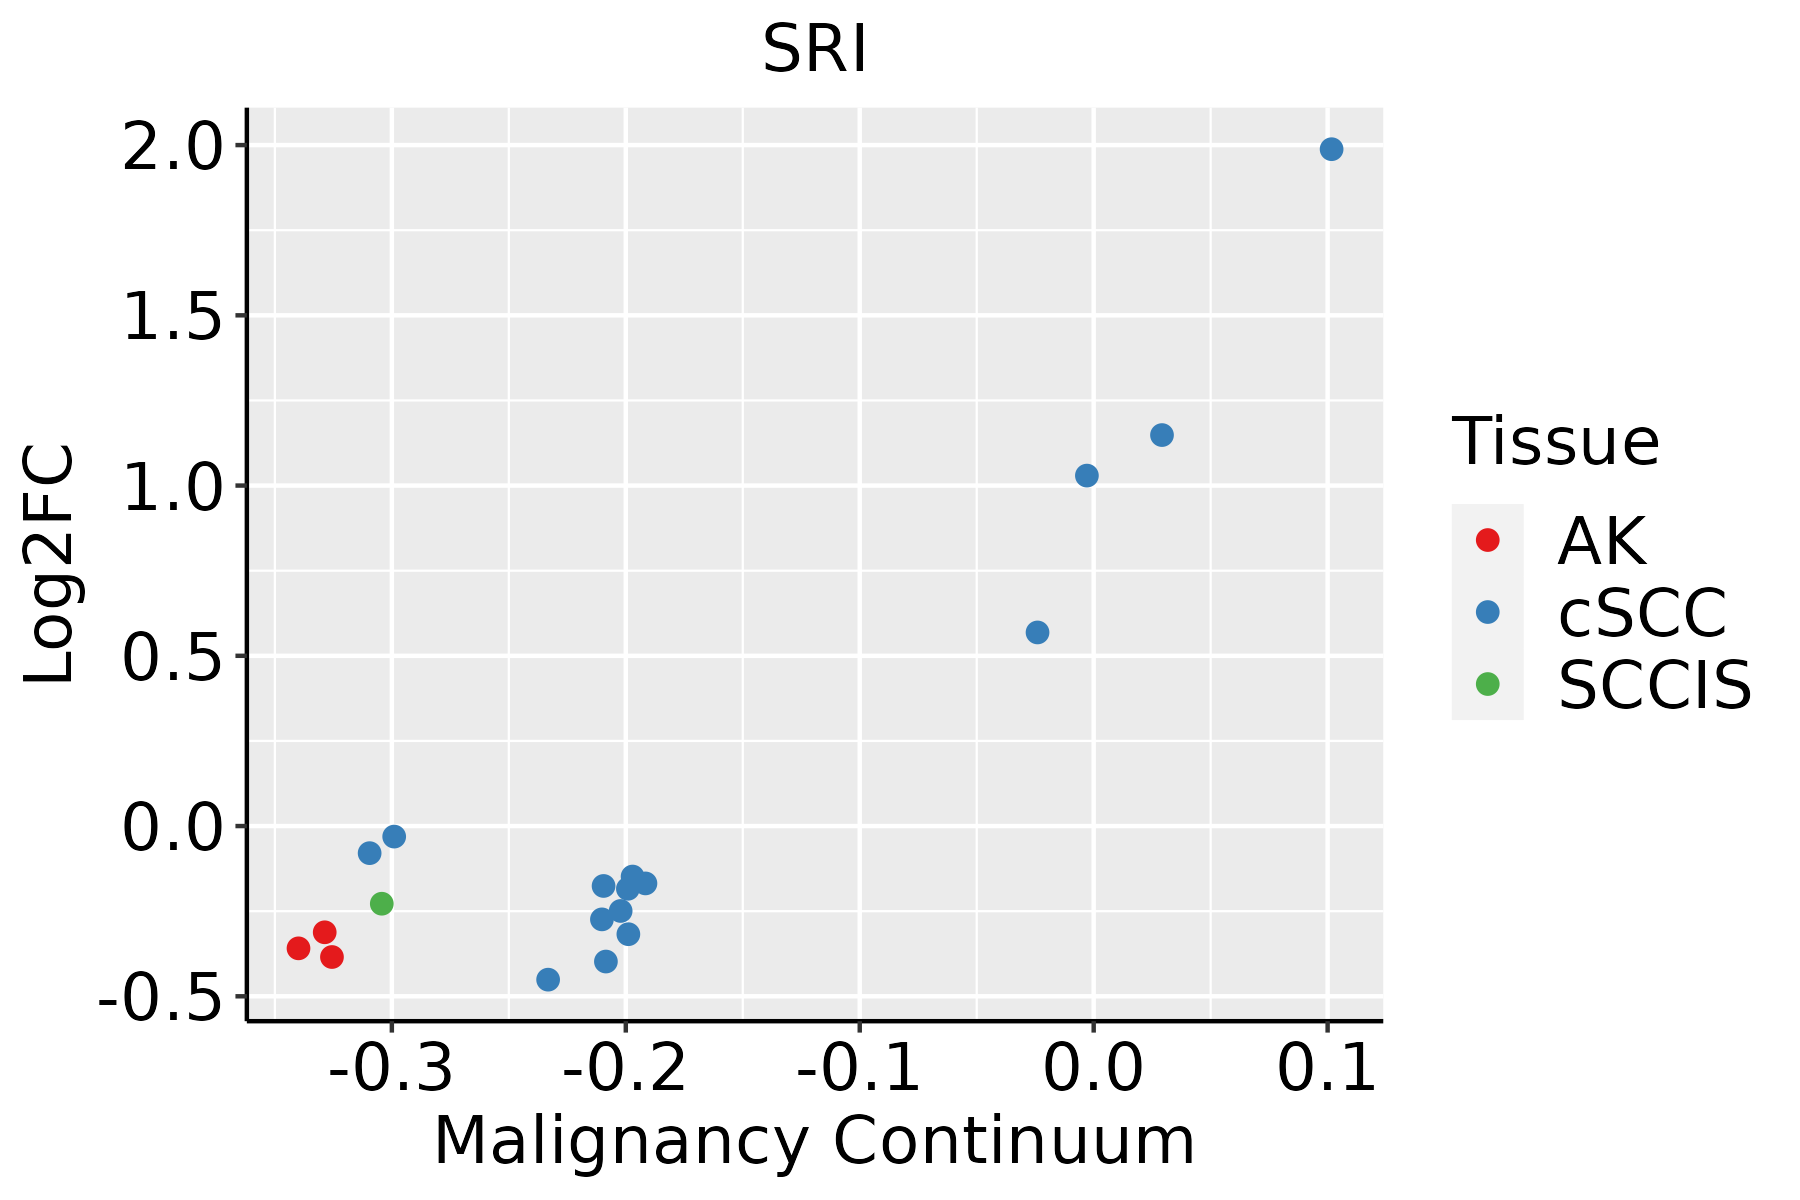 | AK: Actinic keratosis |
| cSCC: Cutaneous squamous cell carcinoma | ||
| SCCIS:squamous cell carcinoma in situ | ||
| Thyroid | 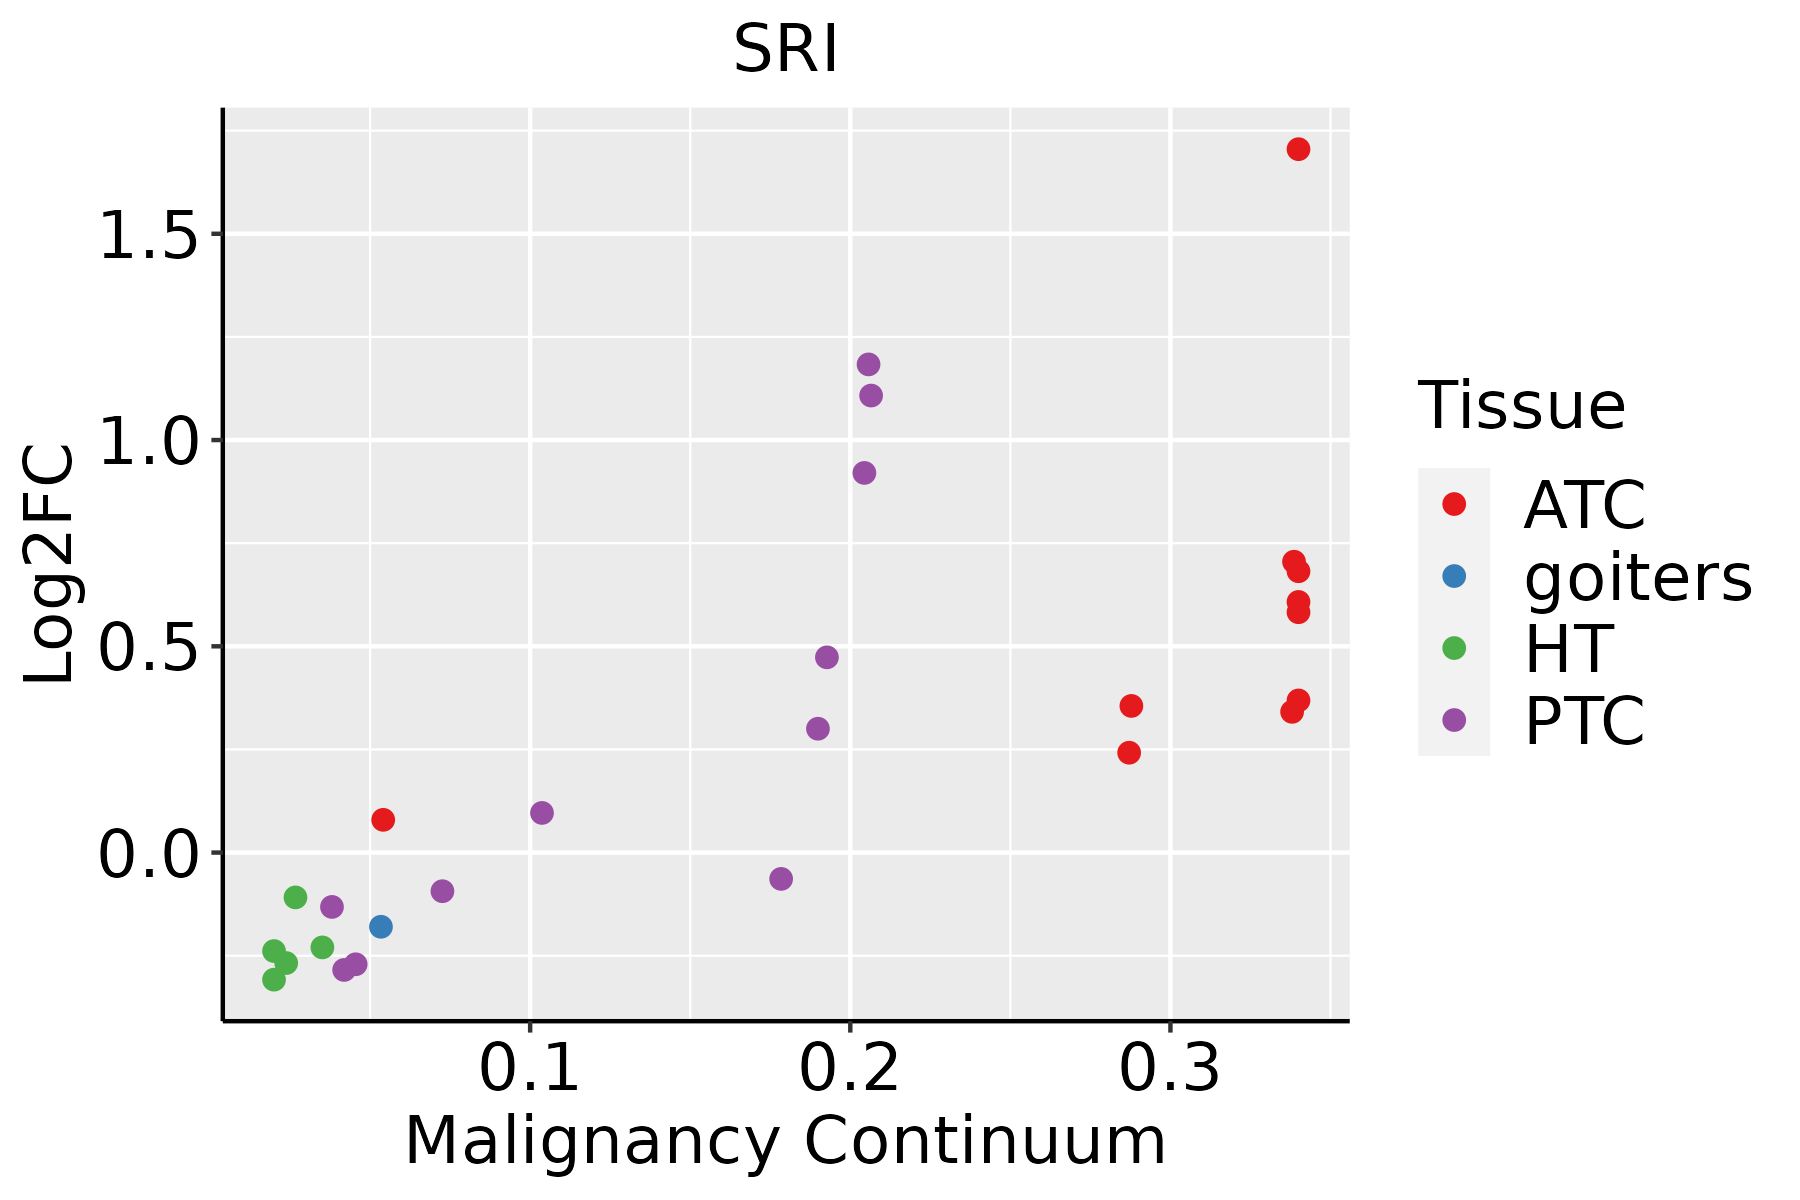 | ATC: Anaplastic thyroid cancer |
| HT: Hashimoto's thyroiditis | ||
| PTC: Papillary thyroid cancer |
| ∗log2FC in expression of this searched gene in stem-like cells from each diseased tissue sample relative to stem-like cells in normal samples in each tissue plotted against the malignancy continuum. Samples are colored based on if they are from different disease stage. |
Top |
Malignant transformation related pathway analysis |
| Find out the enriched GO biological processes and KEGG pathways involved in transition from healthy to precancer to cancer |
| Tissue | Disease Stage | Enriched GO biological Processes |
| Colorectum | AD |  |
| Colorectum | SER |  |
| Colorectum | MSS |  |
| Colorectum | MSI-H |  |
| Colorectum | FAP |  |
| ∗Top 15 enriched GO BP terms are showed in the bar plot of each disease state in each tissue. Each row represents a significant GO biological process which is colored according to the -log10(p.adjust). |
| Page: 1 2 3 4 5 6 7 8 9 |
| GO ID | Tissue | Disease Stage | Description | Gene Ratio | Bg Ratio | pvalue | p.adjust | Count |
| GO:00300487 | Cervix | CC | actin filament-based movement | 29/2311 | 127/18723 | 6.91e-04 | 6.33e-03 | 29 |
| GO:00425939 | Cervix | CC | glucose homeostasis | 50/2311 | 258/18723 | 7.57e-04 | 6.76e-03 | 50 |
| GO:00335009 | Cervix | CC | carbohydrate homeostasis | 50/2311 | 259/18723 | 8.28e-04 | 7.22e-03 | 50 |
| GO:19018446 | Cervix | CC | regulation of cell communication by electrical coupling involved in cardiac conduction | 6/2311 | 11/18723 | 9.33e-04 | 7.86e-03 | 6 |
| GO:00016788 | Cervix | CC | cellular glucose homeostasis | 36/2311 | 172/18723 | 9.65e-04 | 8.09e-03 | 36 |
| GO:00097499 | Cervix | CC | response to glucose | 42/2311 | 212/18723 | 1.23e-03 | 9.87e-03 | 42 |
| GO:00511009 | Cervix | CC | negative regulation of binding | 34/2311 | 162/18723 | 1.25e-03 | 1.00e-02 | 34 |
| GO:00512384 | Cervix | CC | sequestering of metal ion | 7/2311 | 16/18723 | 1.79e-03 | 1.34e-02 | 7 |
| GO:00860644 | Cervix | CC | cell communication by electrical coupling involved in cardiac conduction | 9/2311 | 25/18723 | 2.09e-03 | 1.52e-02 | 9 |
| GO:00507148 | Cervix | CC | positive regulation of protein secretion | 29/2311 | 137/18723 | 2.40e-03 | 1.70e-02 | 29 |
| GO:00713229 | Cervix | CC | cellular response to carbohydrate stimulus | 33/2311 | 163/18723 | 2.71e-03 | 1.85e-02 | 33 |
| GO:00075173 | Cervix | CC | muscle organ development | 58/2311 | 327/18723 | 2.73e-03 | 1.85e-02 | 58 |
| GO:00713338 | Cervix | CC | cellular response to glucose stimulus | 31/2311 | 151/18723 | 2.86e-03 | 1.91e-02 | 31 |
| GO:00713318 | Cervix | CC | cellular response to hexose stimulus | 31/2311 | 153/18723 | 3.53e-03 | 2.27e-02 | 31 |
| GO:00713268 | Cervix | CC | cellular response to monosaccharide stimulus | 31/2311 | 154/18723 | 3.90e-03 | 2.46e-02 | 31 |
| GO:00611785 | Cervix | CC | regulation of insulin secretion involved in cellular response to glucose stimulus | 16/2311 | 64/18723 | 4.05e-03 | 2.52e-02 | 16 |
| GO:00551174 | Cervix | CC | regulation of cardiac muscle contraction | 18/2311 | 77/18723 | 5.15e-03 | 3.03e-02 | 18 |
| GO:00320245 | Cervix | CC | positive regulation of insulin secretion | 18/2311 | 78/18723 | 5.94e-03 | 3.40e-02 | 18 |
| GO:00860048 | Cervix | CC | regulation of cardiac muscle cell contraction | 10/2311 | 34/18723 | 6.40e-03 | 3.58e-02 | 10 |
| GO:00357734 | Cervix | CC | insulin secretion involved in cellular response to glucose stimulus | 17/2311 | 73/18723 | 6.71e-03 | 3.70e-02 | 17 |
| Page: 1 2 3 4 5 6 7 8 9 10 11 12 13 14 15 16 17 18 19 20 21 22 23 24 25 26 27 28 29 30 31 32 33 34 35 36 37 38 39 40 41 42 43 44 45 46 47 48 49 50 51 52 53 |
| Pathway ID | Tissue | Disease Stage | Description | Gene Ratio | Bg Ratio | pvalue | p.adjust | qvalue | Count |
| Page: 1 |
Top |
Cell-cell communication analysis |
| Identification of potential cell-cell interactions between two cell types and their ligand-receptor pairs for different disease states |
| Ligand | Receptor | LRpair | Pathway | Tissue | Disease Stage |
| Page: 1 |
Top |
Single-cell gene regulatory network inference analysis |
| Find out the significant the regulons (TFs) and the target genes of each regulon across cell types for different disease states |
| TF | Cell Type | Tissue | Disease Stage | Target Gene | RSS | Regulon Activity |
| ∗The dot plots of a searched regulon are shown for all cell subpopulations in each disease state of each tissue based on the regulon specific score inferred using pySCENIC and by calculating the average expression. |
| Page: 1 |
Top |
Somatic mutation of malignant transformation related genes |
| Annotation of somatic variants for genes involved in malignant transformation |
| Hugo Symbol | Variant Class | Variant Classification | dbSNP RS | HGVSc | HGVSp | HGVSp Short | SWISSPROT | BIOTYPE | SIFT | PolyPhen | Tumor Sample Barcode | Tissue | Histology | Sex | Age | Stage | Therapy Types | Drugs | Outcome |
| SRI | SNV | Missense_Mutation | rs781565827 | c.521G>A | p.Arg174Gln | p.R174Q | P30626 | protein_coding | tolerated(0.05) | benign(0.227) | TCGA-AN-A046-01 | Breast | breast invasive carcinoma | Female | >=65 | I/II | Unknown | Unknown | SD |
| SRI | SNV | Missense_Mutation | novel | c.277A>G | p.Asn93Asp | p.N93D | P30626 | protein_coding | deleterious(0.02) | benign(0.02) | TCGA-2W-A8YY-01 | Cervix | cervical & endocervical cancer | Female | <65 | I/II | Chemotherapy | cisplatin | CR |
| SRI | SNV | Missense_Mutation | c.29G>T | p.Gly10Val | p.G10V | P30626 | protein_coding | tolerated(0.38) | benign(0) | TCGA-G4-6294-01 | Colorectum | colon adenocarcinoma | Male | >=65 | III/IV | Chemotherapy | fluorouracil | PD | |
| SRI | SNV | Missense_Mutation | c.28G>T | p.Gly10Cys | p.G10C | P30626 | protein_coding | tolerated(0.11) | benign(0.131) | TCGA-G4-6294-01 | Colorectum | colon adenocarcinoma | Male | >=65 | III/IV | Chemotherapy | fluorouracil | PD | |
| SRI | SNV | Missense_Mutation | rs748393938 | c.440G>A | p.Arg147Gln | p.R147Q | P30626 | protein_coding | deleterious(0) | probably_damaging(1) | TCGA-AG-3732-01 | Colorectum | rectum adenocarcinoma | Female | >=65 | I/II | Chemotherapy | capecitabine | SD |
| SRI | SNV | Missense_Mutation | rs779760808 | c.268A>G | p.Met90Val | p.M90V | P30626 | protein_coding | deleterious(0) | probably_damaging(0.911) | TCGA-A5-A0G2-01 | Endometrium | uterine corpus endometrioid carcinoma | Female | <65 | III/IV | Unknown | Unknown | SD |
| SRI | SNV | Missense_Mutation | c.317N>T | p.Arg106Ile | p.R106I | P30626 | protein_coding | deleterious(0) | possibly_damaging(0.849) | TCGA-AP-A0LM-01 | Endometrium | uterine corpus endometrioid carcinoma | Female | <65 | III/IV | Chemotherapy | cisplatin | SD | |
| SRI | SNV | Missense_Mutation | novel | c.527N>A | p.Arg176Gln | p.R176Q | P30626 | protein_coding | deleterious(0) | probably_damaging(0.98) | TCGA-AP-A1DK-01 | Endometrium | uterine corpus endometrioid carcinoma | Female | <65 | I/II | Unknown | Unknown | SD |
| SRI | SNV | Missense_Mutation | c.481N>A | p.Ala161Thr | p.A161T | P30626 | protein_coding | tolerated(0.05) | benign(0.394) | TCGA-B5-A3FA-01 | Endometrium | uterine corpus endometrioid carcinoma | Female | >=65 | I/II | Unknown | Unknown | SD | |
| SRI | SNV | Missense_Mutation | c.481N>A | p.Ala161Thr | p.A161T | P30626 | protein_coding | tolerated(0.05) | benign(0.394) | TCGA-D1-A16X-01 | Endometrium | uterine corpus endometrioid carcinoma | Female | <65 | I/II | Unknown | Unknown | SD |
| Page: 1 2 |
Top |
Related drugs of malignant transformation related genes |
| Identification of chemicals and drugs interact with genes involved in malignant transfromation |
| (DGIdb 4.0) |
| Entrez ID | Symbol | Category | Interaction Types | Drug Claim Name | Drug Name | PMIDs |
| 6717 | SRI | NA | ADM | 2568983 | ||
| 6717 | SRI | NA | ADRIAMYCIN | ADRIAMYCIN | 1975203 | |
| 6717 | SRI | NA | COLCHICINE | COLCHICINE | 1975203 | |
| 6717 | SRI | NA | ISOPROTERENOL | ISOPROTERENOL | 15754088 | |
| 6717 | SRI | NA | VINCRISTINE | VINCRISTINE | 1975203 |
| Page: 1 |

Copyright 2023-Present -The University of Texas Health Science Center at Houston |