
|
|||||
|
 | |
| |
| |
| |
| |
| |
|
Gene: SPTAN1 |
Gene summary for SPTAN1 |
| Gene information | Species | Human | Gene symbol | SPTAN1 | Gene ID | 6709 |
| Gene name | spectrin alpha, non-erythrocytic 1 | |
| Gene Alias | DEE5 | |
| Cytomap | 9q34.11 | |
| Gene Type | protein-coding | GO ID | GO:0006996 | UniProtAcc | Q13813 |
Top |
Malignant transformation analysis |
| Identification of the aberrant gene expression in precancerous and cancerous lesions by comparing the gene expression of stem-like cells in diseased tissues with normal stem cells |
| Entrez ID | Symbol | Replicates | Species | Organ | Tissue | Adj P-value | Log2FC | Malignancy |
| 6709 | SPTAN1 | CA_HPV_1 | Human | Cervix | CC | 4.22e-05 | -1.40e-01 | 0.0264 |
| 6709 | SPTAN1 | CCI_2 | Human | Cervix | CC | 4.40e-04 | 7.75e-01 | 0.5249 |
| 6709 | SPTAN1 | CCI_3 | Human | Cervix | CC | 1.35e-06 | 6.75e-01 | 0.516 |
| 6709 | SPTAN1 | L1 | Human | Cervix | CC | 4.94e-03 | -3.62e-02 | 0.0802 |
| 6709 | SPTAN1 | HTA11_3410_2000001011 | Human | Colorectum | AD | 2.77e-11 | 4.41e-01 | 0.0155 |
| 6709 | SPTAN1 | HTA11_2487_2000001011 | Human | Colorectum | SER | 5.74e-16 | 7.66e-01 | -0.1808 |
| 6709 | SPTAN1 | HTA11_1938_2000001011 | Human | Colorectum | AD | 8.21e-20 | 8.56e-01 | -0.0811 |
| 6709 | SPTAN1 | HTA11_78_2000001011 | Human | Colorectum | AD | 4.10e-07 | 5.12e-01 | -0.1088 |
| 6709 | SPTAN1 | HTA11_347_2000001011 | Human | Colorectum | AD | 1.26e-36 | 9.94e-01 | -0.1954 |
| 6709 | SPTAN1 | HTA11_411_2000001011 | Human | Colorectum | SER | 1.75e-09 | 1.22e+00 | -0.2602 |
| 6709 | SPTAN1 | HTA11_3361_2000001011 | Human | Colorectum | AD | 2.39e-02 | 4.64e-01 | -0.1207 |
| 6709 | SPTAN1 | HTA11_83_2000001011 | Human | Colorectum | SER | 2.52e-02 | 3.53e-01 | -0.1526 |
| 6709 | SPTAN1 | HTA11_696_2000001011 | Human | Colorectum | AD | 1.11e-14 | 7.28e-01 | -0.1464 |
| 6709 | SPTAN1 | HTA11_866_2000001011 | Human | Colorectum | AD | 6.96e-07 | 5.08e-01 | -0.1001 |
| 6709 | SPTAN1 | HTA11_1391_2000001011 | Human | Colorectum | AD | 7.76e-14 | 7.30e-01 | -0.059 |
| 6709 | SPTAN1 | HTA11_5212_2000001011 | Human | Colorectum | AD | 2.71e-04 | 5.76e-01 | -0.2061 |
| 6709 | SPTAN1 | HTA11_546_2000001011 | Human | Colorectum | AD | 1.05e-03 | 4.43e-01 | -0.0842 |
| 6709 | SPTAN1 | HTA11_7862_2000001011 | Human | Colorectum | AD | 3.81e-03 | 4.53e-01 | -0.0179 |
| 6709 | SPTAN1 | HTA11_866_3004761011 | Human | Colorectum | AD | 1.31e-18 | 8.22e-01 | 0.096 |
| 6709 | SPTAN1 | HTA11_4255_2000001011 | Human | Colorectum | SER | 1.25e-02 | 5.46e-01 | 0.0446 |
| Page: 1 2 3 4 5 6 7 8 9 10 |
| Tissue | Expression Dynamics | Abbreviation |
| Cervix |  | CC: Cervix cancer |
| HSIL_HPV: HPV-infected high-grade squamous intraepithelial lesions | ||
| N_HPV: HPV-infected normal cervix | ||
| Colorectum (GSE201348) |  | FAP: Familial adenomatous polyposis |
| CRC: Colorectal cancer | ||
| Colorectum (HTA11) |  | AD: Adenomas |
| SER: Sessile serrated lesions | ||
| MSI-H: Microsatellite-high colorectal cancer | ||
| MSS: Microsatellite stable colorectal cancer | ||
| Esophagus | 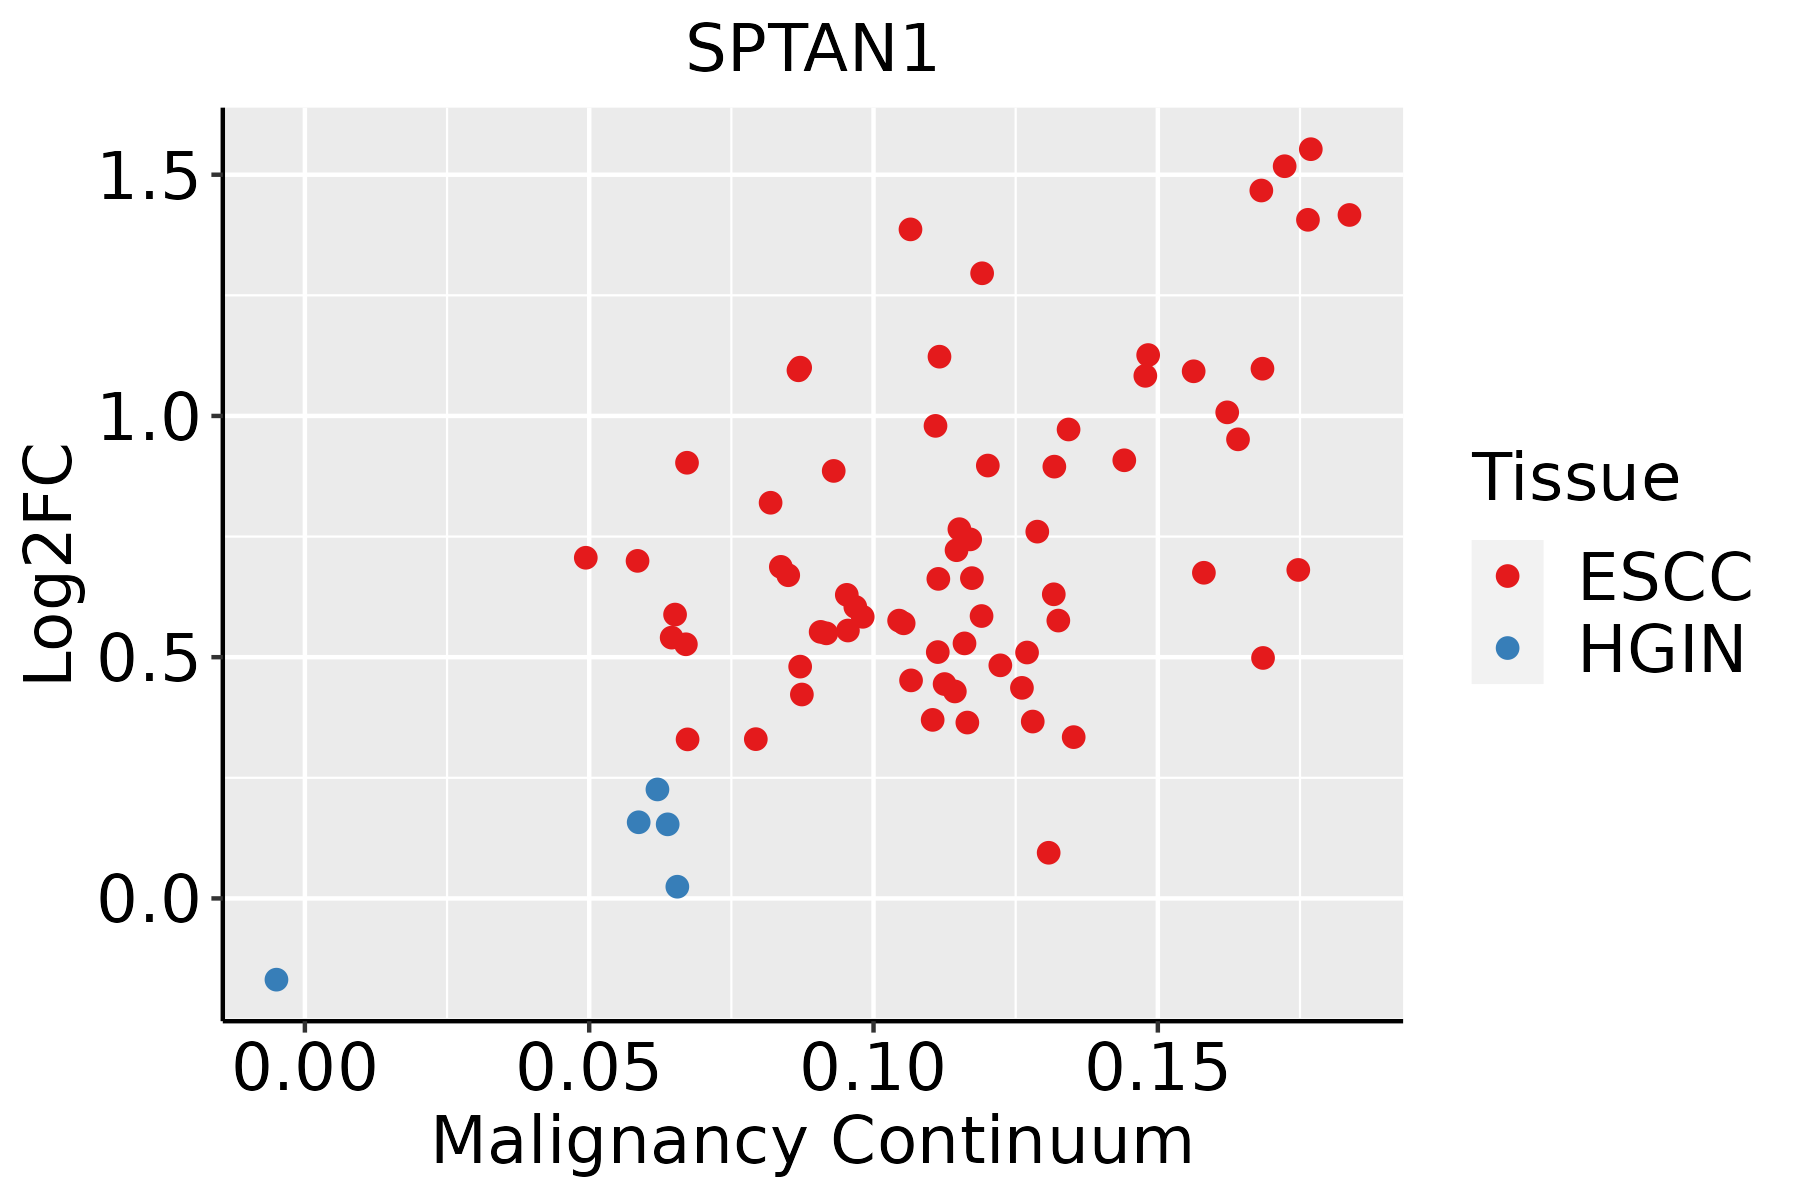 | ESCC: Esophageal squamous cell carcinoma |
| HGIN: High-grade intraepithelial neoplasias | ||
| LGIN: Low-grade intraepithelial neoplasias | ||
| Liver |  | HCC: Hepatocellular carcinoma |
| NAFLD: Non-alcoholic fatty liver disease | ||
| Lung | 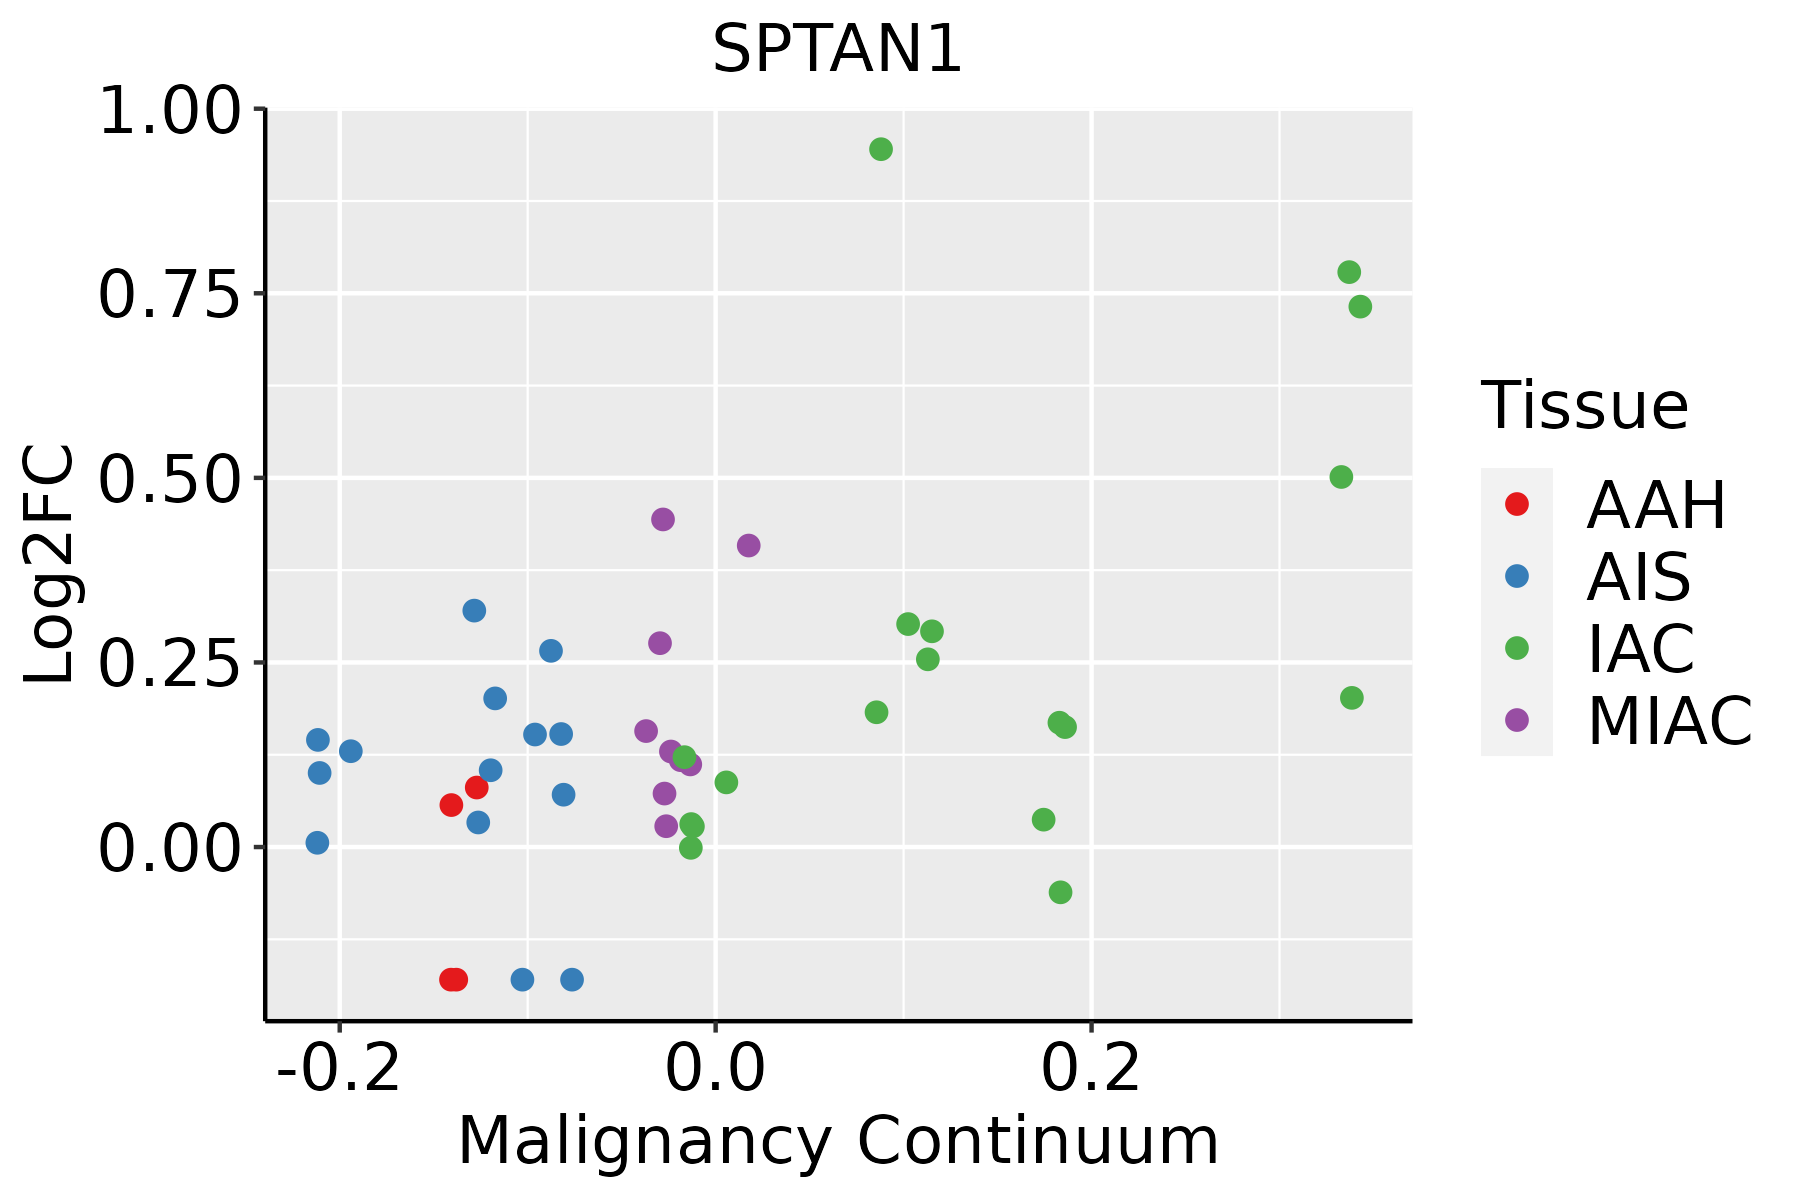 | AAH: Atypical adenomatous hyperplasia |
| AIS: Adenocarcinoma in situ | ||
| IAC: Invasive lung adenocarcinoma | ||
| MIA: Minimally invasive adenocarcinoma | ||
| Oral Cavity | 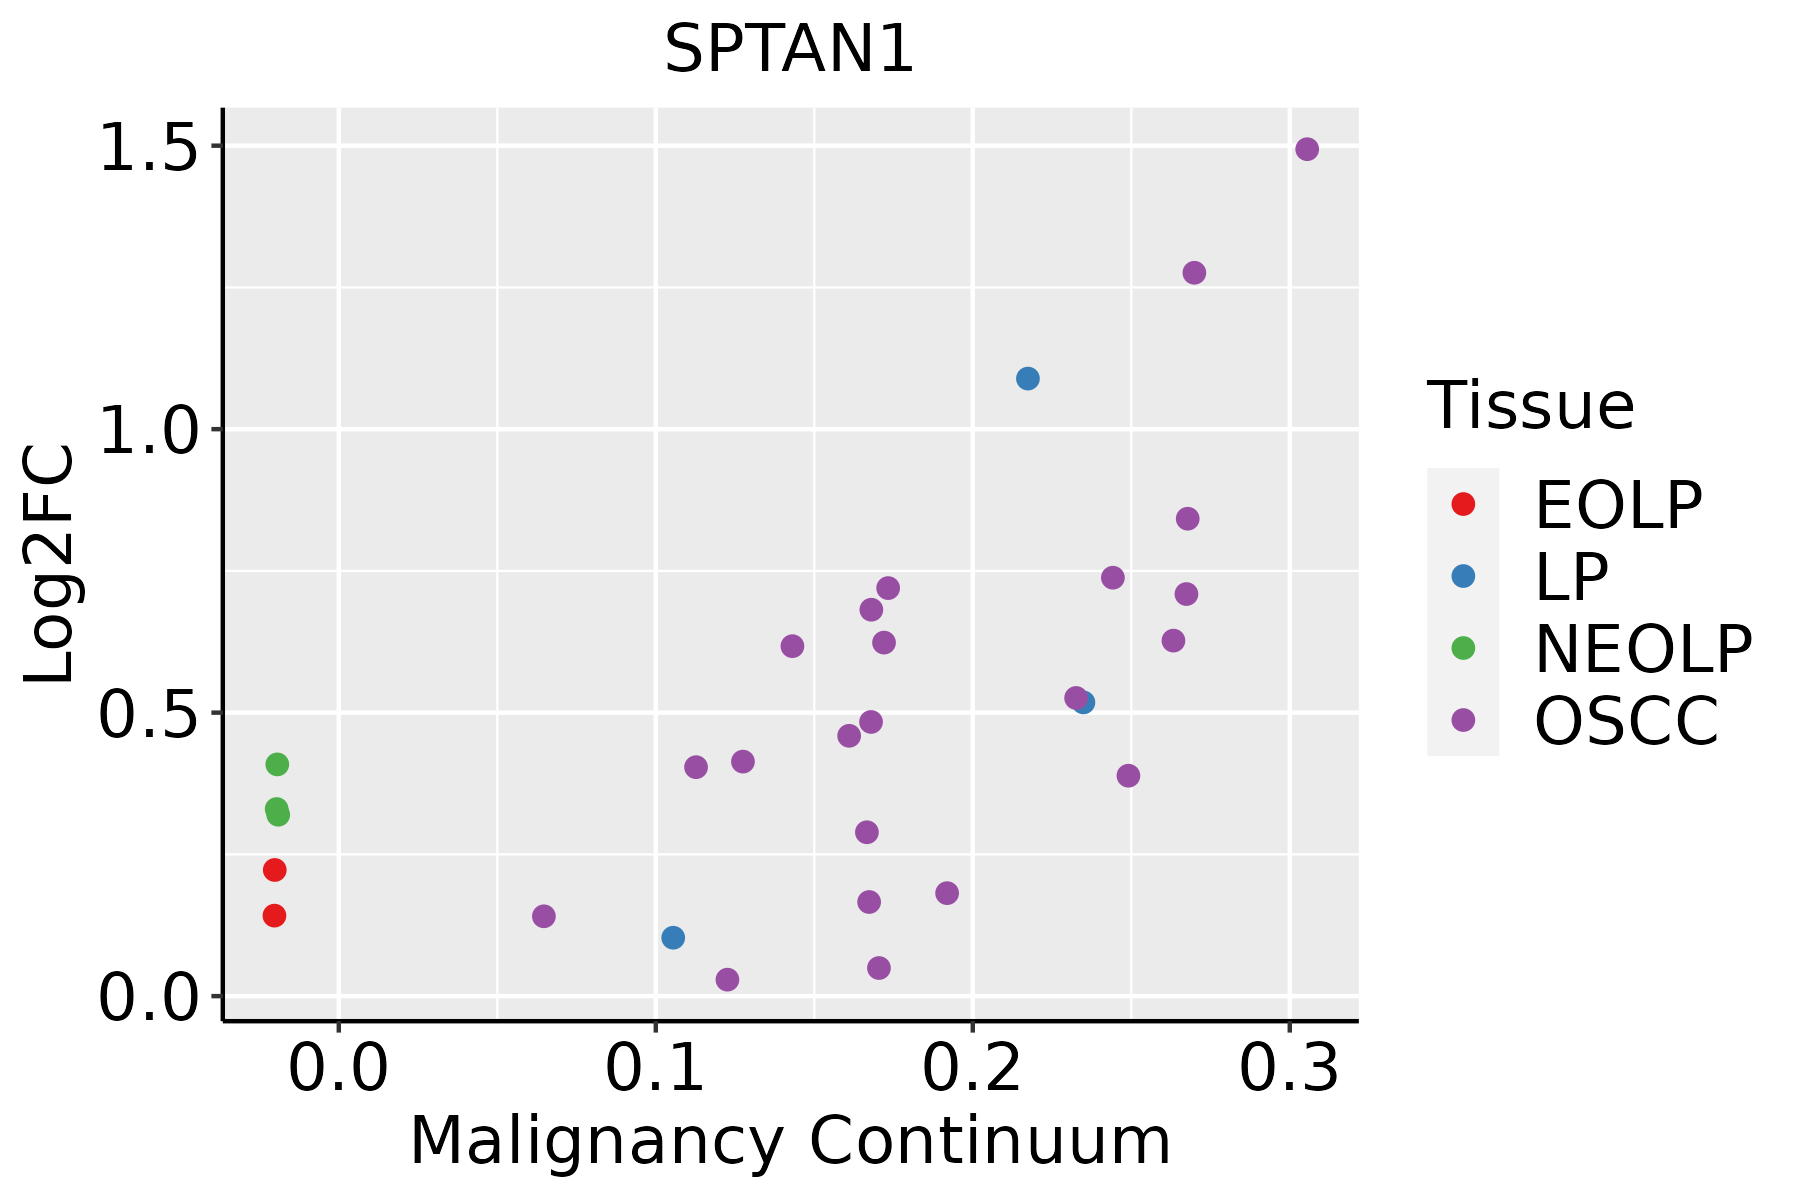 | EOLP: Erosive Oral lichen planus |
| LP: leukoplakia | ||
| NEOLP: Non-erosive oral lichen planus | ||
| OSCC: Oral squamous cell carcinoma | ||
| Prostate | 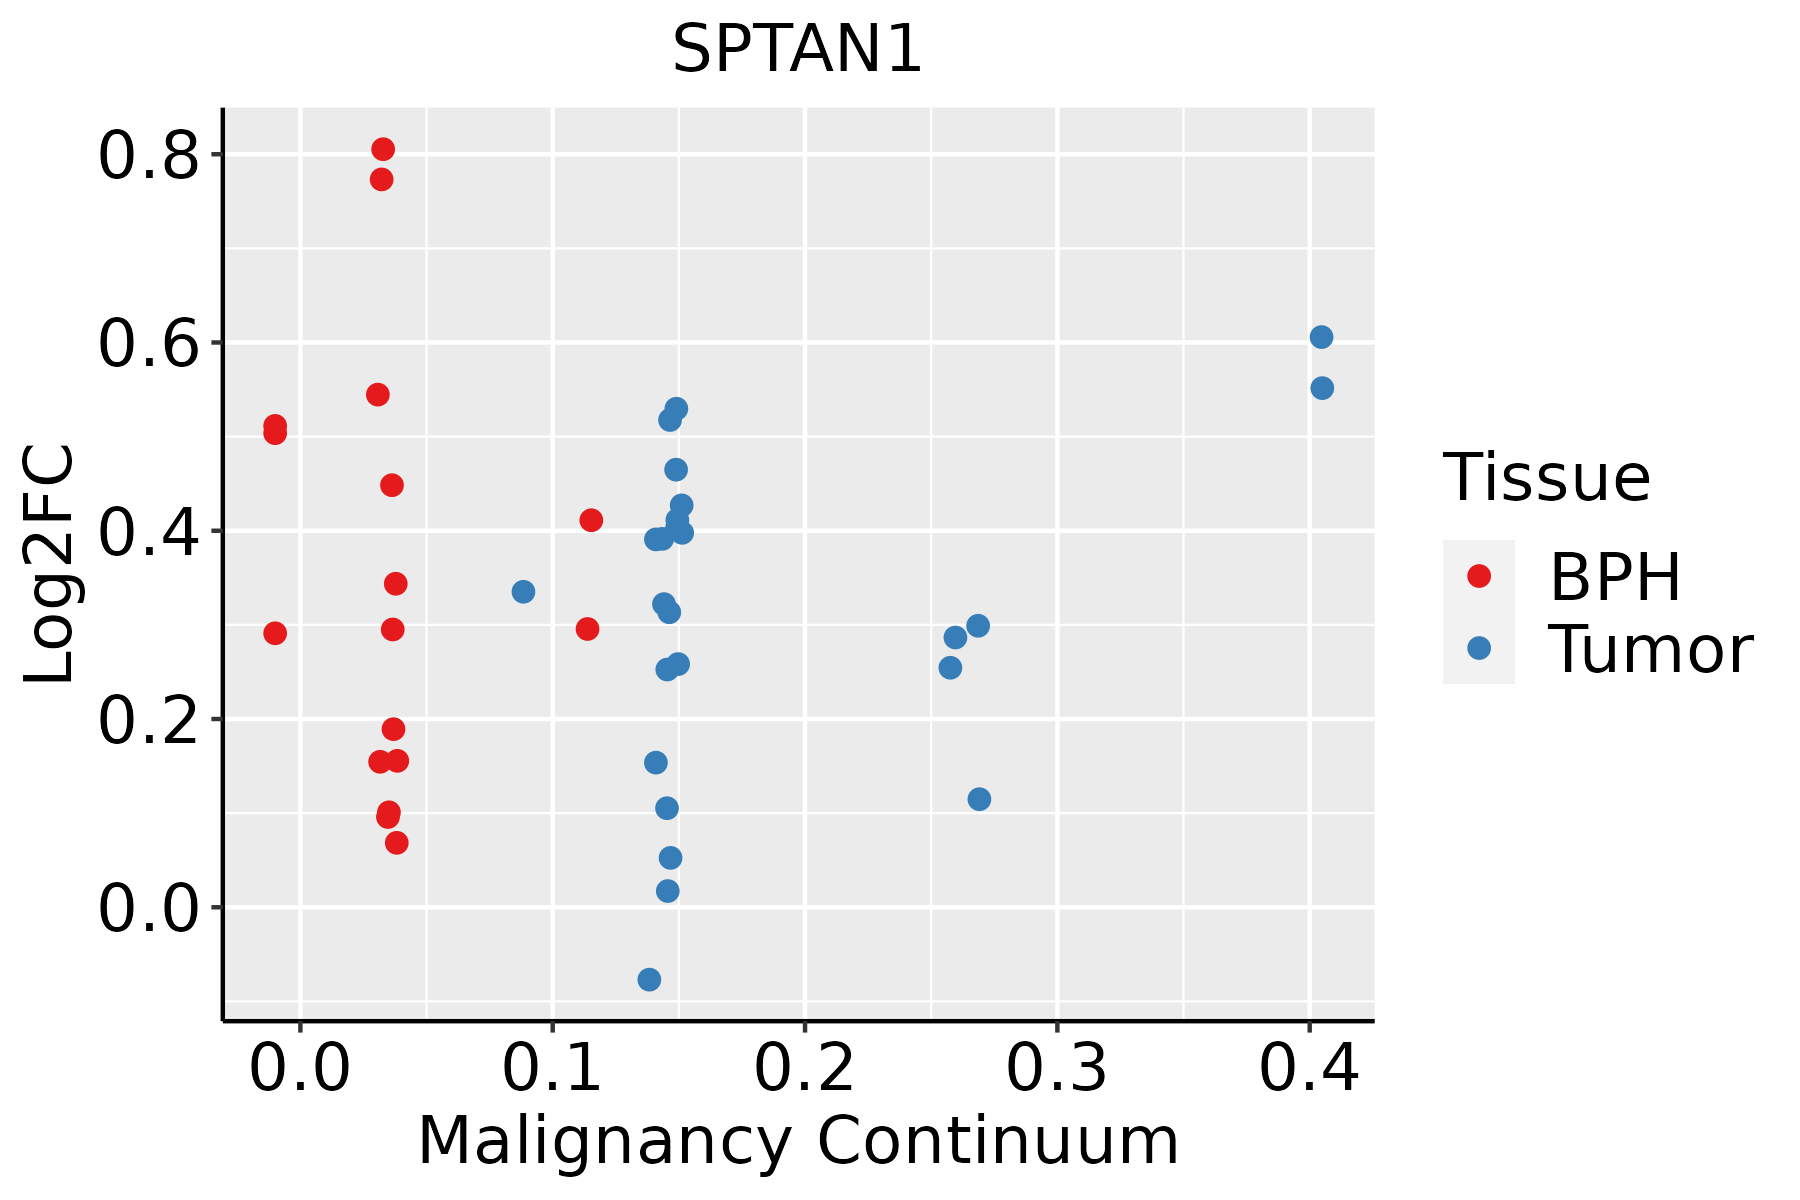 | BPH: Benign Prostatic Hyperplasia |
| Skin |  | AK: Actinic keratosis |
| cSCC: Cutaneous squamous cell carcinoma | ||
| SCCIS:squamous cell carcinoma in situ | ||
| Thyroid | 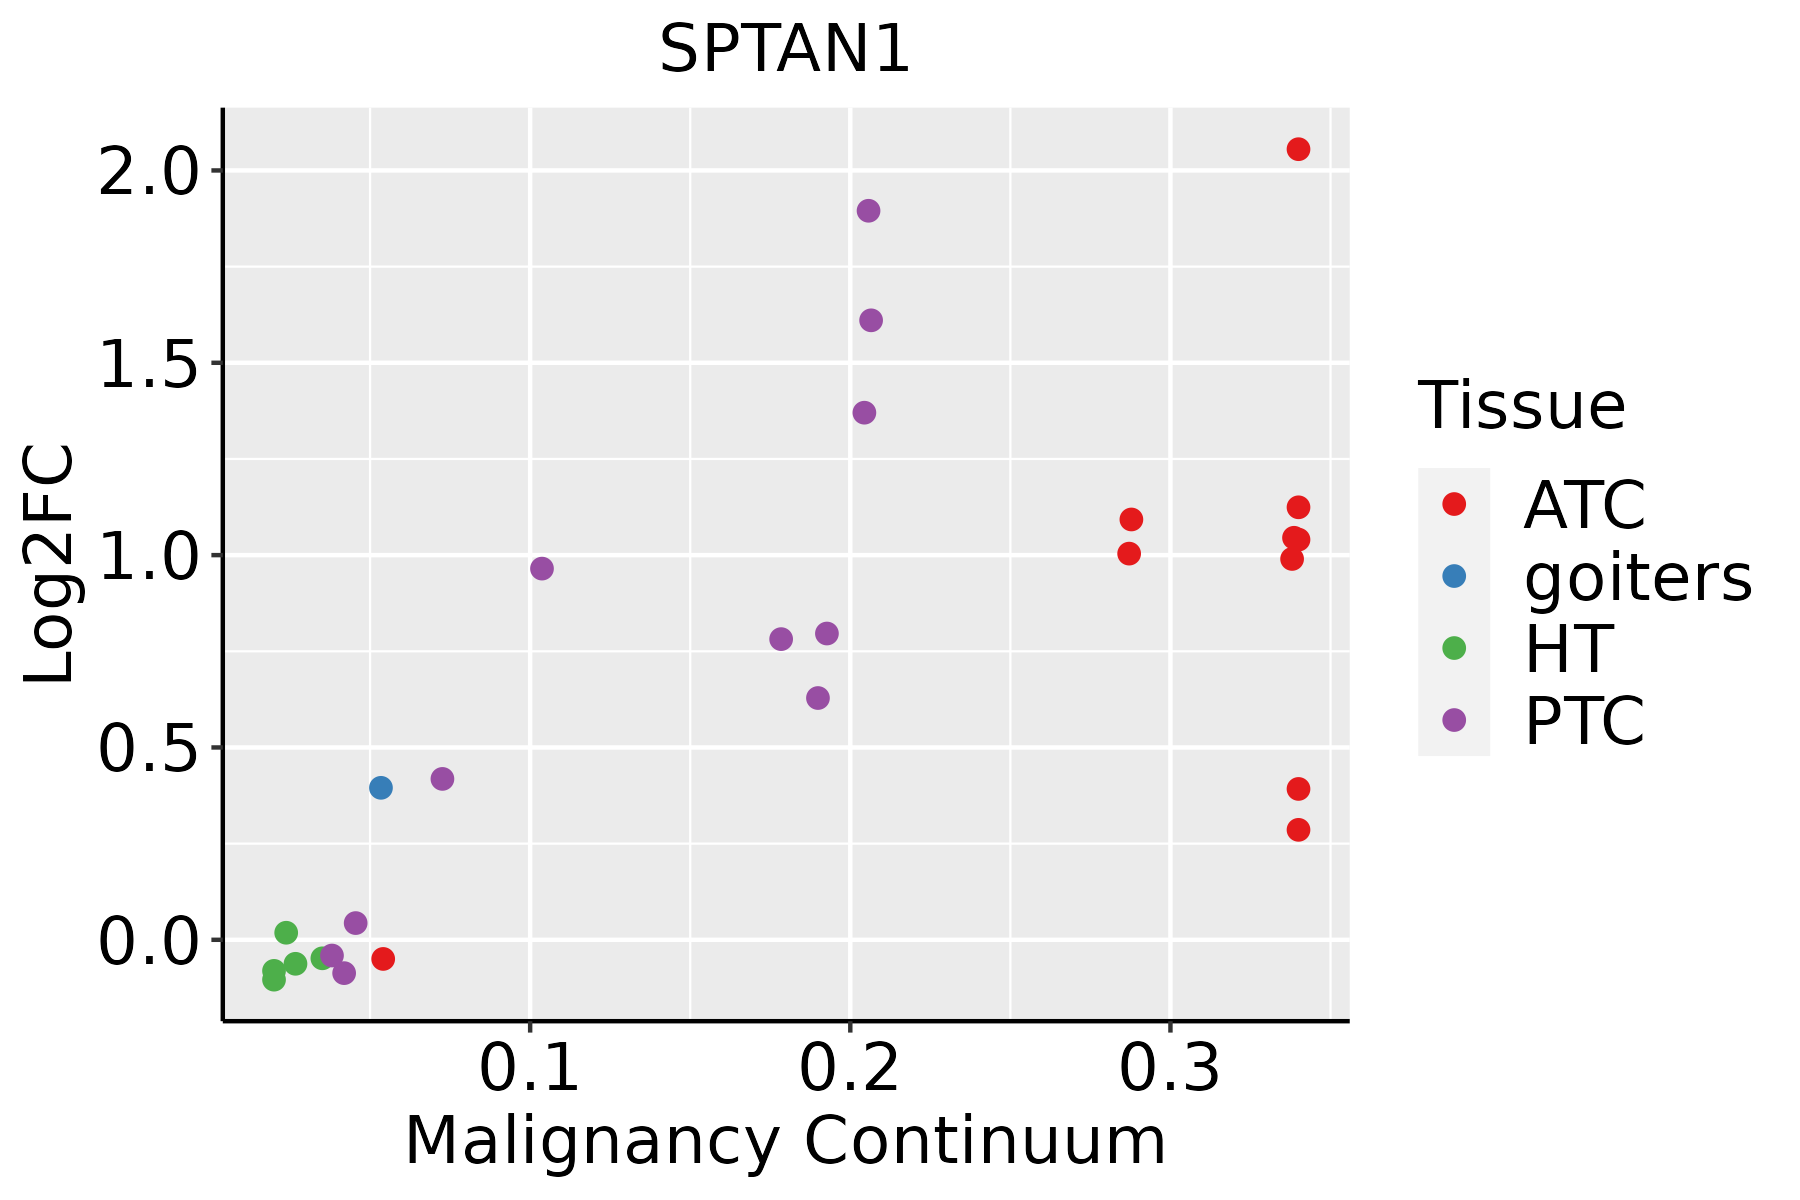 | ATC: Anaplastic thyroid cancer |
| HT: Hashimoto's thyroiditis | ||
| PTC: Papillary thyroid cancer |
| ∗log2FC in expression of this searched gene in stem-like cells from each diseased tissue sample relative to stem-like cells in normal samples in each tissue plotted against the malignancy continuum. Samples are colored based on if they are from different disease stage. |
Top |
Malignant transformation related pathway analysis |
| Find out the enriched GO biological processes and KEGG pathways involved in transition from healthy to precancer to cancer |
| Tissue | Disease Stage | Enriched GO biological Processes |
| Colorectum | AD |  |
| Colorectum | SER |  |
| Colorectum | MSS |  |
| Colorectum | MSI-H |  |
| Colorectum | FAP |  |
| ∗Top 15 enriched GO BP terms are showed in the bar plot of each disease state in each tissue. Each row represents a significant GO biological process which is colored according to the -log10(p.adjust). |
| Page: 1 2 3 4 5 6 7 8 9 |
| GO ID | Tissue | Disease Stage | Description | Gene Ratio | Bg Ratio | pvalue | p.adjust | Count |
| GO:00329565 | Colorectum | CRC | regulation of actin cytoskeleton organization | 76/2078 | 358/18723 | 1.68e-08 | 2.79e-06 | 76 |
| GO:01100535 | Colorectum | CRC | regulation of actin filament organization | 63/2078 | 278/18723 | 2.21e-08 | 3.23e-06 | 63 |
| GO:00325354 | Colorectum | CRC | regulation of cellular component size | 79/2078 | 383/18723 | 3.30e-08 | 4.60e-06 | 79 |
| GO:00322715 | Colorectum | CRC | regulation of protein polymerization | 55/2078 | 233/18723 | 3.97e-08 | 5.28e-06 | 55 |
| GO:00512585 | Colorectum | CRC | protein polymerization | 64/2078 | 297/18723 | 1.26e-07 | 1.45e-05 | 64 |
| GO:00081545 | Colorectum | CRC | actin polymerization or depolymerization | 51/2078 | 218/18723 | 1.65e-07 | 1.72e-05 | 51 |
| GO:00300415 | Colorectum | CRC | actin filament polymerization | 45/2078 | 191/18723 | 6.99e-07 | 4.61e-05 | 45 |
| GO:00080645 | Colorectum | CRC | regulation of actin polymerization or depolymerization | 44/2078 | 188/18723 | 1.12e-06 | 6.69e-05 | 44 |
| GO:00308325 | Colorectum | CRC | regulation of actin filament length | 44/2078 | 189/18723 | 1.31e-06 | 7.25e-05 | 44 |
| GO:00308335 | Colorectum | CRC | regulation of actin filament polymerization | 41/2078 | 172/18723 | 1.56e-06 | 8.26e-05 | 41 |
| GO:00329845 | Colorectum | CRC | protein-containing complex disassembly | 46/2078 | 224/18723 | 2.61e-05 | 7.18e-04 | 46 |
| GO:00106394 | Colorectum | CRC | negative regulation of organelle organization | 63/2078 | 348/18723 | 6.09e-05 | 1.35e-03 | 63 |
| GO:00224115 | Colorectum | CRC | cellular component disassembly | 75/2078 | 443/18723 | 1.26e-04 | 2.42e-03 | 75 |
| GO:00313335 | Colorectum | CRC | negative regulation of protein-containing complex assembly | 31/2078 | 141/18723 | 1.42e-04 | 2.62e-03 | 31 |
| GO:19029044 | Colorectum | CRC | negative regulation of supramolecular fiber organization | 34/2078 | 167/18723 | 3.30e-04 | 5.05e-03 | 34 |
| GO:00322725 | Colorectum | CRC | negative regulation of protein polymerization | 20/2078 | 80/18723 | 3.62e-04 | 5.45e-03 | 20 |
| GO:00300424 | Colorectum | CRC | actin filament depolymerization | 16/2078 | 59/18723 | 5.20e-04 | 7.31e-03 | 16 |
| GO:00308374 | Colorectum | CRC | negative regulation of actin filament polymerization | 17/2078 | 65/18723 | 5.58e-04 | 7.72e-03 | 17 |
| GO:00514944 | Colorectum | CRC | negative regulation of cytoskeleton organization | 32/2078 | 163/18723 | 9.35e-04 | 1.15e-02 | 32 |
| GO:00432443 | Colorectum | CRC | regulation of protein-containing complex disassembly | 25/2078 | 121/18723 | 1.54e-03 | 1.63e-02 | 25 |
| Page: 1 2 3 4 5 6 7 8 9 10 11 12 13 14 15 16 17 18 19 20 21 22 23 24 25 26 |
| Pathway ID | Tissue | Disease Stage | Description | Gene Ratio | Bg Ratio | pvalue | p.adjust | qvalue | Count |
| hsa042109 | Cervix | CC | Apoptosis | 36/1267 | 136/8465 | 3.21e-04 | 1.68e-03 | 9.91e-04 | 36 |
| hsa0421014 | Cervix | CC | Apoptosis | 36/1267 | 136/8465 | 3.21e-04 | 1.68e-03 | 9.91e-04 | 36 |
| hsa04210 | Colorectum | MSS | Apoptosis | 44/1875 | 136/8465 | 3.66e-03 | 1.66e-02 | 1.01e-02 | 44 |
| hsa042101 | Colorectum | MSS | Apoptosis | 44/1875 | 136/8465 | 3.66e-03 | 1.66e-02 | 1.01e-02 | 44 |
| hsa0421027 | Esophagus | ESCC | Apoptosis | 102/4205 | 136/8465 | 1.05e-09 | 1.21e-08 | 6.21e-09 | 102 |
| hsa0421037 | Esophagus | ESCC | Apoptosis | 102/4205 | 136/8465 | 1.05e-09 | 1.21e-08 | 6.21e-09 | 102 |
| hsa042106 | Liver | Cirrhotic | Apoptosis | 58/2530 | 136/8465 | 9.84e-04 | 5.55e-03 | 3.42e-03 | 58 |
| hsa0421011 | Liver | Cirrhotic | Apoptosis | 58/2530 | 136/8465 | 9.84e-04 | 5.55e-03 | 3.42e-03 | 58 |
| hsa042102 | Liver | HCC | Apoptosis | 83/4020 | 136/8465 | 9.51e-04 | 3.58e-03 | 1.99e-03 | 83 |
| hsa042103 | Liver | HCC | Apoptosis | 83/4020 | 136/8465 | 9.51e-04 | 3.58e-03 | 1.99e-03 | 83 |
| hsa042107 | Lung | IAC | Apoptosis | 30/1053 | 136/8465 | 1.11e-03 | 7.82e-03 | 5.19e-03 | 30 |
| hsa0421012 | Lung | IAC | Apoptosis | 30/1053 | 136/8465 | 1.11e-03 | 7.82e-03 | 5.19e-03 | 30 |
| hsa0421018 | Oral cavity | OSCC | Apoptosis | 101/3704 | 136/8465 | 3.34e-13 | 7.00e-12 | 3.56e-12 | 101 |
| hsa0421019 | Oral cavity | OSCC | Apoptosis | 101/3704 | 136/8465 | 3.34e-13 | 7.00e-12 | 3.56e-12 | 101 |
| hsa0421026 | Oral cavity | LP | Apoptosis | 65/2418 | 136/8465 | 1.33e-06 | 1.48e-05 | 9.53e-06 | 65 |
| hsa0421036 | Oral cavity | LP | Apoptosis | 65/2418 | 136/8465 | 1.33e-06 | 1.48e-05 | 9.53e-06 | 65 |
| hsa0421043 | Oral cavity | EOLP | Apoptosis | 40/1218 | 136/8465 | 4.20e-06 | 2.91e-05 | 1.72e-05 | 40 |
| hsa0421053 | Oral cavity | EOLP | Apoptosis | 40/1218 | 136/8465 | 4.20e-06 | 2.91e-05 | 1.72e-05 | 40 |
| hsa0421016 | Prostate | BPH | Apoptosis | 46/1718 | 136/8465 | 1.41e-04 | 8.31e-04 | 5.14e-04 | 46 |
| hsa0421017 | Prostate | BPH | Apoptosis | 46/1718 | 136/8465 | 1.41e-04 | 8.31e-04 | 5.14e-04 | 46 |
| Page: 1 2 |
Top |
Cell-cell communication analysis |
| Identification of potential cell-cell interactions between two cell types and their ligand-receptor pairs for different disease states |
| Ligand | Receptor | LRpair | Pathway | Tissue | Disease Stage |
| Page: 1 |
Top |
Single-cell gene regulatory network inference analysis |
| Find out the significant the regulons (TFs) and the target genes of each regulon across cell types for different disease states |
| TF | Cell Type | Tissue | Disease Stage | Target Gene | RSS | Regulon Activity |
| ∗The dot plots of a searched regulon are shown for all cell subpopulations in each disease state of each tissue based on the regulon specific score inferred using pySCENIC and by calculating the average expression. |
| Page: 1 |
Top |
Somatic mutation of malignant transformation related genes |
| Annotation of somatic variants for genes involved in malignant transformation |
| Hugo Symbol | Variant Class | Variant Classification | dbSNP RS | HGVSc | HGVSp | HGVSp Short | SWISSPROT | BIOTYPE | SIFT | PolyPhen | Tumor Sample Barcode | Tissue | Histology | Sex | Age | Stage | Therapy Types | Drugs | Outcome |
| SPTAN1 | SNV | Missense_Mutation | c.4690N>C | p.Glu1564Gln | p.E1564Q | Q13813 | protein_coding | deleterious(0.02) | probably_damaging(0.969) | TCGA-A2-A0CL-01 | Breast | breast invasive carcinoma | Female | <65 | III/IV | Chemotherapy | cytoxan | SD | |
| SPTAN1 | SNV | Missense_Mutation | rs770133448 | c.5524N>A | p.Gly1842Arg | p.G1842R | Q13813 | protein_coding | deleterious(0.01) | probably_damaging(0.999) | TCGA-A2-A0T1-01 | Breast | breast invasive carcinoma | Female | <65 | III/IV | Targeted Molecular therapy | herceptin | SD |
| SPTAN1 | SNV | Missense_Mutation | novel | c.6932N>G | p.His2311Arg | p.H2311R | Q13813 | protein_coding | deleterious(0.01) | probably_damaging(0.923) | TCGA-A2-A3XY-01 | Breast | breast invasive carcinoma | Female | <65 | I/II | Chemotherapy | adriamycin | PD |
| SPTAN1 | SNV | Missense_Mutation | c.2053N>T | p.Arg685Cys | p.R685C | Q13813 | protein_coding | deleterious(0) | probably_damaging(0.987) | TCGA-A7-A13E-01 | Breast | breast invasive carcinoma | Female | <65 | I/II | Targeted Molecular therapy | bevacizumab | PD | |
| SPTAN1 | SNV | Missense_Mutation | c.2371N>T | p.Arg791Trp | p.R791W | Q13813 | protein_coding | deleterious(0) | possibly_damaging(0.599) | TCGA-AC-A23H-01 | Breast | breast invasive carcinoma | Female | >=65 | I/II | Unknown | Unknown | PD | |
| SPTAN1 | SNV | Missense_Mutation | c.4698N>C | p.Trp1566Cys | p.W1566C | Q13813 | protein_coding | deleterious(0) | possibly_damaging(0.73) | TCGA-AC-A23H-01 | Breast | breast invasive carcinoma | Female | >=65 | I/II | Unknown | Unknown | PD | |
| SPTAN1 | SNV | Missense_Mutation | novel | c.4259N>G | p.Leu1420Arg | p.L1420R | Q13813 | protein_coding | deleterious(0.02) | probably_damaging(0.996) | TCGA-AN-A046-01 | Breast | breast invasive carcinoma | Female | >=65 | I/II | Unknown | Unknown | SD |
| SPTAN1 | SNV | Missense_Mutation | c.4967N>A | p.Ser1656Asn | p.S1656N | Q13813 | protein_coding | tolerated(0.2) | probably_damaging(0.916) | TCGA-AR-A254-01 | Breast | breast invasive carcinoma | Female | <65 | III/IV | Chemotherapy | paclitaxel | SD | |
| SPTAN1 | SNV | Missense_Mutation | novel | c.4968N>G | p.Ser1656Arg | p.S1656R | Q13813 | protein_coding | tolerated(0.11) | probably_damaging(0.975) | TCGA-AR-A254-01 | Breast | breast invasive carcinoma | Female | <65 | III/IV | Chemotherapy | paclitaxel | SD |
| SPTAN1 | SNV | Missense_Mutation | novel | c.5353A>G | p.Ile1785Val | p.I1785V | Q13813 | protein_coding | deleterious(0) | possibly_damaging(0.462) | TCGA-BH-A0BW-01 | Breast | breast invasive carcinoma | Female | >=65 | I/II | Chemotherapy | adriamycin | CR |
| Page: 1 2 3 4 5 6 7 8 9 10 11 12 13 14 15 16 17 18 19 20 21 22 23 24 25 |
Top |
Related drugs of malignant transformation related genes |
| Identification of chemicals and drugs interact with genes involved in malignant transfromation |
| (DGIdb 4.0) |
| Entrez ID | Symbol | Category | Interaction Types | Drug Claim Name | Drug Name | PMIDs |
| Page: 1 |

Copyright 2023-Present -The University of Texas Health Science Center at Houston |