
|
|||||
|
 | |
| |
| |
| |
| |
| |
|
Gene: SOD2 |
Gene summary for SOD2 |
| Gene information | Species | Human | Gene symbol | SOD2 | Gene ID | 6648 |
| Gene name | superoxide dismutase 2 | |
| Gene Alias | GClnc1 | |
| Cytomap | 6q25.3 | |
| Gene Type | protein-coding | GO ID | GO:0000302 | UniProtAcc | P04179 |
Top |
Malignant transformation analysis |
| Identification of the aberrant gene expression in precancerous and cancerous lesions by comparing the gene expression of stem-like cells in diseased tissues with normal stem cells |
| Entrez ID | Symbol | Replicates | Species | Organ | Tissue | Adj P-value | Log2FC | Malignancy |
| 6648 | SOD2 | GSM4909281 | Human | Breast | IDC | 6.29e-34 | -1.09e+00 | 0.21 |
| 6648 | SOD2 | GSM4909282 | Human | Breast | IDC | 4.57e-25 | -6.50e-01 | -0.0288 |
| 6648 | SOD2 | GSM4909285 | Human | Breast | IDC | 7.13e-46 | -1.35e+00 | 0.21 |
| 6648 | SOD2 | GSM4909286 | Human | Breast | IDC | 6.00e-45 | -1.36e+00 | 0.1081 |
| 6648 | SOD2 | GSM4909287 | Human | Breast | IDC | 2.09e-21 | -8.11e-01 | 0.2057 |
| 6648 | SOD2 | GSM4909288 | Human | Breast | IDC | 4.22e-04 | -8.15e-01 | 0.0988 |
| 6648 | SOD2 | GSM4909289 | Human | Breast | IDC | 2.94e-09 | -1.26e+00 | 0.1064 |
| 6648 | SOD2 | GSM4909290 | Human | Breast | IDC | 1.02e-24 | -1.09e+00 | 0.2096 |
| 6648 | SOD2 | GSM4909291 | Human | Breast | IDC | 6.04e-28 | -1.33e+00 | 0.1753 |
| 6648 | SOD2 | GSM4909292 | Human | Breast | IDC | 2.26e-03 | -1.10e+00 | 0.1236 |
| 6648 | SOD2 | GSM4909293 | Human | Breast | IDC | 1.00e-40 | -1.27e+00 | 0.1581 |
| 6648 | SOD2 | GSM4909294 | Human | Breast | IDC | 8.46e-51 | -1.38e+00 | 0.2022 |
| 6648 | SOD2 | GSM4909295 | Human | Breast | IDC | 2.92e-11 | -9.15e-01 | 0.0898 |
| 6648 | SOD2 | GSM4909296 | Human | Breast | IDC | 2.00e-53 | -1.44e+00 | 0.1524 |
| 6648 | SOD2 | GSM4909297 | Human | Breast | IDC | 3.08e-53 | -1.45e+00 | 0.1517 |
| 6648 | SOD2 | GSM4909298 | Human | Breast | IDC | 7.80e-48 | -1.39e+00 | 0.1551 |
| 6648 | SOD2 | GSM4909299 | Human | Breast | IDC | 3.03e-17 | -5.78e-01 | 0.035 |
| 6648 | SOD2 | GSM4909300 | Human | Breast | IDC | 1.72e-08 | -7.39e-01 | 0.0334 |
| 6648 | SOD2 | GSM4909301 | Human | Breast | IDC | 8.15e-47 | -1.36e+00 | 0.1577 |
| 6648 | SOD2 | GSM4909302 | Human | Breast | IDC | 4.21e-40 | -1.27e+00 | 0.1545 |
| Page: 1 2 3 4 5 6 7 8 9 10 11 12 13 14 15 16 17 |
| Tissue | Expression Dynamics | Abbreviation |
| Breast |  | IDC: Invasive ductal carcinoma |
| DCIS: Ductal carcinoma in situ | ||
| Precancer(BRCA1-mut): Precancerous lesion from BRCA1 mutation carriers | ||
| Cervix | 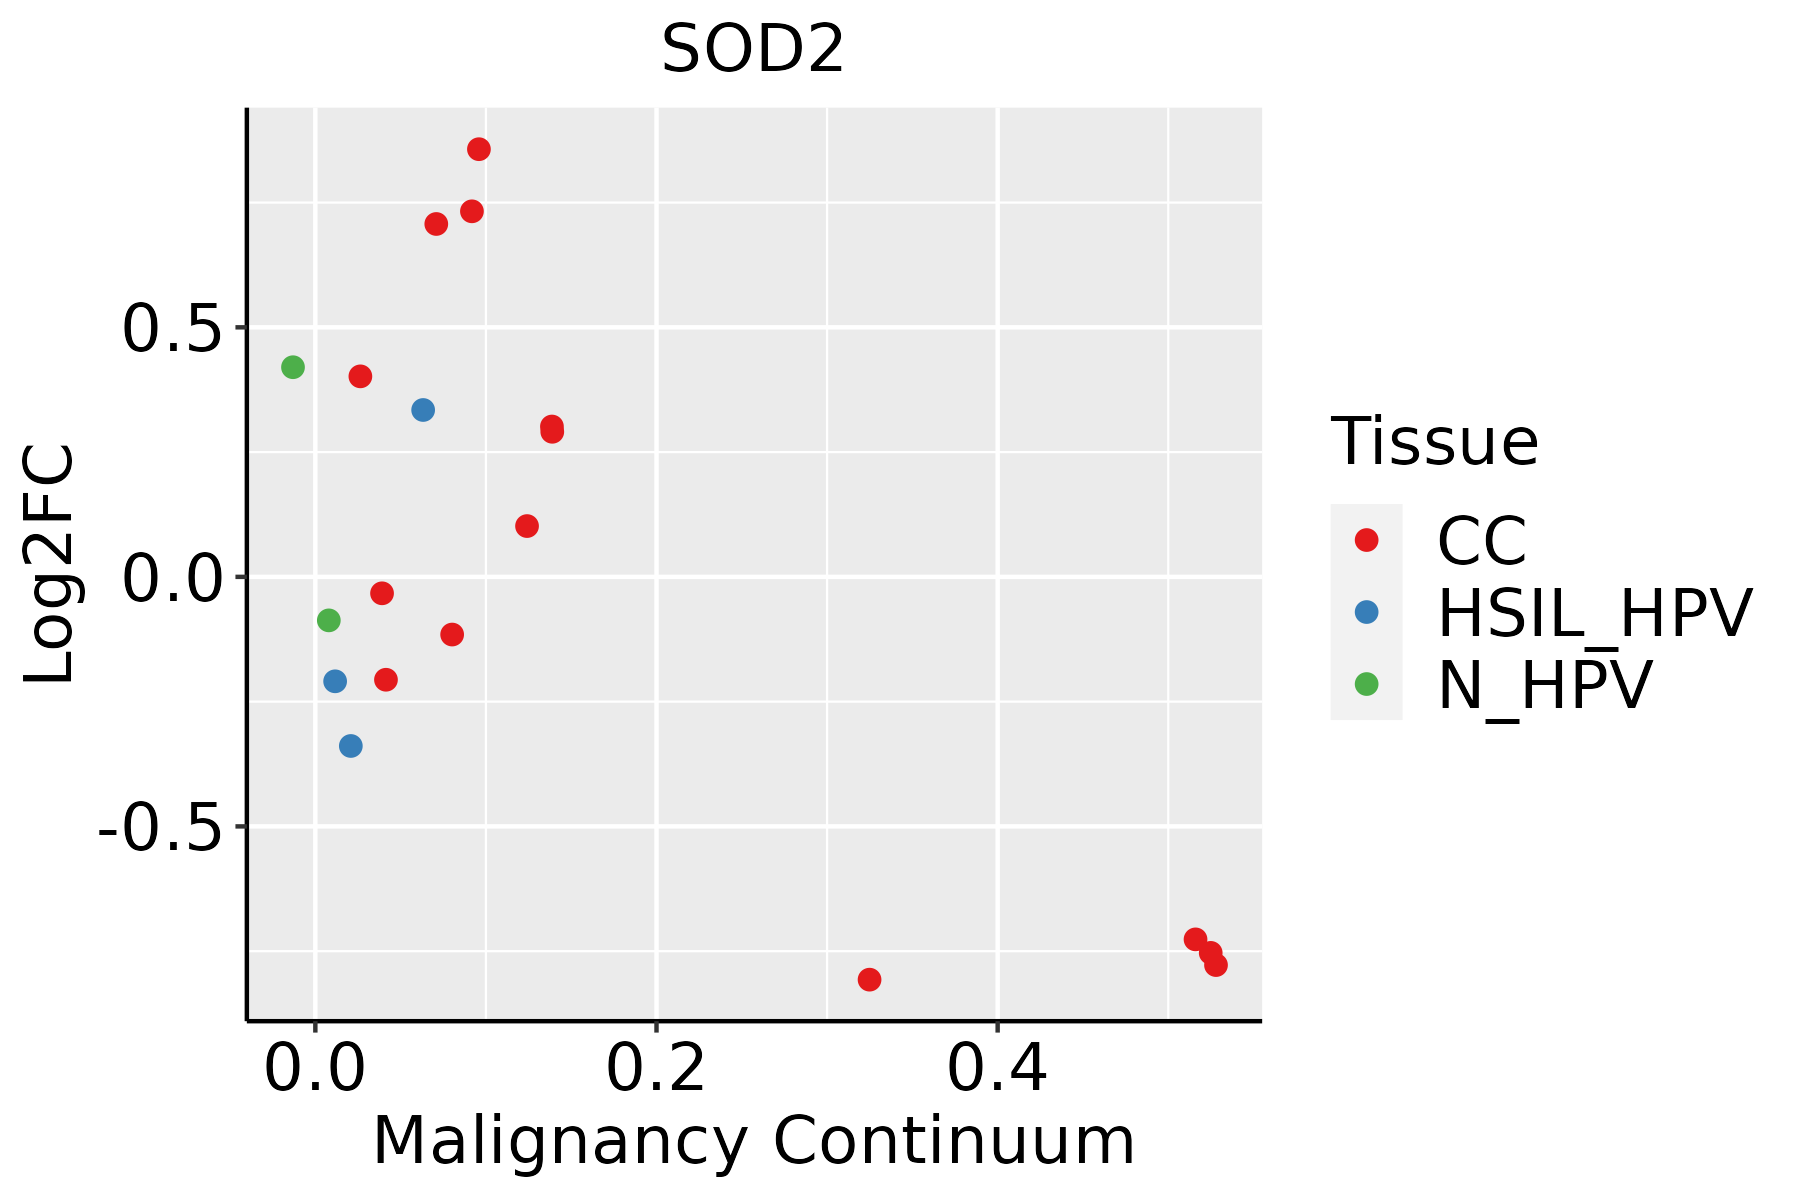 | CC: Cervix cancer |
| HSIL_HPV: HPV-infected high-grade squamous intraepithelial lesions | ||
| N_HPV: HPV-infected normal cervix | ||
| Colorectum (GSE201348) |  | FAP: Familial adenomatous polyposis |
| CRC: Colorectal cancer | ||
| Colorectum (HTA11) | 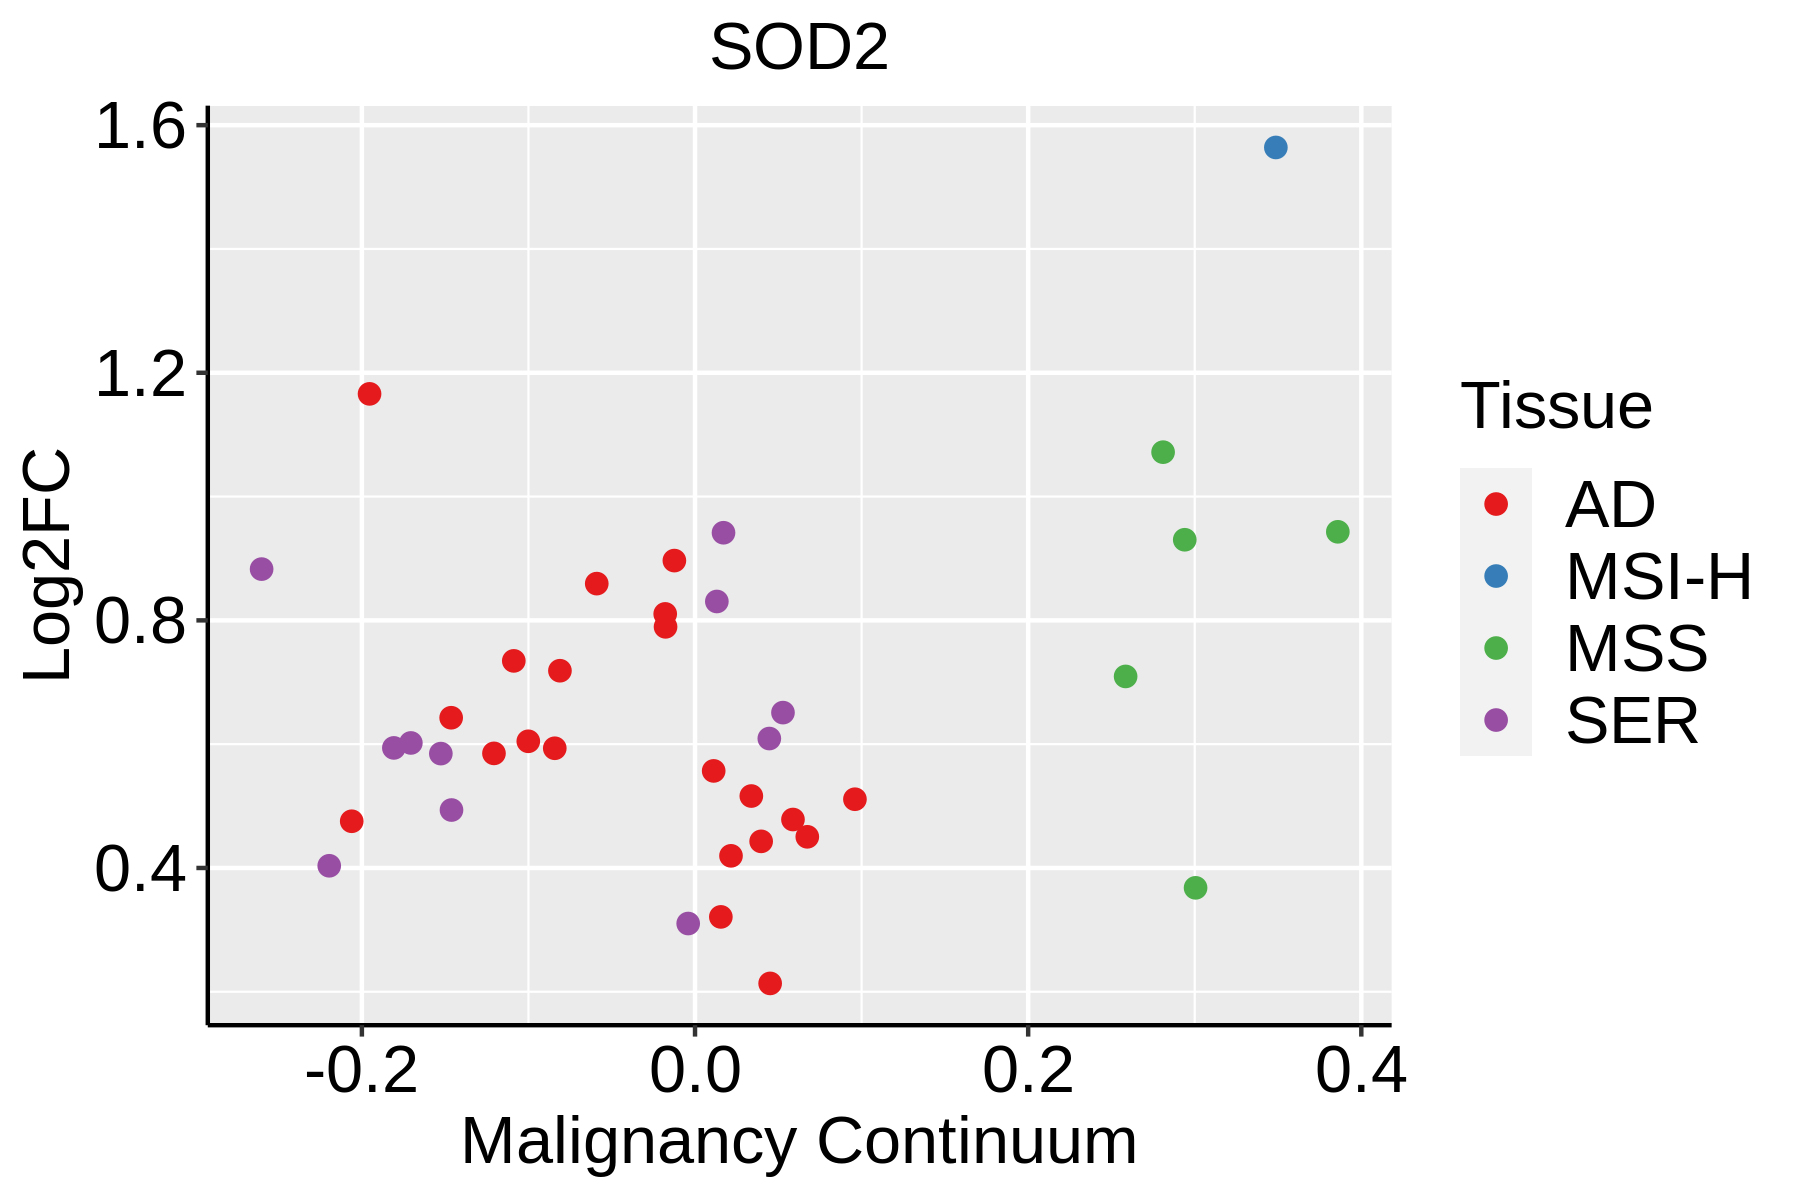 | AD: Adenomas |
| SER: Sessile serrated lesions | ||
| MSI-H: Microsatellite-high colorectal cancer | ||
| MSS: Microsatellite stable colorectal cancer | ||
| Endometrium | 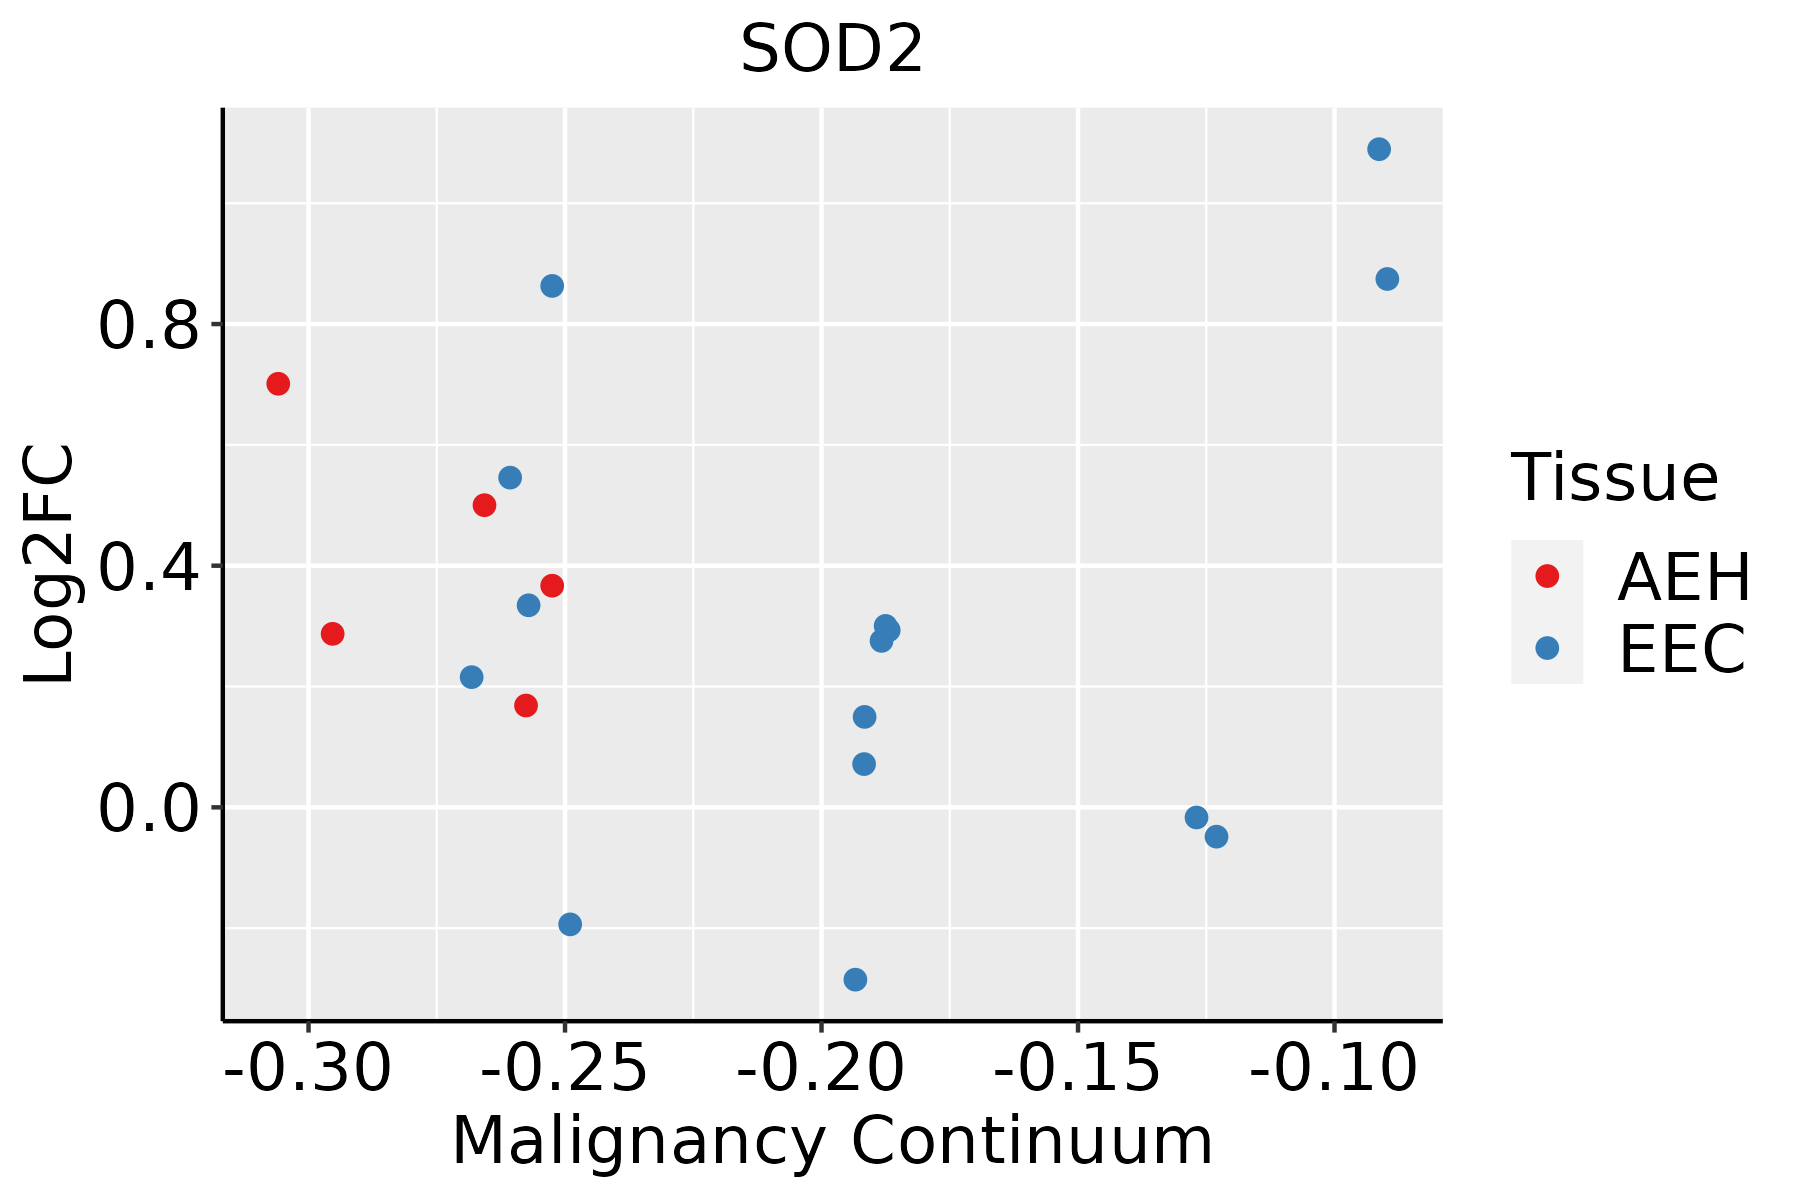 | AEH: Atypical endometrial hyperplasia |
| EEC: Endometrioid Cancer | ||
| Esophagus |  | ESCC: Esophageal squamous cell carcinoma |
| HGIN: High-grade intraepithelial neoplasias | ||
| LGIN: Low-grade intraepithelial neoplasias | ||
| GC | 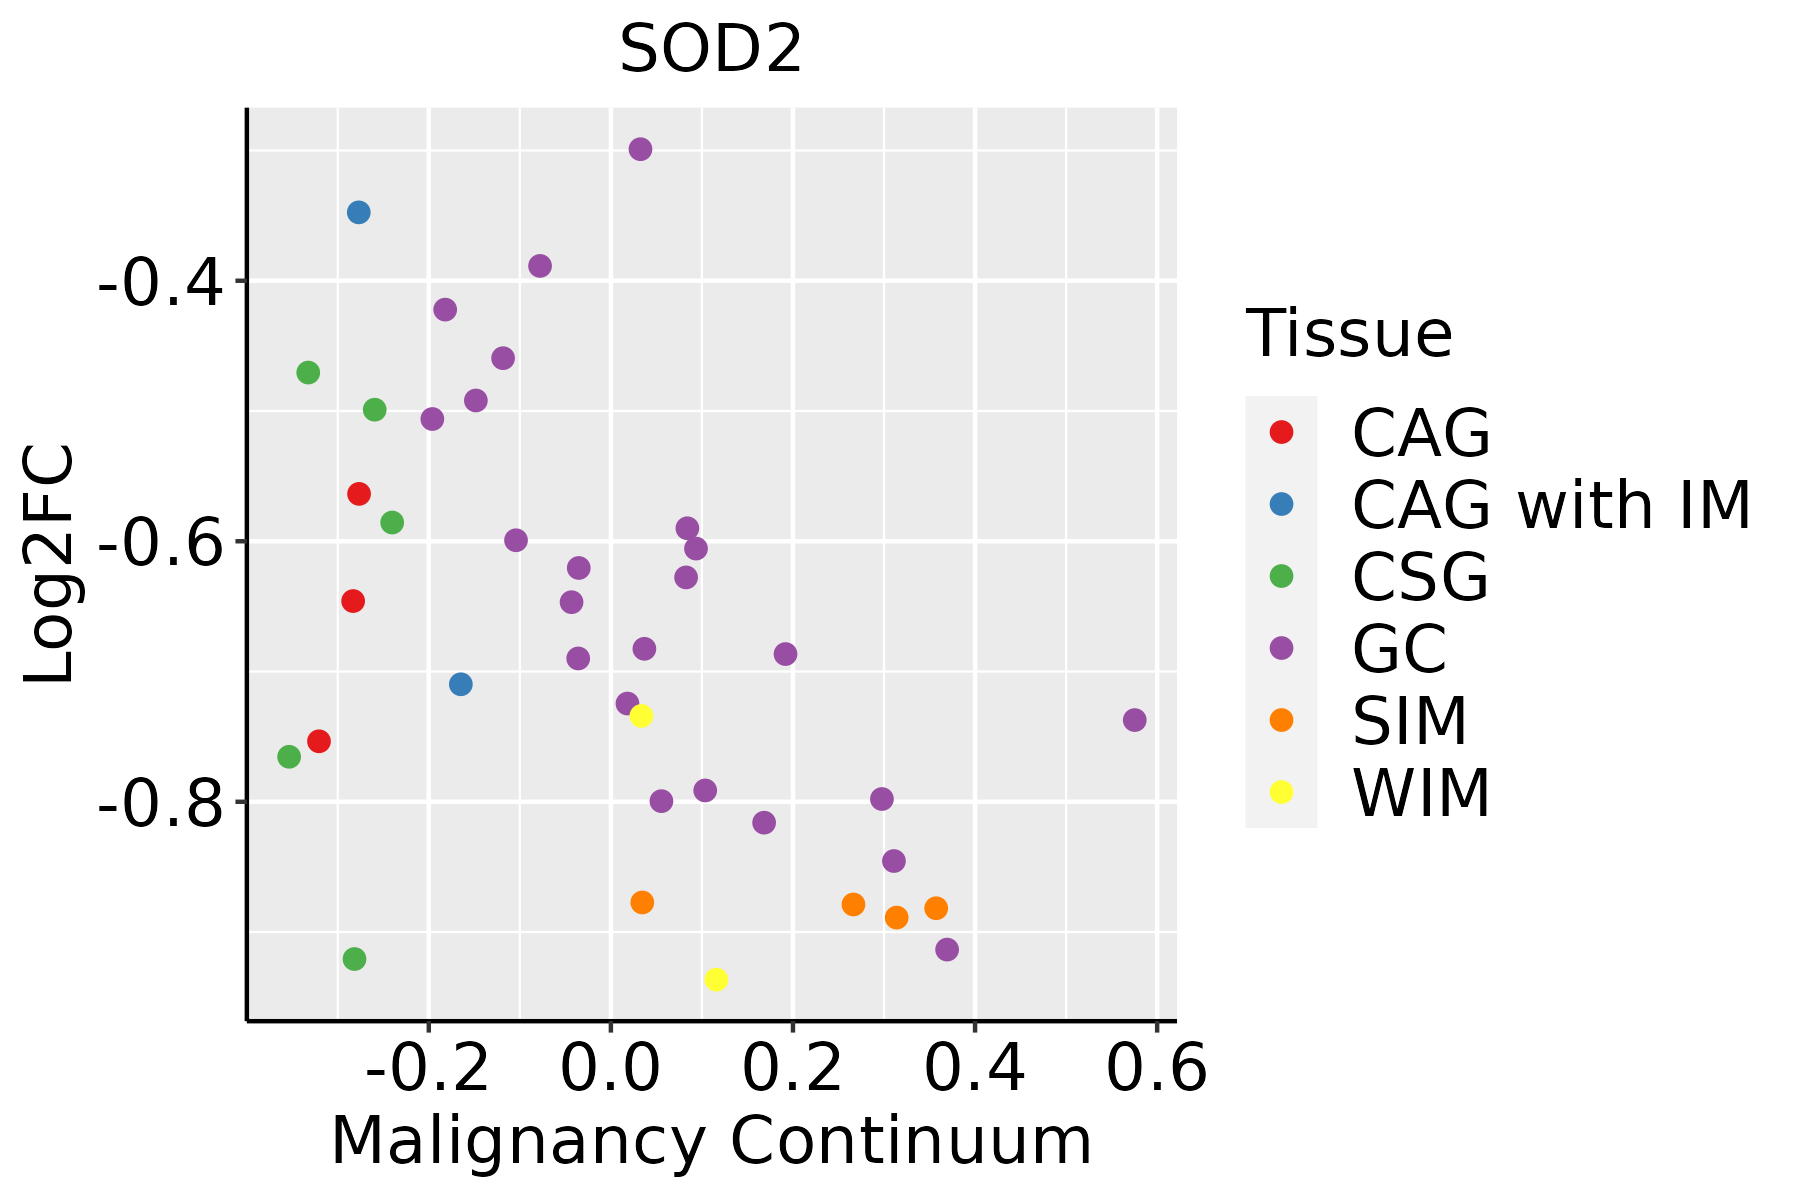 | CAG: Chronic atrophic gastritis |
| CAG with IM: Chronic atrophic gastritis with intestinal metaplasia | ||
| CSG: Chronic superficial gastritis | ||
| GC: Gastric cancer | ||
| SIM: Severe intestinal metaplasia | ||
| WIM: Wild intestinal metaplasia | ||
| Liver |  | HCC: Hepatocellular carcinoma |
| NAFLD: Non-alcoholic fatty liver disease | ||
| Lung | 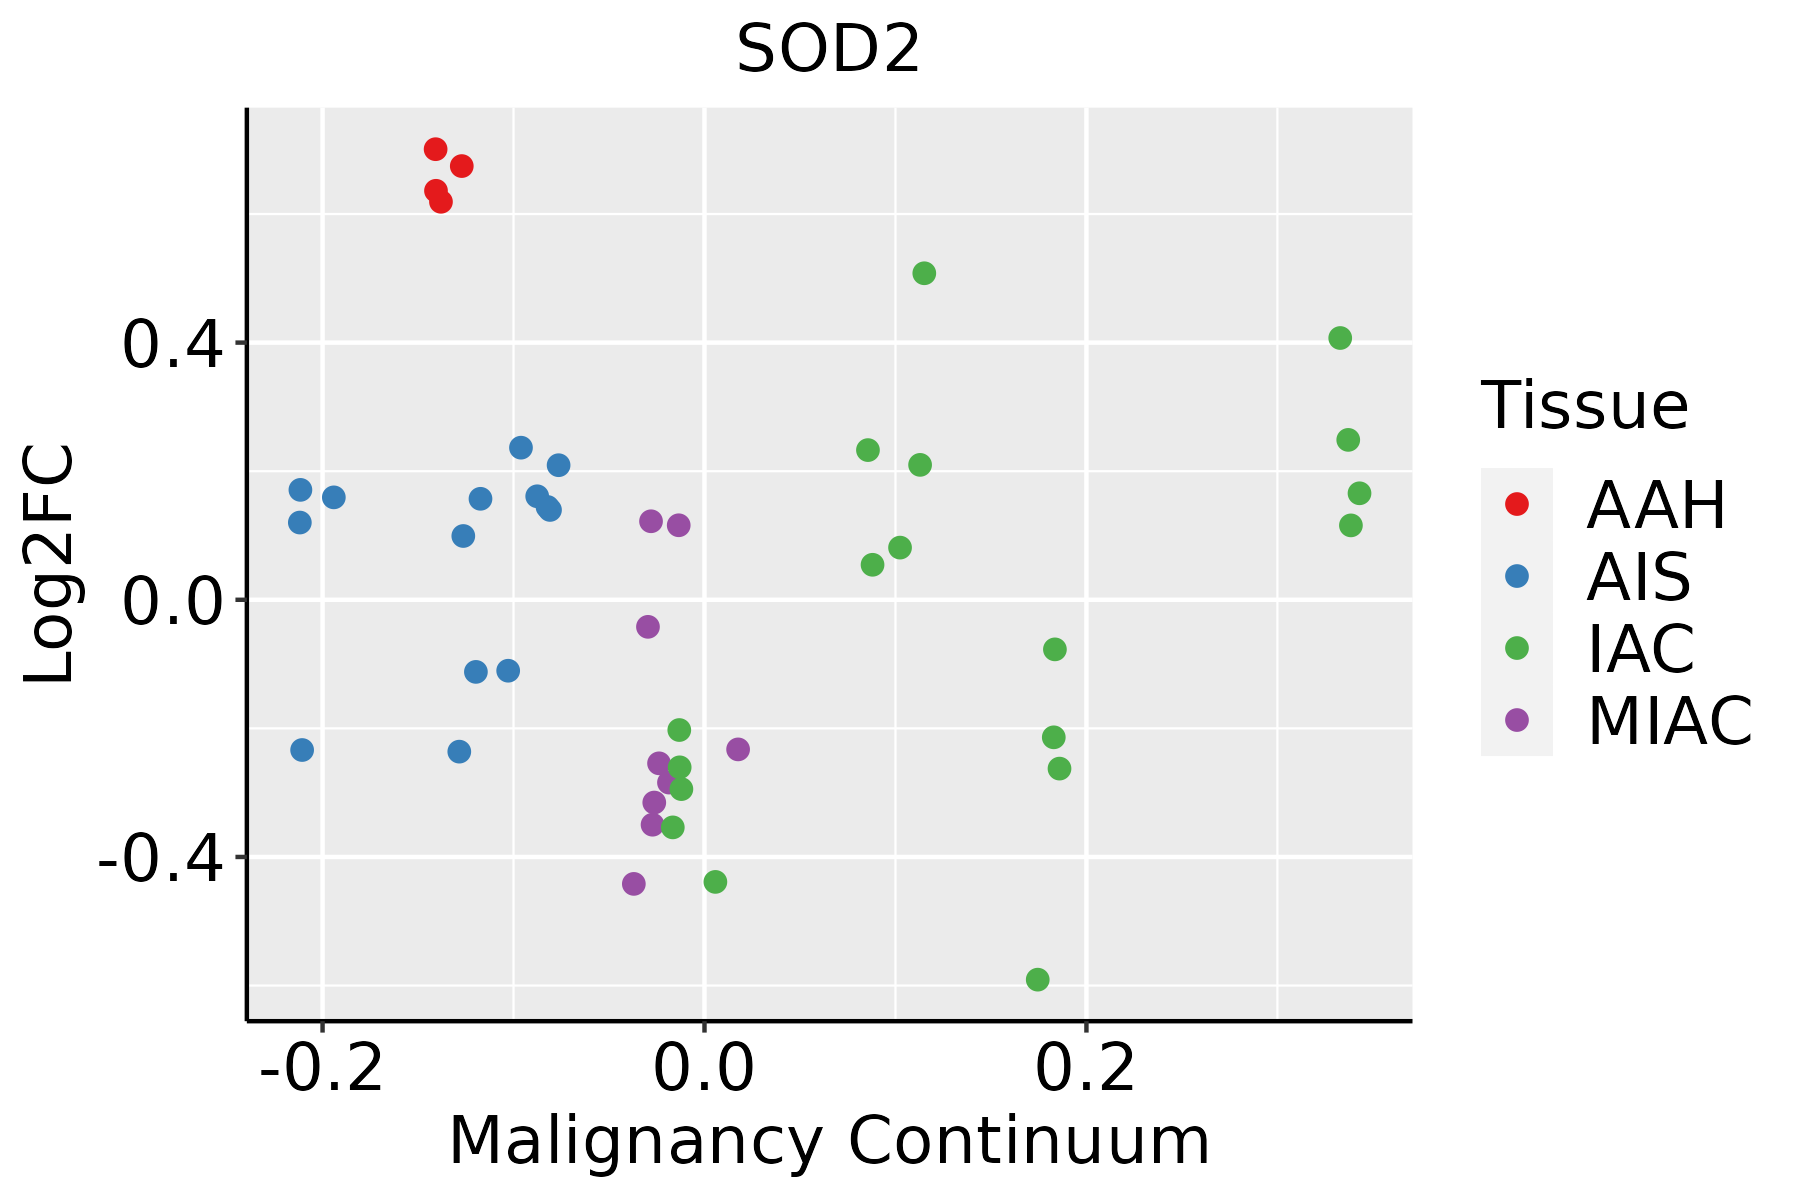 | AAH: Atypical adenomatous hyperplasia |
| AIS: Adenocarcinoma in situ | ||
| IAC: Invasive lung adenocarcinoma | ||
| MIA: Minimally invasive adenocarcinoma | ||
| Oral Cavity | 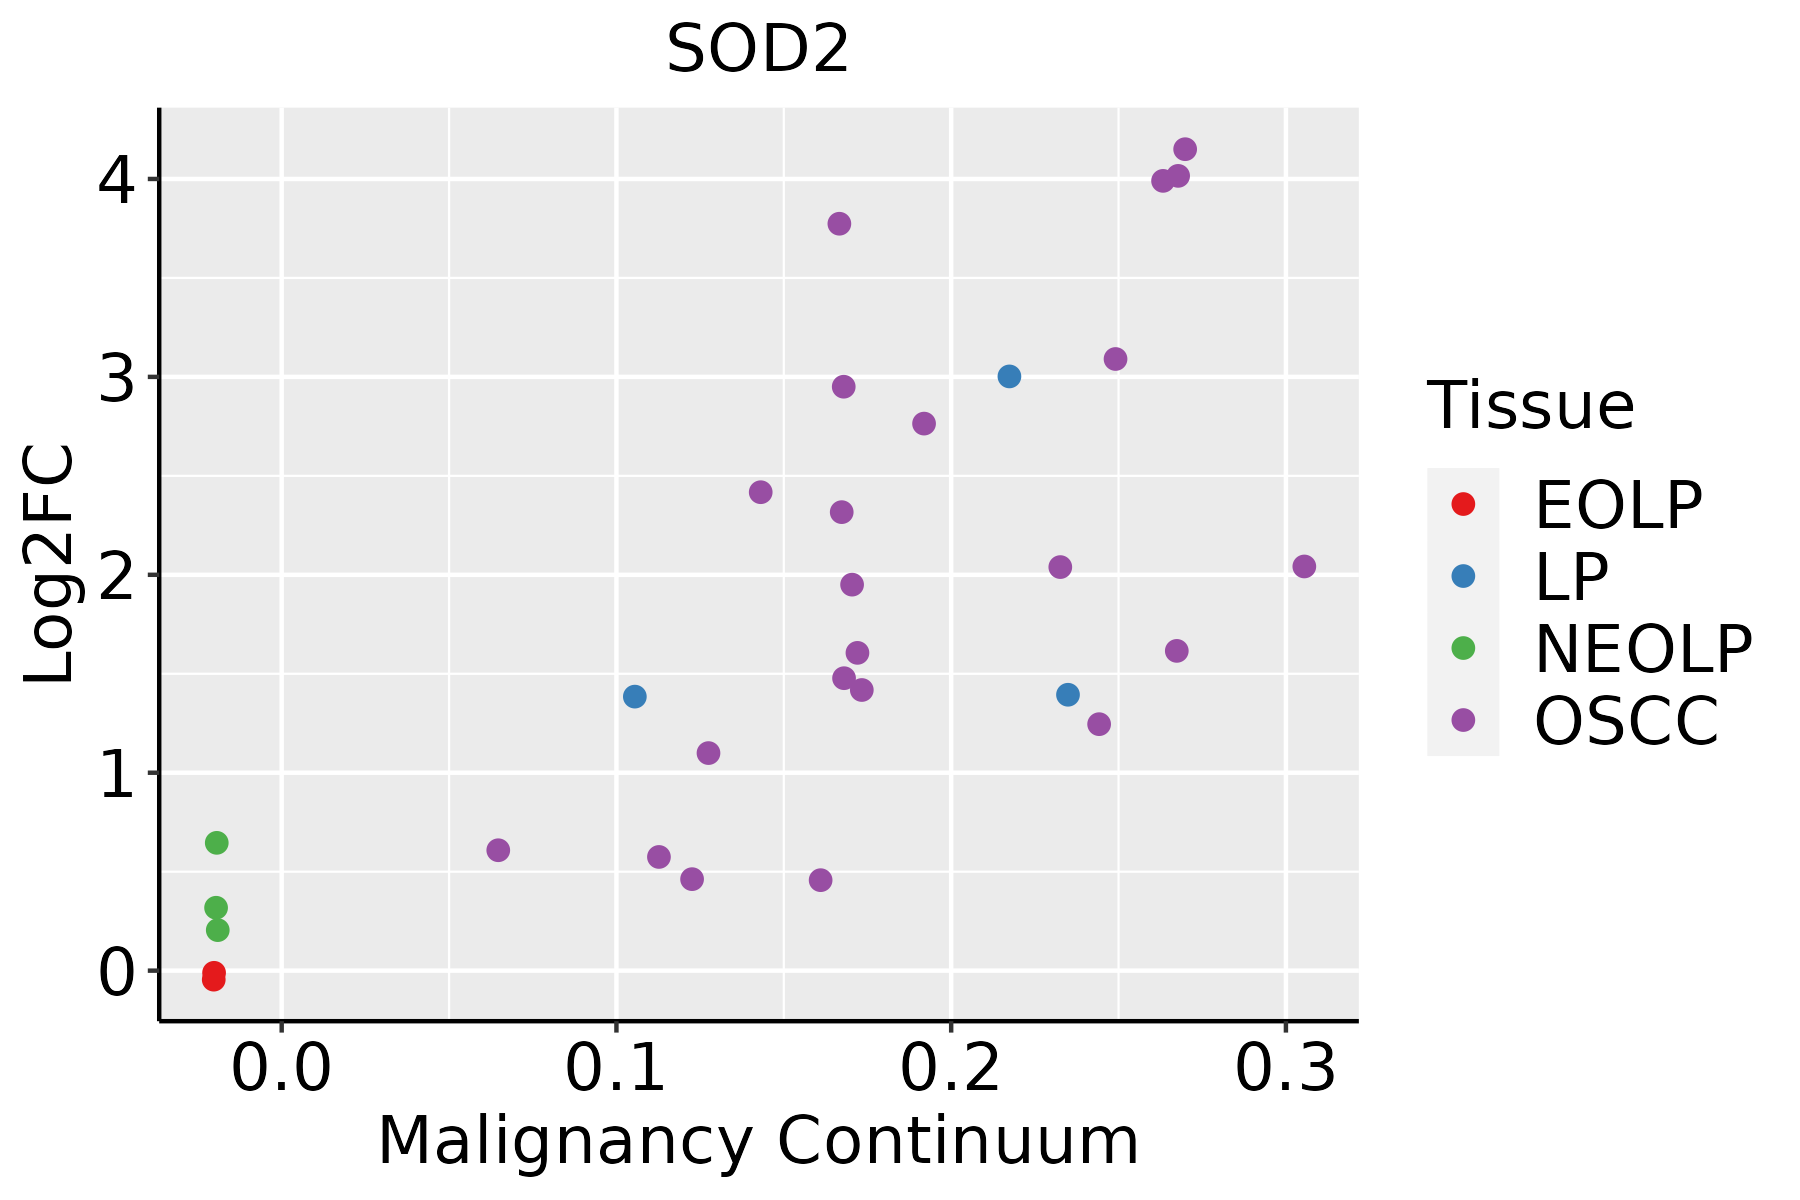 | EOLP: Erosive Oral lichen planus |
| LP: leukoplakia | ||
| NEOLP: Non-erosive oral lichen planus | ||
| OSCC: Oral squamous cell carcinoma | ||
| Prostate | 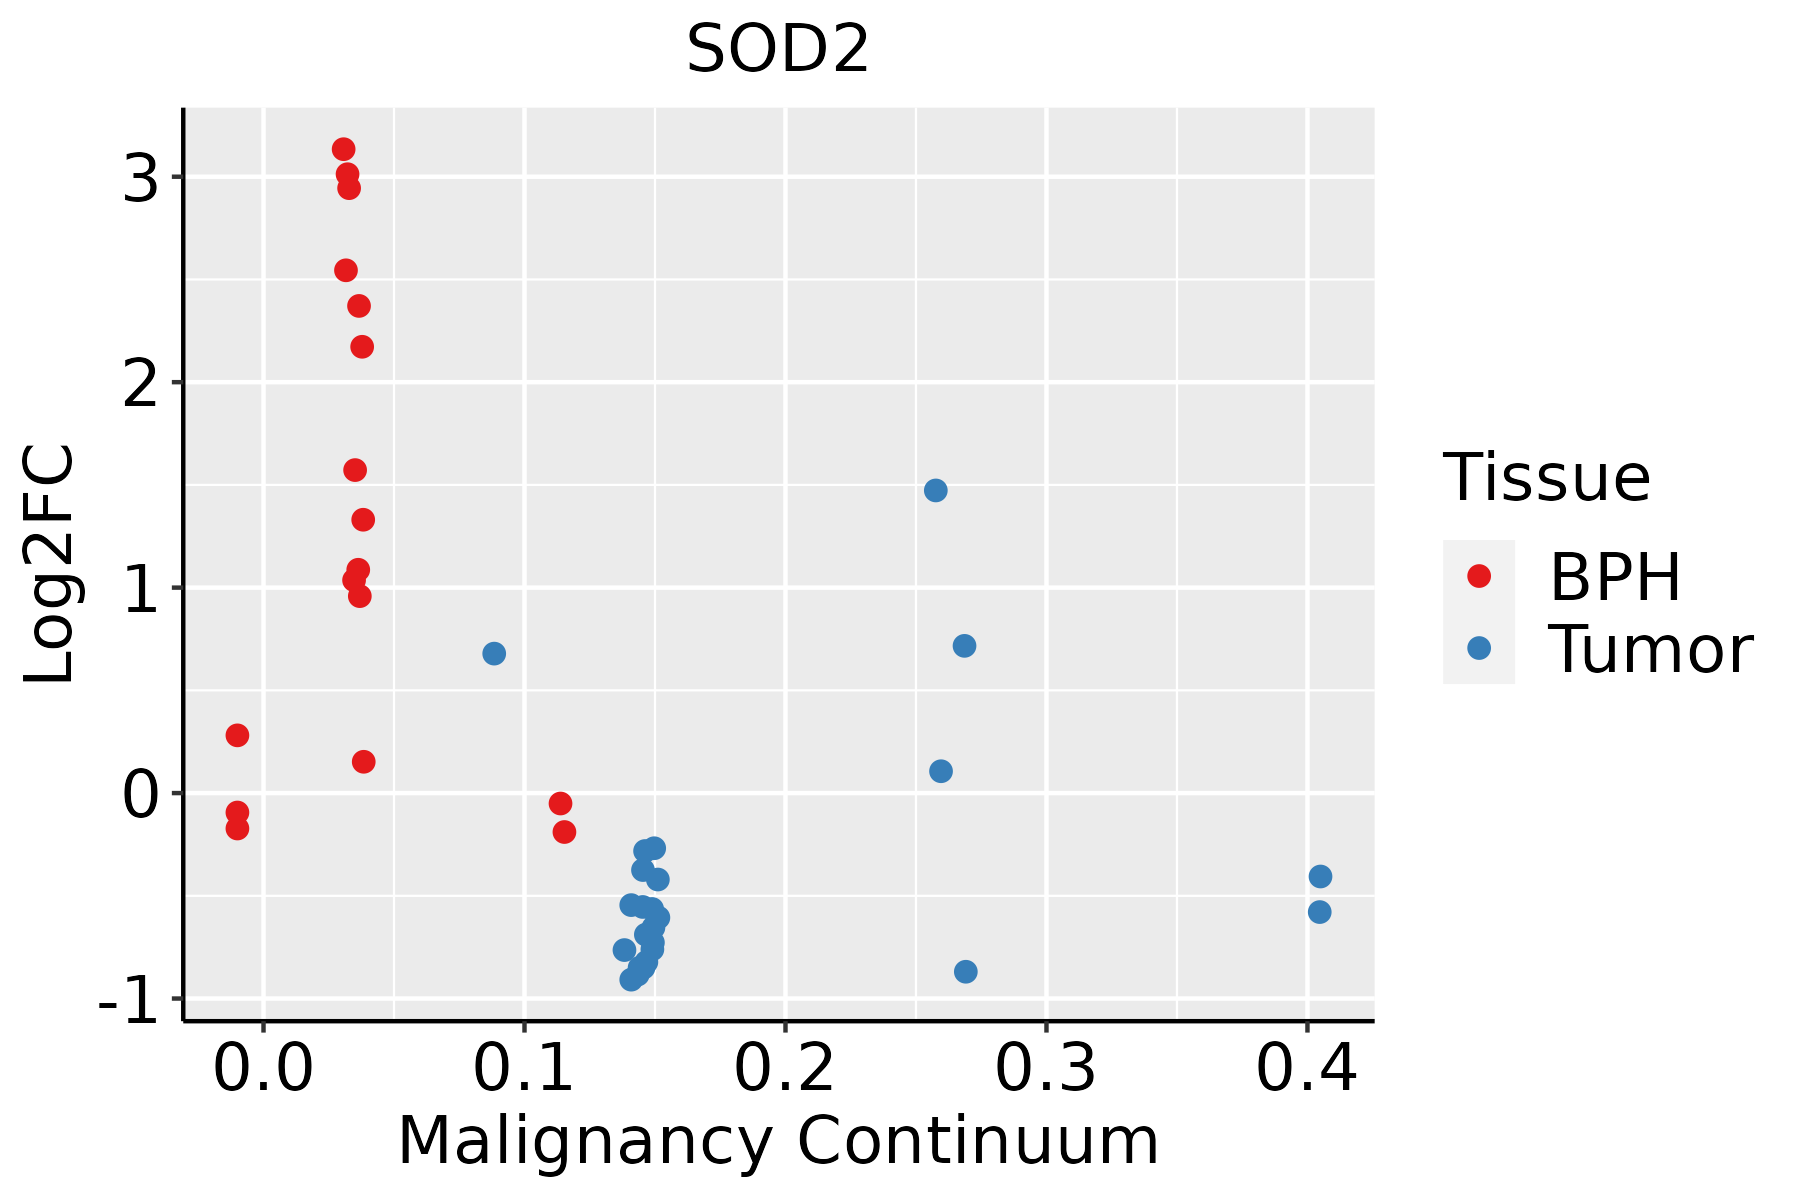 | BPH: Benign Prostatic Hyperplasia |
| Skin | 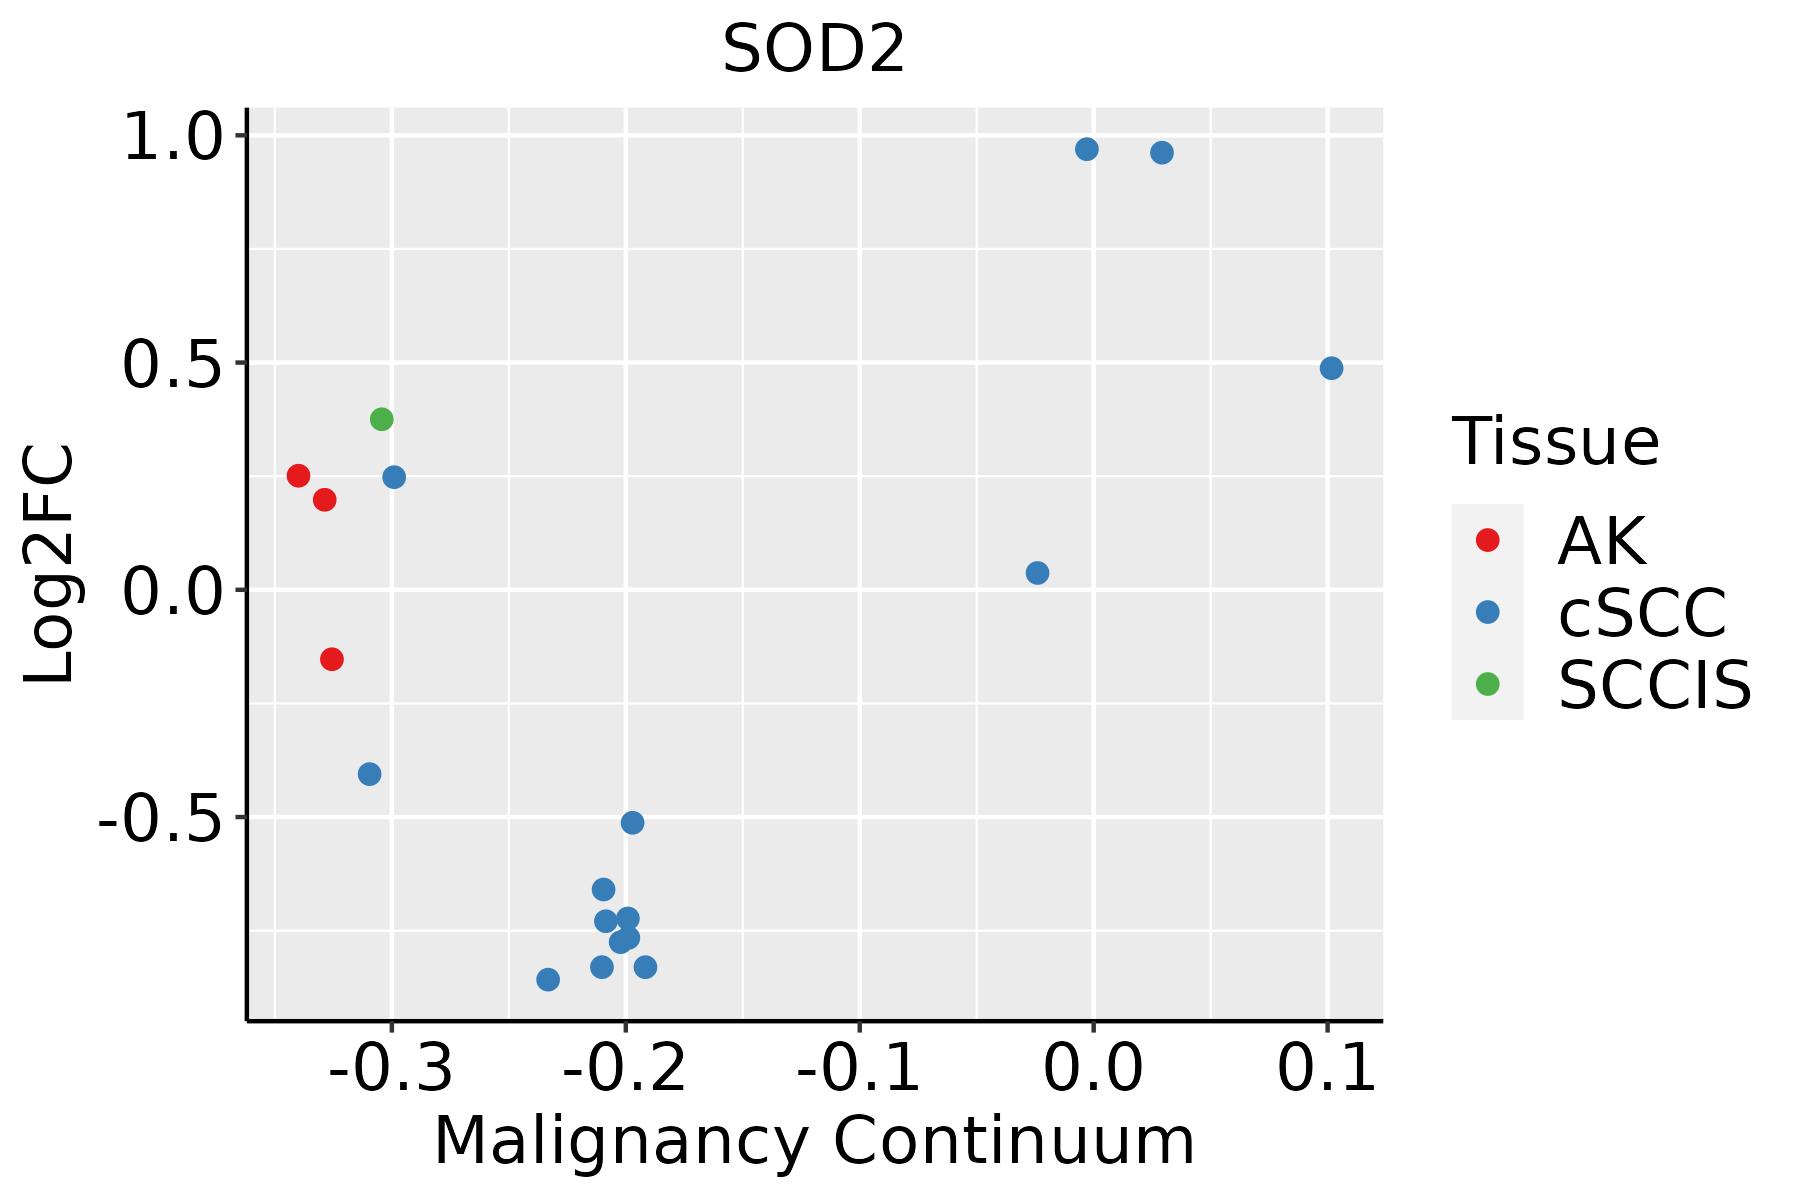 | AK: Actinic keratosis |
| cSCC: Cutaneous squamous cell carcinoma | ||
| SCCIS:squamous cell carcinoma in situ | ||
| Thyroid |  | ATC: Anaplastic thyroid cancer |
| HT: Hashimoto's thyroiditis | ||
| PTC: Papillary thyroid cancer |
| ∗log2FC in expression of this searched gene in stem-like cells from each diseased tissue sample relative to stem-like cells in normal samples in each tissue plotted against the malignancy continuum. Samples are colored based on if they are from different disease stage. |
Top |
Malignant transformation related pathway analysis |
| Find out the enriched GO biological processes and KEGG pathways involved in transition from healthy to precancer to cancer |
| Tissue | Disease Stage | Enriched GO biological Processes |
| Colorectum | AD |  |
| Colorectum | SER |  |
| Colorectum | MSS |  |
| Colorectum | MSI-H |  |
| Colorectum | FAP |  |
| ∗Top 15 enriched GO BP terms are showed in the bar plot of each disease state in each tissue. Each row represents a significant GO biological process which is colored according to the -log10(p.adjust). |
| Page: 1 2 3 4 5 6 7 8 9 |
| GO ID | Tissue | Disease Stage | Description | Gene Ratio | Bg Ratio | pvalue | p.adjust | Count |
| GO:190320122 | Breast | DCIS | regulation of oxidative stress-induced cell death | 15/1390 | 74/18723 | 3.00e-04 | 4.36e-03 | 15 |
| GO:200037922 | Breast | DCIS | positive regulation of reactive oxygen species metabolic process | 15/1390 | 76/18723 | 4.06e-04 | 5.54e-03 | 15 |
| GO:004352421 | Breast | DCIS | negative regulation of neuron apoptotic process | 23/1390 | 145/18723 | 4.27e-04 | 5.72e-03 | 23 |
| GO:009730524 | Breast | DCIS | response to alcohol | 34/1390 | 253/18723 | 5.54e-04 | 7.09e-03 | 34 |
| GO:190121521 | Breast | DCIS | negative regulation of neuron death | 29/1390 | 208/18723 | 7.58e-04 | 8.95e-03 | 29 |
| GO:000940922 | Breast | DCIS | response to cold | 11/1390 | 49/18723 | 7.63e-04 | 8.95e-03 | 11 |
| GO:004274321 | Breast | DCIS | hydrogen peroxide metabolic process | 12/1390 | 58/18723 | 9.71e-04 | 1.08e-02 | 12 |
| GO:200037723 | Breast | DCIS | regulation of reactive oxygen species metabolic process | 23/1390 | 157/18723 | 1.31e-03 | 1.37e-02 | 23 |
| GO:003647322 | Breast | DCIS | cell death in response to oxidative stress | 16/1390 | 95/18723 | 1.61e-03 | 1.60e-02 | 16 |
| GO:190040722 | Breast | DCIS | regulation of cellular response to oxidative stress | 15/1390 | 89/18723 | 2.20e-03 | 2.04e-02 | 15 |
| GO:190288223 | Breast | DCIS | regulation of response to oxidative stress | 16/1390 | 98/18723 | 2.24e-03 | 2.05e-02 | 16 |
| GO:004865911 | Breast | DCIS | smooth muscle cell proliferation | 25/1390 | 184/18723 | 2.42e-03 | 2.18e-02 | 25 |
| GO:190217622 | Breast | DCIS | negative regulation of oxidative stress-induced intrinsic apoptotic signaling pathway | 6/1390 | 20/18723 | 2.59e-03 | 2.30e-02 | 6 |
| GO:004547111 | Breast | DCIS | response to ethanol | 20/1390 | 137/18723 | 2.73e-03 | 2.40e-02 | 20 |
| GO:00332731 | Breast | DCIS | response to vitamin | 15/1390 | 93/18723 | 3.42e-03 | 2.85e-02 | 15 |
| GO:004866011 | Breast | DCIS | regulation of smooth muscle cell proliferation | 24/1390 | 180/18723 | 3.74e-03 | 3.01e-02 | 24 |
| GO:004269211 | Breast | DCIS | muscle cell differentiation | 43/1390 | 384/18723 | 4.56e-03 | 3.49e-02 | 43 |
| GO:190320221 | Breast | DCIS | negative regulation of oxidative stress-induced cell death | 10/1390 | 53/18723 | 5.08e-03 | 3.75e-02 | 10 |
| GO:00423911 | Breast | DCIS | regulation of membrane potential | 47/1390 | 434/18723 | 5.87e-03 | 4.20e-02 | 47 |
| GO:009719310 | Cervix | CC | intrinsic apoptotic signaling pathway | 85/2311 | 288/18723 | 4.56e-15 | 6.46e-12 | 85 |
| Page: 1 2 3 4 5 6 7 8 9 10 11 12 13 14 15 16 17 18 19 20 21 22 23 24 25 26 27 28 29 30 31 32 33 34 35 36 37 38 39 40 41 42 43 44 45 46 47 48 49 50 51 52 53 54 55 56 57 58 59 60 61 62 63 64 65 66 67 68 69 70 71 72 73 74 75 76 77 78 79 80 81 82 |
| Pathway ID | Tissue | Disease Stage | Description | Gene Ratio | Bg Ratio | pvalue | p.adjust | qvalue | Count |
| hsa0501616 | Breast | Precancer | Huntington disease | 98/684 | 306/8465 | 2.85e-35 | 2.25e-33 | 1.72e-33 | 98 |
| hsa0520818 | Breast | Precancer | Chemical carcinogenesis - reactive oxygen species | 68/684 | 223/8465 | 3.61e-23 | 1.14e-21 | 8.73e-22 | 68 |
| hsa0541718 | Breast | Precancer | Lipid and atherosclerosis | 37/684 | 215/8465 | 7.64e-06 | 9.29e-05 | 7.12e-05 | 37 |
| hsa0501617 | Breast | Precancer | Huntington disease | 98/684 | 306/8465 | 2.85e-35 | 2.25e-33 | 1.72e-33 | 98 |
| hsa0520819 | Breast | Precancer | Chemical carcinogenesis - reactive oxygen species | 68/684 | 223/8465 | 3.61e-23 | 1.14e-21 | 8.73e-22 | 68 |
| hsa0541719 | Breast | Precancer | Lipid and atherosclerosis | 37/684 | 215/8465 | 7.64e-06 | 9.29e-05 | 7.12e-05 | 37 |
| hsa0501623 | Breast | IDC | Huntington disease | 103/867 | 306/8465 | 5.14e-30 | 4.17e-28 | 3.12e-28 | 103 |
| hsa0520824 | Breast | IDC | Chemical carcinogenesis - reactive oxygen species | 71/867 | 223/8465 | 2.55e-19 | 7.53e-18 | 5.63e-18 | 71 |
| hsa0541724 | Breast | IDC | Lipid and atherosclerosis | 35/867 | 215/8465 | 3.67e-03 | 2.29e-02 | 1.71e-02 | 35 |
| hsa0501633 | Breast | IDC | Huntington disease | 103/867 | 306/8465 | 5.14e-30 | 4.17e-28 | 3.12e-28 | 103 |
| hsa0520834 | Breast | IDC | Chemical carcinogenesis - reactive oxygen species | 71/867 | 223/8465 | 2.55e-19 | 7.53e-18 | 5.63e-18 | 71 |
| hsa0541734 | Breast | IDC | Lipid and atherosclerosis | 35/867 | 215/8465 | 3.67e-03 | 2.29e-02 | 1.71e-02 | 35 |
| hsa0501643 | Breast | DCIS | Huntington disease | 101/846 | 306/8465 | 1.54e-29 | 1.24e-27 | 9.13e-28 | 101 |
| hsa0520843 | Breast | DCIS | Chemical carcinogenesis - reactive oxygen species | 70/846 | 223/8465 | 2.82e-19 | 8.29e-18 | 6.10e-18 | 70 |
| hsa0541744 | Breast | DCIS | Lipid and atherosclerosis | 34/846 | 215/8465 | 4.50e-03 | 2.46e-02 | 1.82e-02 | 34 |
| hsa0501653 | Breast | DCIS | Huntington disease | 101/846 | 306/8465 | 1.54e-29 | 1.24e-27 | 9.13e-28 | 101 |
| hsa0520853 | Breast | DCIS | Chemical carcinogenesis - reactive oxygen species | 70/846 | 223/8465 | 2.82e-19 | 8.29e-18 | 6.10e-18 | 70 |
| hsa0541754 | Breast | DCIS | Lipid and atherosclerosis | 34/846 | 215/8465 | 4.50e-03 | 2.46e-02 | 1.82e-02 | 34 |
| hsa0520820 | Cervix | CC | Chemical carcinogenesis - reactive oxygen species | 92/1267 | 223/8465 | 4.71e-22 | 5.09e-20 | 3.01e-20 | 92 |
| hsa0501618 | Cervix | CC | Huntington disease | 94/1267 | 306/8465 | 8.49e-13 | 3.06e-11 | 1.81e-11 | 94 |
| Page: 1 2 3 4 5 6 7 8 9 10 11 12 |
Top |
Cell-cell communication analysis |
| Identification of potential cell-cell interactions between two cell types and their ligand-receptor pairs for different disease states |
| Ligand | Receptor | LRpair | Pathway | Tissue | Disease Stage |
| Page: 1 |
Top |
Single-cell gene regulatory network inference analysis |
| Find out the significant the regulons (TFs) and the target genes of each regulon across cell types for different disease states |
| TF | Cell Type | Tissue | Disease Stage | Target Gene | RSS | Regulon Activity |
| ∗The dot plots of a searched regulon are shown for all cell subpopulations in each disease state of each tissue based on the regulon specific score inferred using pySCENIC and by calculating the average expression. |
| Page: 1 |
Top |
Somatic mutation of malignant transformation related genes |
| Annotation of somatic variants for genes involved in malignant transformation |
| Hugo Symbol | Variant Class | Variant Classification | dbSNP RS | HGVSc | HGVSp | HGVSp Short | SWISSPROT | BIOTYPE | SIFT | PolyPhen | Tumor Sample Barcode | Tissue | Histology | Sex | Age | Stage | Therapy Types | Drugs | Outcome |
| SOD2 | SNV | Missense_Mutation | c.562N>A | p.Ala188Thr | p.A188T | protein_coding | deleterious(0) | probably_damaging(1) | TCGA-A6-2686-01 | Colorectum | colon adenocarcinoma | Female | >=65 | I/II | Unknown | Unknown | SD | ||
| SOD2 | SNV | Missense_Mutation | novel | c.259N>A | p.Ala87Thr | p.A87T | protein_coding | deleterious(0) | possibly_damaging(0.734) | TCGA-A6-2686-01 | Colorectum | colon adenocarcinoma | Female | >=65 | I/II | Unknown | Unknown | SD | |
| SOD2 | SNV | Missense_Mutation | novel | c.581N>C | p.Lys194Thr | p.K194T | protein_coding | deleterious(0) | possibly_damaging(0.822) | TCGA-AA-3984-01 | Colorectum | colon adenocarcinoma | Female | <65 | I/II | Unknown | Unknown | SD | |
| SOD2 | SNV | Missense_Mutation | c.229G>A | p.Asp77Asn | p.D77N | protein_coding | tolerated(0.07) | benign(0.226) | TCGA-AA-A00N-01 | Colorectum | colon adenocarcinoma | Male | >=65 | I/II | Unknown | Unknown | PD | ||
| SOD2 | SNV | Missense_Mutation | c.409N>A | p.Ala137Thr | p.A137T | protein_coding | tolerated(0.28) | benign(0.007) | TCGA-AA-A01P-01 | Colorectum | colon adenocarcinoma | Female | >=65 | III/IV | Unknown | Unknown | PD | ||
| SOD2 | SNV | Missense_Mutation | rs143582231 | c.367N>T | p.Arg123Cys | p.R123C | protein_coding | deleterious(0) | benign(0.021) | TCGA-AA-A02O-01 | Colorectum | colon adenocarcinoma | Male | >=65 | I/II | Unknown | Unknown | SD | |
| SOD2 | SNV | Missense_Mutation | rs372074075 | c.407N>T | p.Thr136Met | p.T136M | protein_coding | deleterious(0.03) | possibly_damaging(0.47) | TCGA-AU-6004-01 | Colorectum | colon adenocarcinoma | Female | >=65 | I/II | Unknown | Unknown | SD | |
| SOD2 | SNV | Missense_Mutation | c.501N>T | p.Gln167His | p.Q167H | protein_coding | deleterious(0) | probably_damaging(0.999) | TCGA-QL-A97D-01 | Colorectum | colon adenocarcinoma | Female | >=65 | I/II | Unknown | Unknown | SD | ||
| SOD2 | SNV | Missense_Mutation | novel | c.182N>G | p.Asn61Ser | p.N61S | protein_coding | deleterious(0.05) | possibly_damaging(0.481) | TCGA-AX-A2HJ-01 | Endometrium | uterine corpus endometrioid carcinoma | Female | <65 | I/II | Unknown | Unknown | SD | |
| SOD2 | SNV | Missense_Mutation | c.571N>A | p.Leu191Ile | p.L191I | protein_coding | deleterious(0.01) | probably_damaging(0.998) | TCGA-B5-A0JR-01 | Endometrium | uterine corpus endometrioid carcinoma | Female | >=65 | I/II | Unknown | Unknown | SD |
| Page: 1 2 3 |
Top |
Related drugs of malignant transformation related genes |
| Identification of chemicals and drugs interact with genes involved in malignant transfromation |
| (DGIdb 4.0) |
| Entrez ID | Symbol | Category | Interaction Types | Drug Claim Name | Drug Name | PMIDs |
| 6648 | SOD2 | ENZYME, DRUGGABLE GENOME, CLINICALLY ACTIONABLE | cyclophosphamide | CYCLOPHOSPHAMIDE | ||
| 6648 | SOD2 | ENZYME, DRUGGABLE GENOME, CLINICALLY ACTIONABLE | asparaginase | ASPARAGINASE | 27019981 | |
| 6648 | SOD2 | ENZYME, DRUGGABLE GENOME, CLINICALLY ACTIONABLE | heroin | DIACETYLMORPHINE | 29459008 | |
| 6648 | SOD2 | ENZYME, DRUGGABLE GENOME, CLINICALLY ACTIONABLE | ANTIOXIDANT | 12007958 | ||
| 6648 | SOD2 | ENZYME, DRUGGABLE GENOME, CLINICALLY ACTIONABLE | valproic acid | |||
| 6648 | SOD2 | ENZYME, DRUGGABLE GENOME, CLINICALLY ACTIONABLE | paclitaxel | PACLITAXEL | 25495407 | |
| 6648 | SOD2 | ENZYME, DRUGGABLE GENOME, CLINICALLY ACTIONABLE | methotrexate | METHOTREXATE | 25330300 |
| Page: 1 |

Copyright 2023-Present -The University of Texas Health Science Center at Houston |