| Tissue | Expression Dynamics | Abbreviation |
| Cervix | 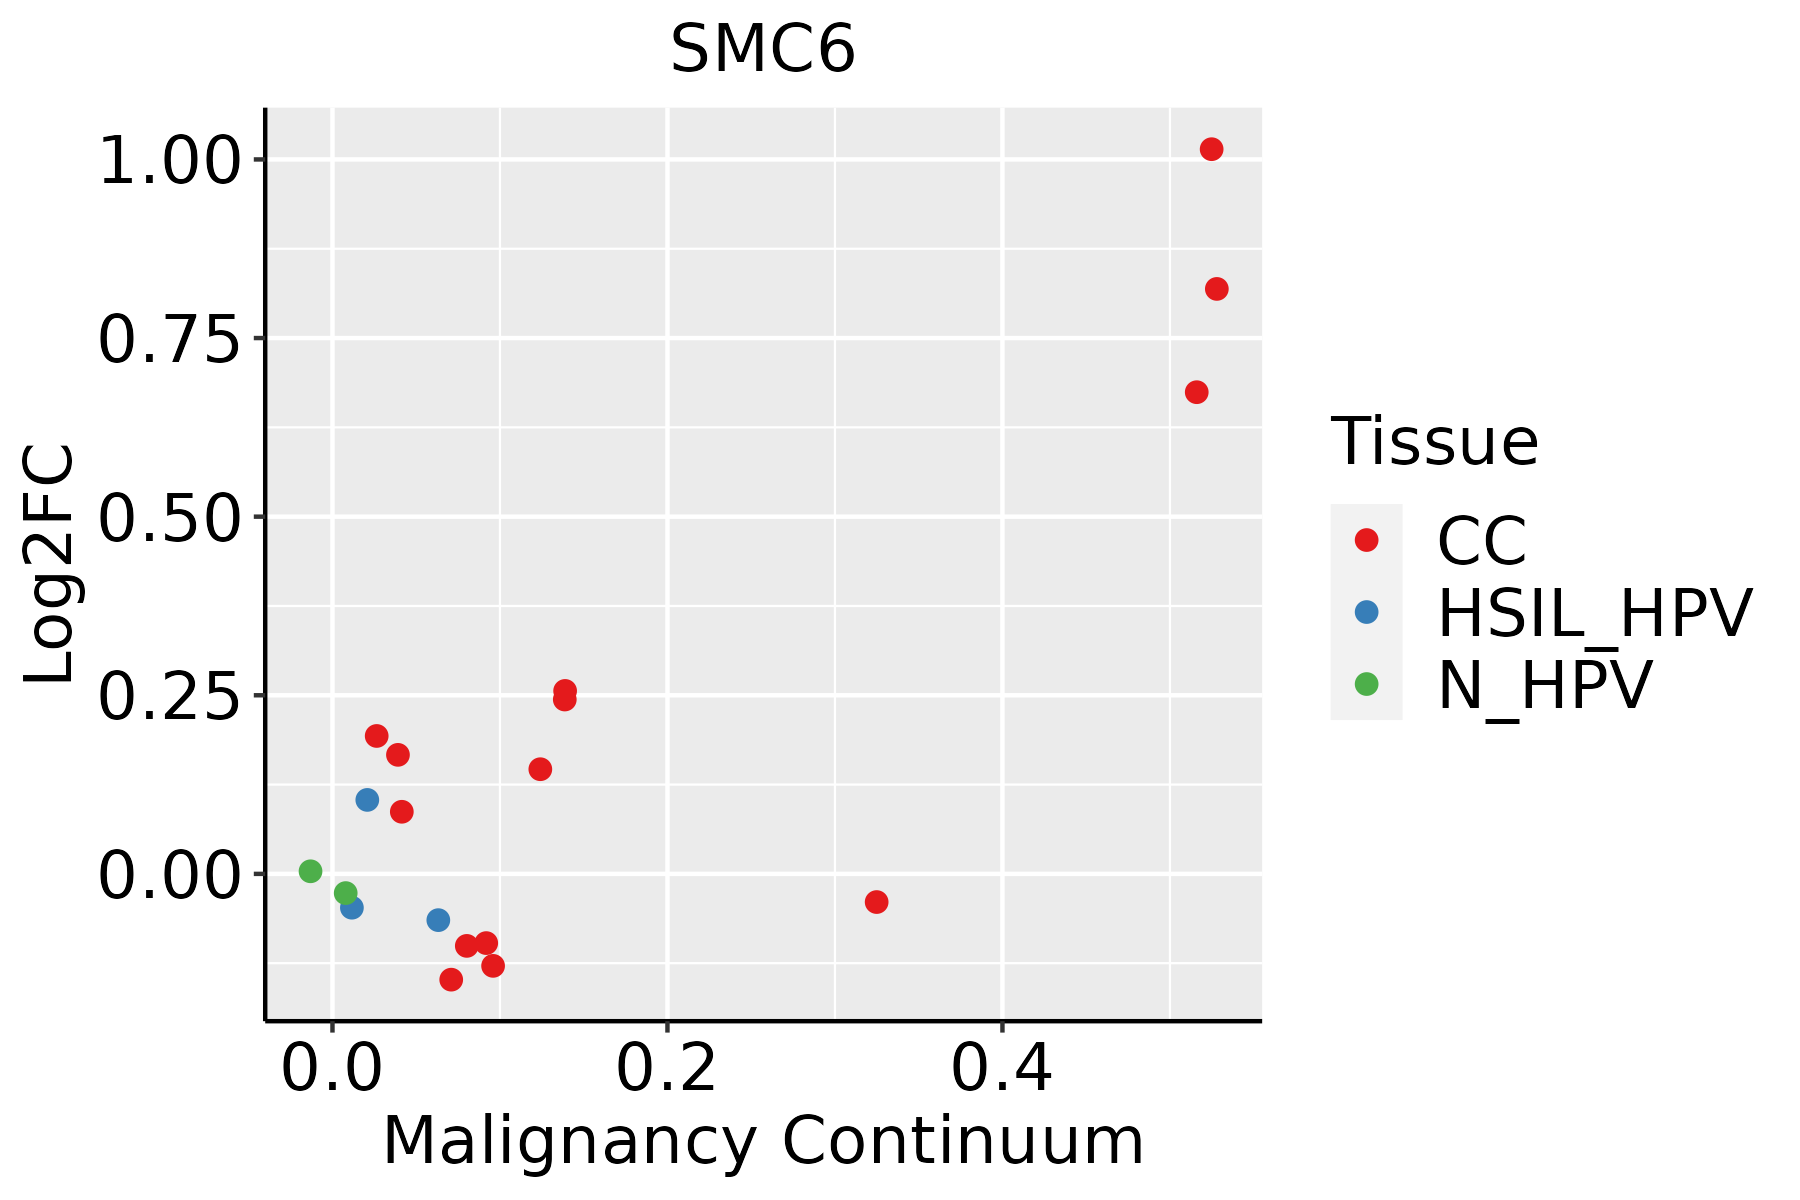 | CC: Cervix cancer |
| HSIL_HPV: HPV-infected high-grade squamous intraepithelial lesions |
| N_HPV: HPV-infected normal cervix |
| Esophagus | 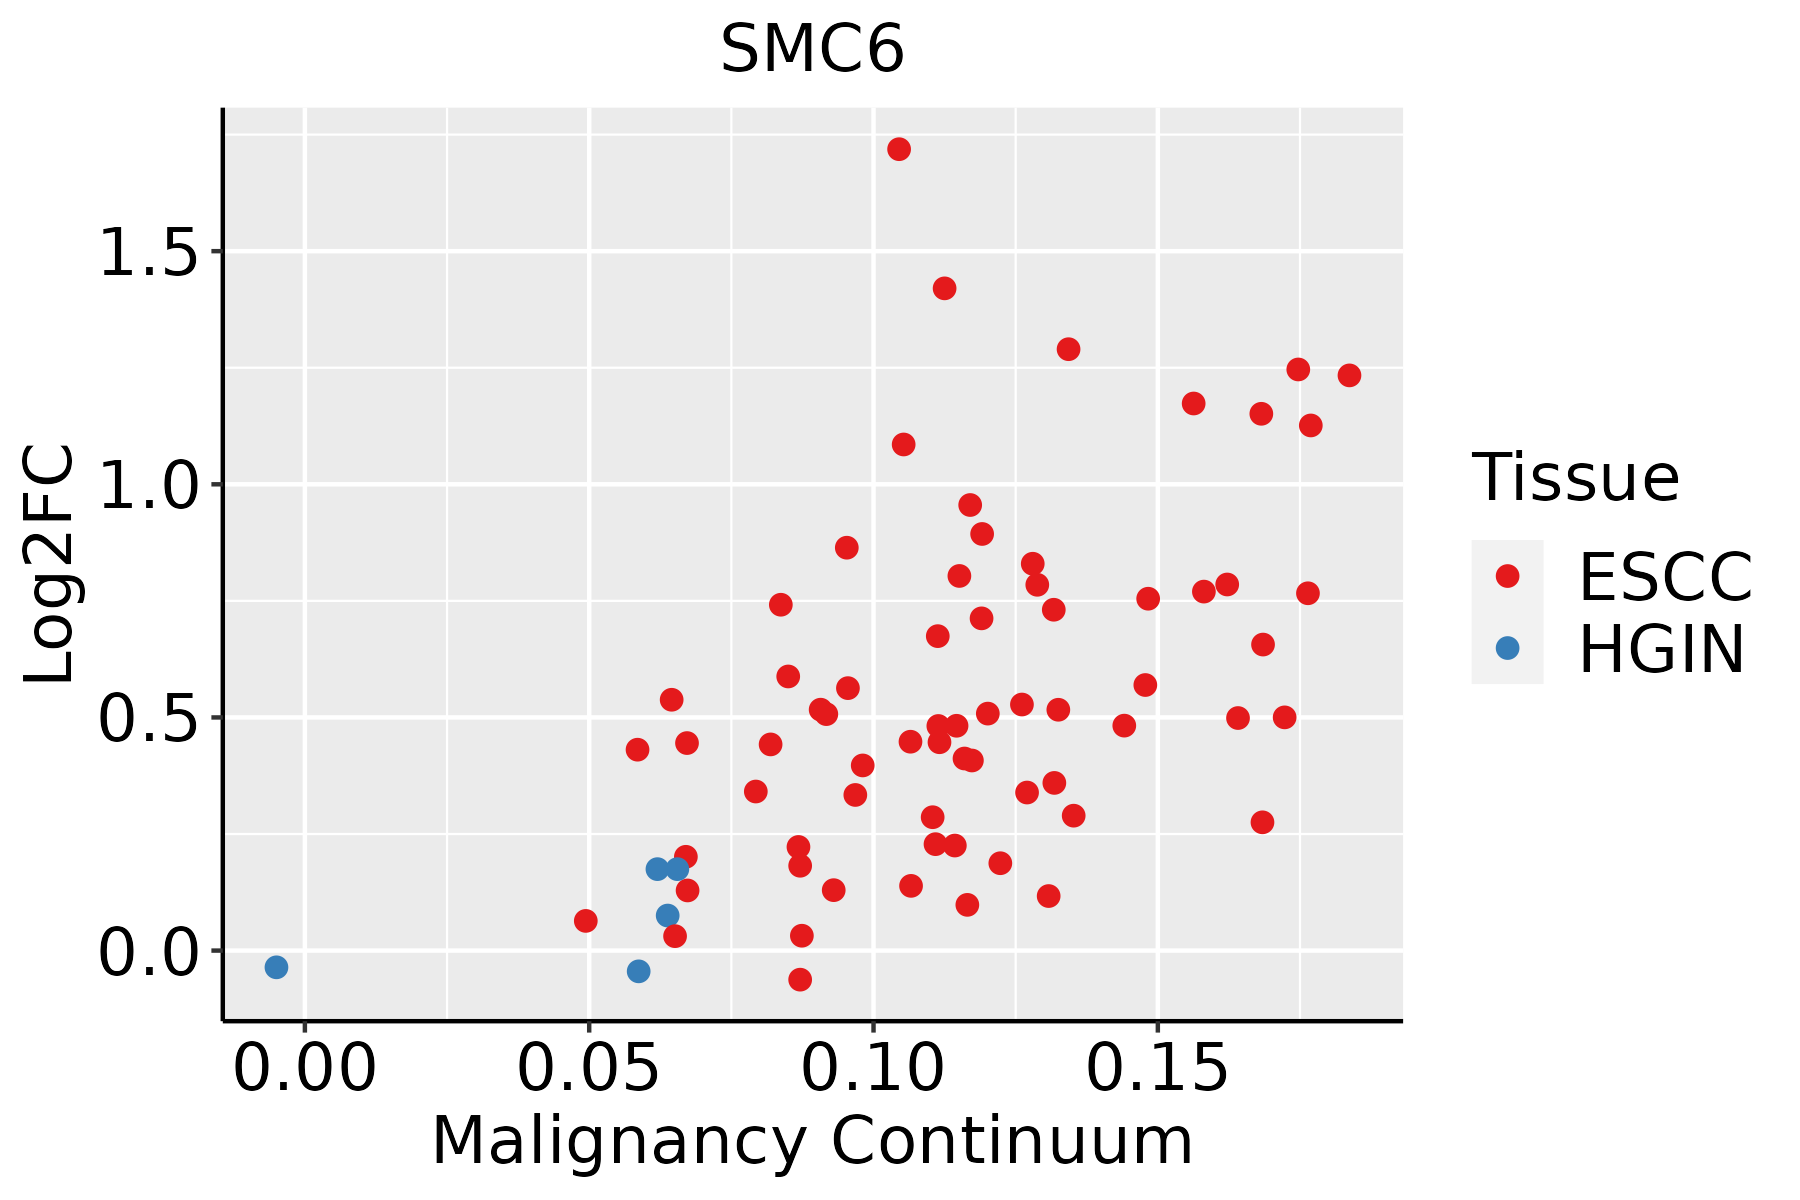 | ESCC: Esophageal squamous cell carcinoma |
| HGIN: High-grade intraepithelial neoplasias |
| LGIN: Low-grade intraepithelial neoplasias |
| Liver |  | HCC: Hepatocellular carcinoma |
| NAFLD: Non-alcoholic fatty liver disease |
| Oral Cavity | 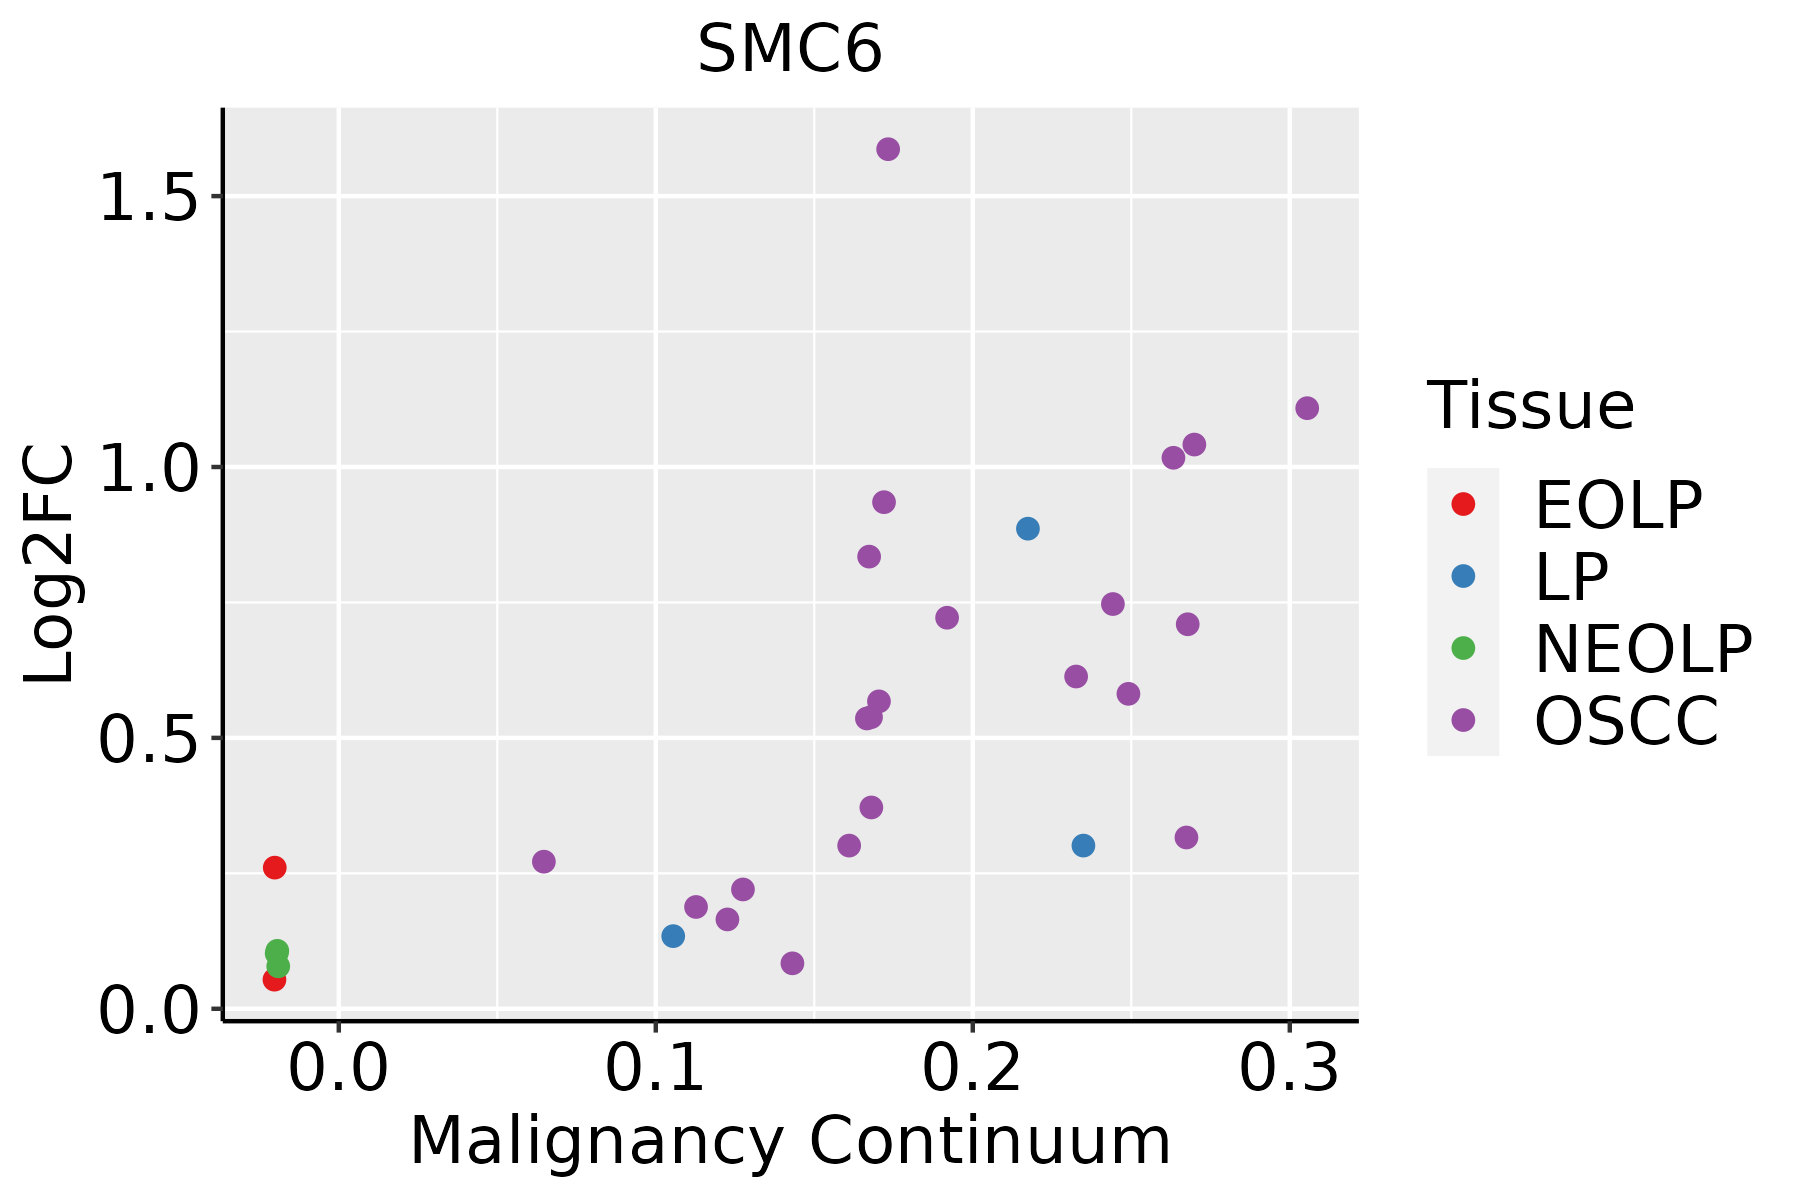 | EOLP: Erosive Oral lichen planus |
| LP: leukoplakia |
| NEOLP: Non-erosive oral lichen planus |
| OSCC: Oral squamous cell carcinoma |
| Prostate | 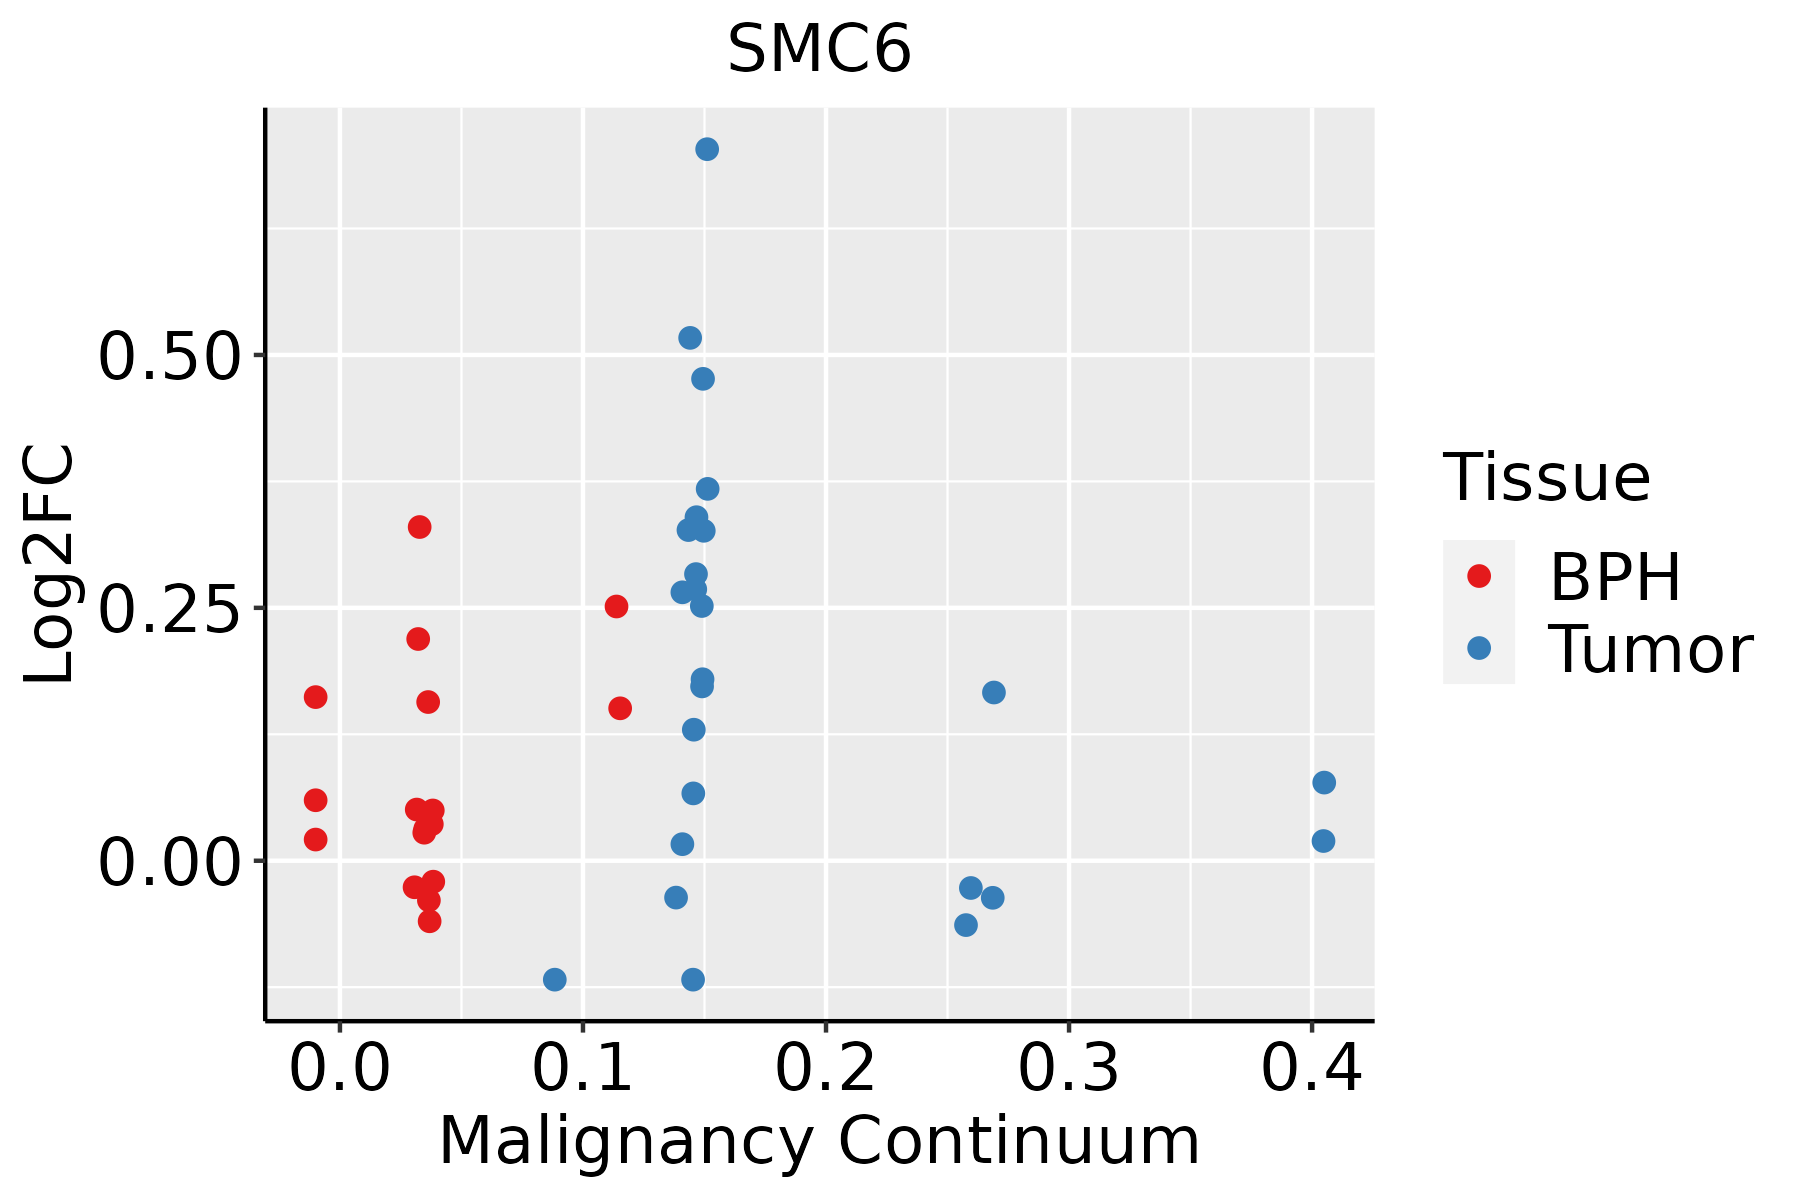 | BPH: Benign Prostatic Hyperplasia |
| Skin | 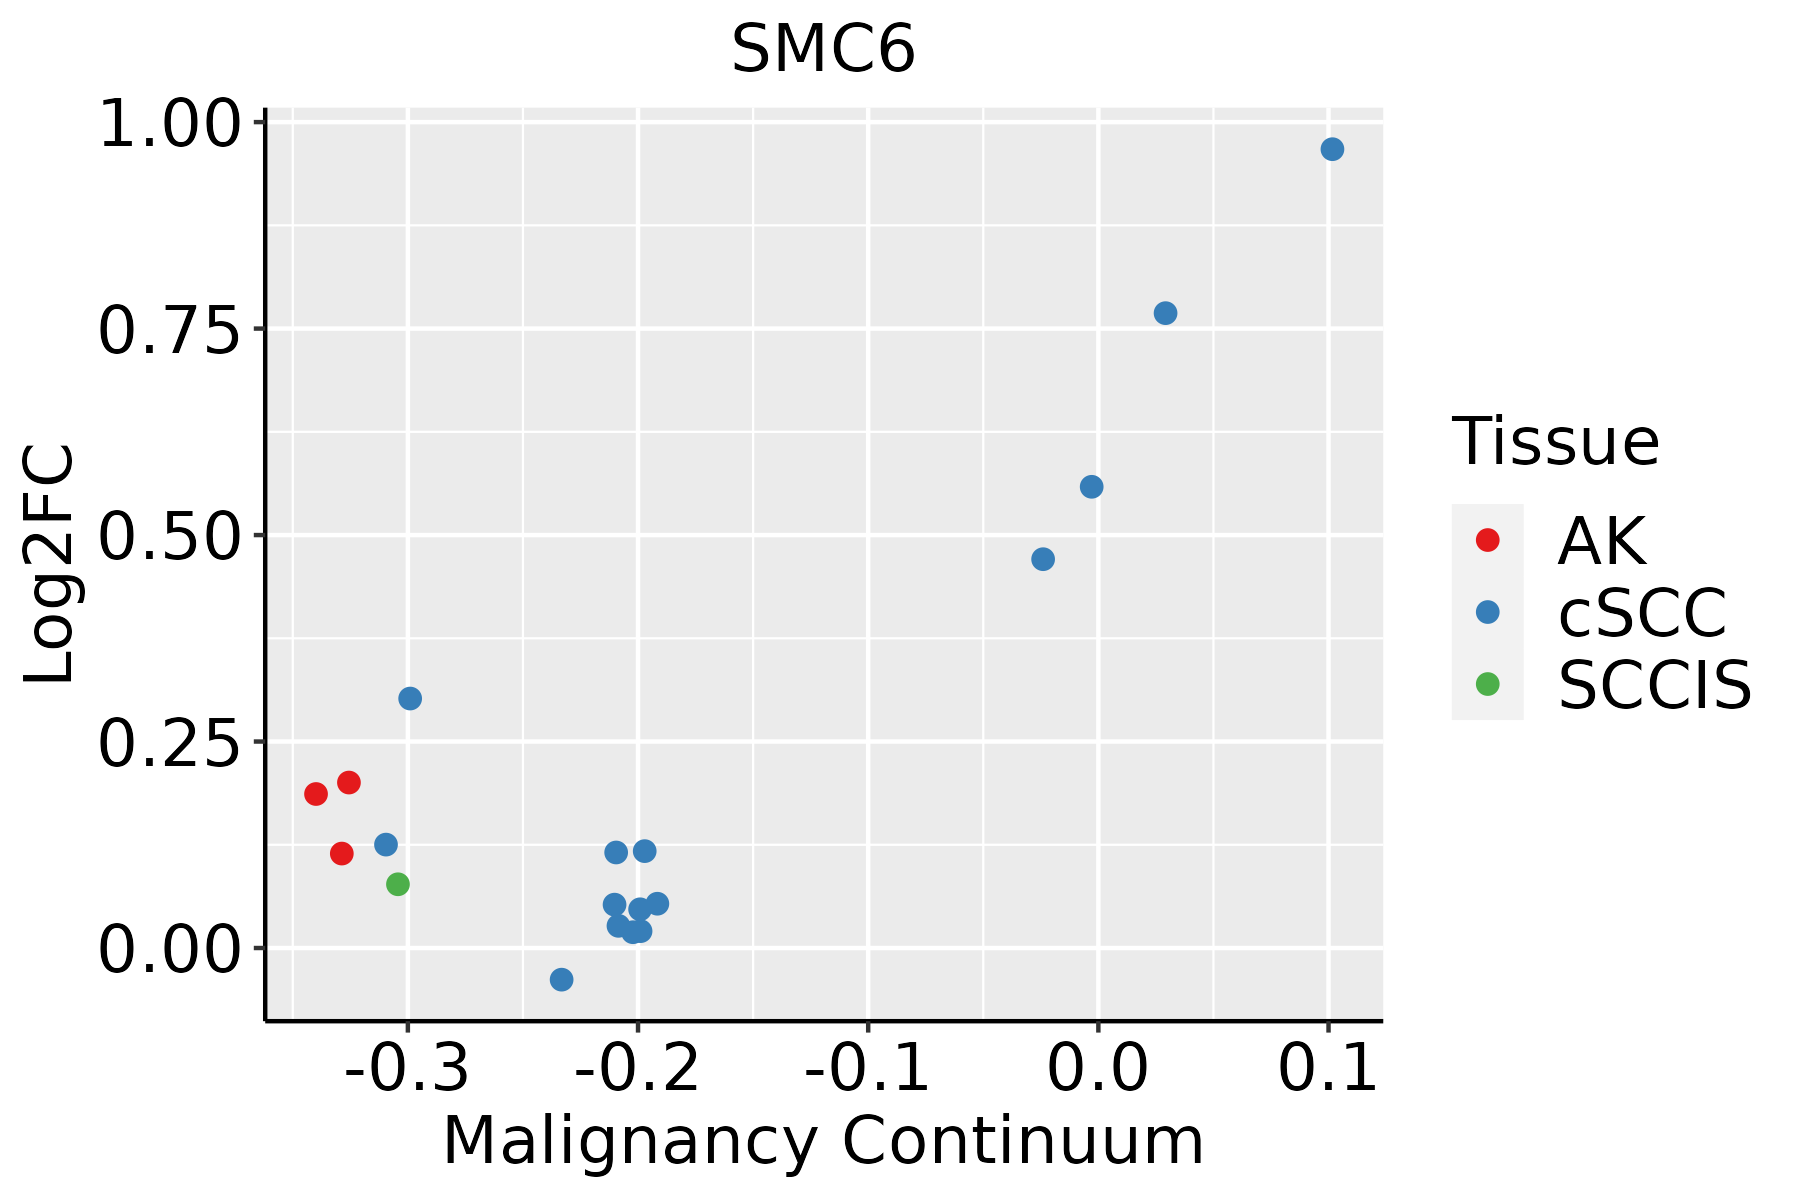 | AK: Actinic keratosis |
| cSCC: Cutaneous squamous cell carcinoma |
| SCCIS:squamous cell carcinoma in situ |
| Thyroid | 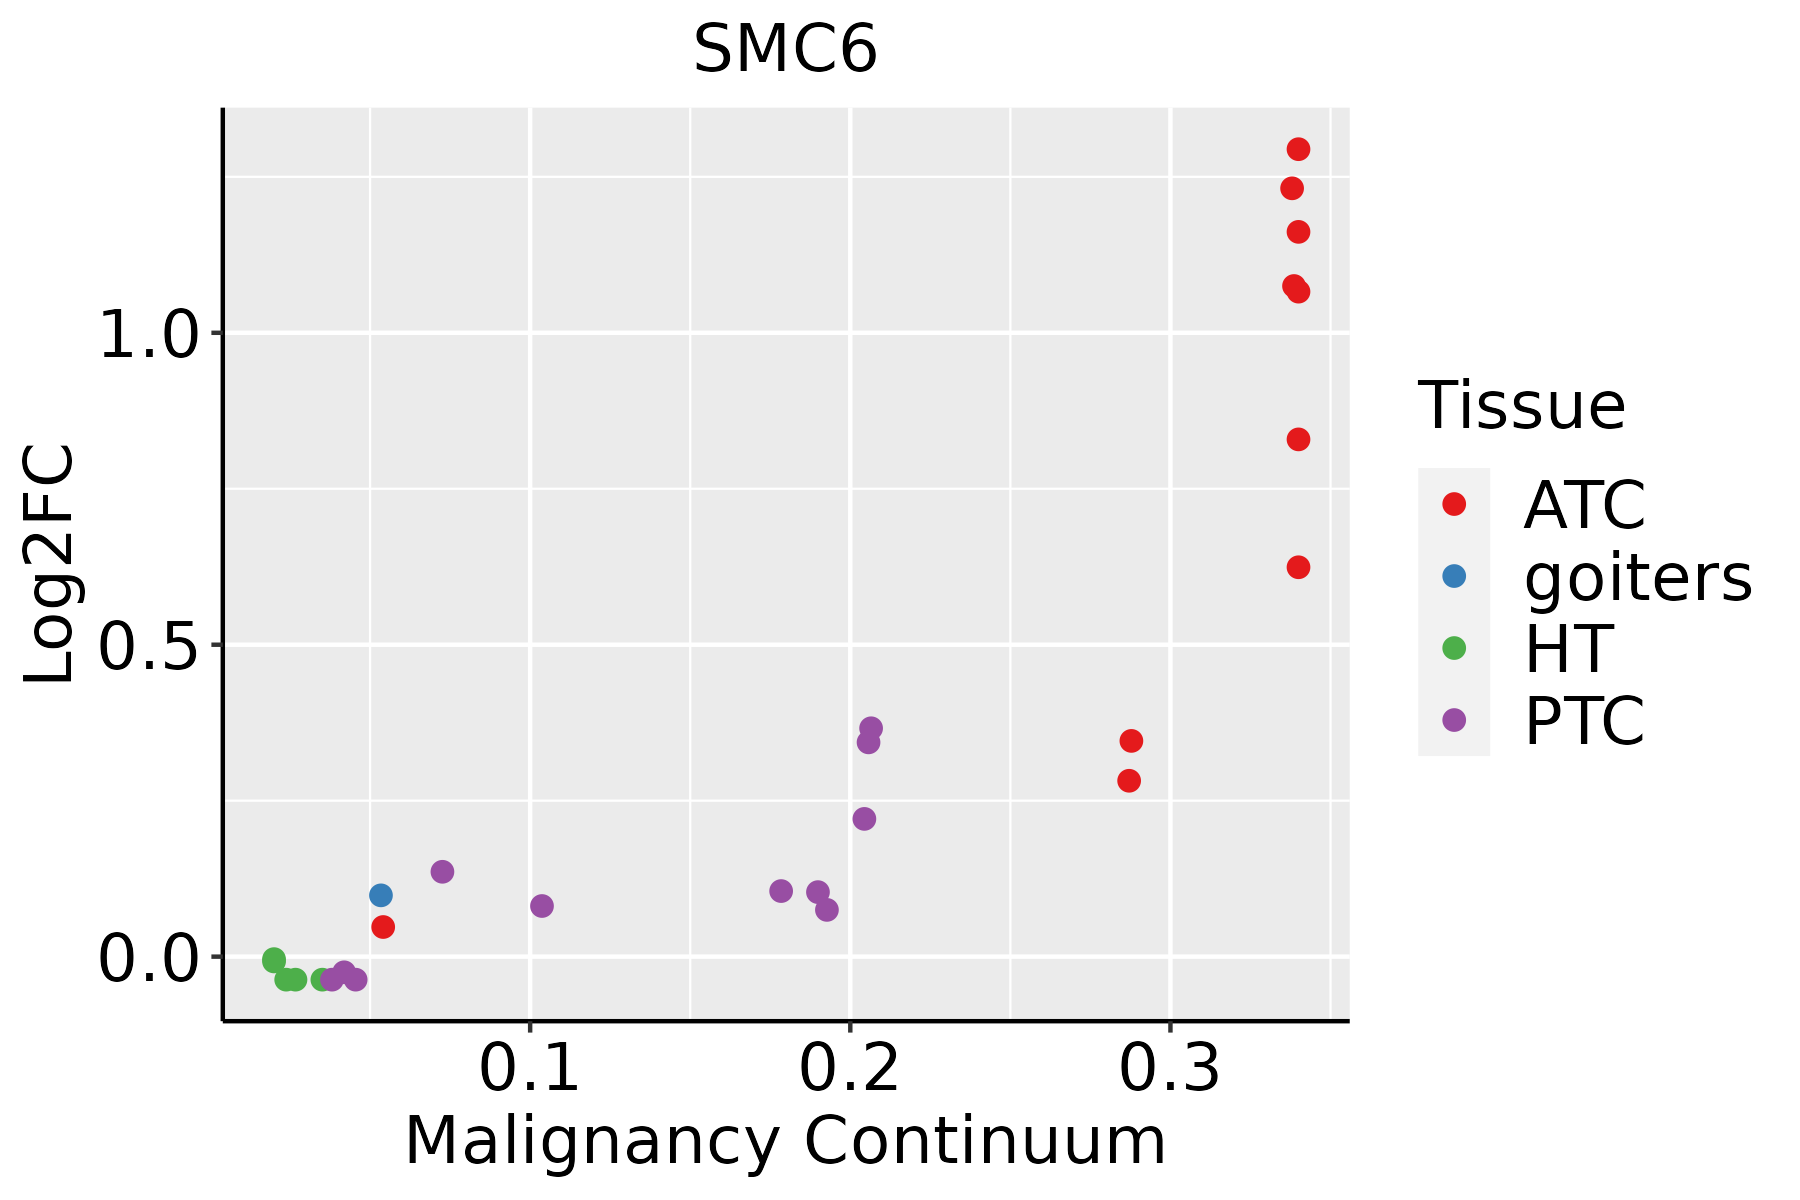 | ATC: Anaplastic thyroid cancer |
| HT: Hashimoto's thyroiditis |
| PTC: Papillary thyroid cancer |
| GO ID | Tissue | Disease Stage | Description | Gene Ratio | Bg Ratio | pvalue | p.adjust | Count |
| GO:20001423 | Oral cavity | OSCC | regulation of DNA-templated transcription, initiation | 26/7305 | 40/18723 | 7.79e-04 | 4.23e-03 | 26 |
| GO:20001442 | Oral cavity | OSCC | positive regulation of DNA-templated transcription, initiation | 21/7305 | 31/18723 | 1.13e-03 | 5.75e-03 | 21 |
| GO:007084116 | Oral cavity | OSCC | inclusion body assembly | 17/7305 | 24/18723 | 1.59e-03 | 7.56e-03 | 17 |
| GO:00602602 | Oral cavity | OSCC | regulation of transcription initiation from RNA polymerase II promoter | 21/7305 | 33/18723 | 3.63e-03 | 1.51e-02 | 21 |
| GO:0000725 | Oral cavity | OSCC | recombinational repair | 70/7305 | 140/18723 | 5.22e-03 | 2.03e-02 | 70 |
| GO:0000724 | Oral cavity | OSCC | double-strand break repair via homologous recombination | 69/7305 | 138/18723 | 5.52e-03 | 2.14e-02 | 69 |
| GO:00903983 | Oral cavity | OSCC | cellular senescence | 48/7305 | 93/18723 | 9.03e-03 | 3.26e-02 | 48 |
| GO:00602611 | Oral cavity | OSCC | positive regulation of transcription initiation from RNA polymerase II promoter | 16/7305 | 25/18723 | 1.00e-02 | 3.49e-02 | 16 |
| GO:0010498110 | Oral cavity | LP | proteasomal protein catabolic process | 224/4623 | 490/18723 | 9.57e-25 | 4.00e-22 | 224 |
| GO:0043161110 | Oral cavity | LP | proteasome-mediated ubiquitin-dependent protein catabolic process | 190/4623 | 412/18723 | 1.08e-21 | 2.93e-19 | 190 |
| GO:0034976110 | Oral cavity | LP | response to endoplasmic reticulum stress | 133/4623 | 256/18723 | 3.84e-21 | 9.24e-19 | 133 |
| GO:0042176110 | Oral cavity | LP | regulation of protein catabolic process | 177/4623 | 391/18723 | 3.00e-19 | 5.87e-17 | 177 |
| GO:0045862110 | Oral cavity | LP | positive regulation of proteolysis | 165/4623 | 372/18723 | 5.40e-17 | 8.46e-15 | 165 |
| GO:1903362110 | Oral cavity | LP | regulation of cellular protein catabolic process | 119/4623 | 255/18723 | 1.52e-14 | 1.76e-12 | 119 |
| GO:1903050110 | Oral cavity | LP | regulation of proteolysis involved in cellular protein catabolic process | 101/4623 | 221/18723 | 7.00e-12 | 5.48e-10 | 101 |
| GO:0061136110 | Oral cavity | LP | regulation of proteasomal protein catabolic process | 89/4623 | 187/18723 | 8.05e-12 | 6.15e-10 | 89 |
| GO:003043313 | Oral cavity | LP | ubiquitin-dependent ERAD pathway | 50/4623 | 85/18723 | 2.12e-11 | 1.48e-09 | 50 |
| GO:0009896110 | Oral cavity | LP | positive regulation of catabolic process | 187/4623 | 492/18723 | 2.30e-11 | 1.58e-09 | 187 |
| GO:0045732110 | Oral cavity | LP | positive regulation of protein catabolic process | 103/4623 | 231/18723 | 2.68e-11 | 1.81e-09 | 103 |
| GO:003650314 | Oral cavity | LP | ERAD pathway | 57/4623 | 107/18723 | 1.99e-10 | 1.08e-08 | 57 |
| Hugo Symbol | Variant Class | Variant Classification | dbSNP RS | HGVSc | HGVSp | HGVSp Short | SWISSPROT | BIOTYPE | SIFT | PolyPhen | Tumor Sample Barcode | Tissue | Histology | Sex | Age | Stage | Therapy Types | Drugs | Outcome |
| SMC6 | SNV | Missense_Mutation | novel | c.179N>T | p.Ser60Leu | p.S60L | Q96SB8 | protein_coding | deleterious(0.01) | possibly_damaging(0.783) | TCGA-5L-AAT0-01 | Breast | breast invasive carcinoma | Female | <65 | I/II | Hormone Therapy | tamoxiphen | SD |
| SMC6 | SNV | Missense_Mutation | rs376248274 | c.2819N>A | p.Arg940Gln | p.R940Q | Q96SB8 | protein_coding | tolerated(0.22) | possibly_damaging(0.596) | TCGA-AN-A046-01 | Breast | breast invasive carcinoma | Female | >=65 | I/II | Unknown | Unknown | SD |
| SMC6 | SNV | Missense_Mutation | rs373857118 | c.745N>T | p.Arg249Cys | p.R249C | Q96SB8 | protein_coding | deleterious(0) | benign(0.133) | TCGA-AR-A0TS-01 | Breast | breast invasive carcinoma | Female | <65 | I/II | Chemotherapy | doxorubicin | SD |
| SMC6 | SNV | Missense_Mutation | novel | c.1570N>A | p.Glu524Lys | p.E524K | Q96SB8 | protein_coding | deleterious(0) | probably_damaging(1) | TCGA-BH-A0HF-01 | Breast | breast invasive carcinoma | Female | >=65 | I/II | Hormone Therapy | arimidex | SD |
| SMC6 | SNV | Missense_Mutation | | c.2240A>G | p.Glu747Gly | p.E747G | Q96SB8 | protein_coding | deleterious(0) | possibly_damaging(0.745) | TCGA-BH-A18G-01 | Breast | breast invasive carcinoma | Female | >=65 | I/II | Unknown | Unknown | SD |
| SMC6 | SNV | Missense_Mutation | | c.1694C>T | p.Ser565Phe | p.S565F | Q96SB8 | protein_coding | deleterious(0) | probably_damaging(0.993) | TCGA-EW-A1PB-01 | Breast | breast invasive carcinoma | Female | >=65 | III/IV | Unknown | Unknown | SD |
| SMC6 | SNV | Missense_Mutation | novel | c.1041N>T | p.Met347Ile | p.M347I | Q96SB8 | protein_coding | tolerated(1) | benign(0) | TCGA-S3-A6ZH-01 | Breast | breast invasive carcinoma | Female | <65 | III/IV | Chemotherapy | adriamycin | CR |
| SMC6 | insertion | Frame_Shift_Ins | novel | c.1867_1868insATCTTCTAAGTCAT | p.Val623AspfsTer6 | p.V623Dfs*6 | Q96SB8 | protein_coding | | | TCGA-AQ-A04H-01 | Breast | breast invasive carcinoma | Female | <65 | III/IV | Chemotherapy | taxotere | SD |
| SMC6 | SNV | Missense_Mutation | novel | c.2837A>G | p.Asp946Gly | p.D946G | Q96SB8 | protein_coding | deleterious(0.02) | benign(0.092) | TCGA-2W-A8YY-01 | Cervix | cervical & endocervical cancer | Female | <65 | I/II | Chemotherapy | cisplatin | CR |
| SMC6 | SNV | Missense_Mutation | novel | c.2482A>G | p.Thr828Ala | p.T828A | Q96SB8 | protein_coding | tolerated(0.45) | benign(0.05) | TCGA-2W-A8YY-01 | Cervix | cervical & endocervical cancer | Female | <65 | I/II | Chemotherapy | cisplatin | CR |


