
|
|||||
|
 | |
| |
| |
| |
| |
| |
|
Gene: SERPINE2 |
Gene summary for SERPINE2 |
| Gene information | Species | Human | Gene symbol | SERPINE2 | Gene ID | 5270 |
| Gene name | serpin family E member 2 | |
| Gene Alias | GDN | |
| Cytomap | 2q36.1 | |
| Gene Type | protein-coding | GO ID | GO:0000003 | UniProtAcc | A0A024R498 |
Top |
Malignant transformation analysis |
| Identification of the aberrant gene expression in precancerous and cancerous lesions by comparing the gene expression of stem-like cells in diseased tissues with normal stem cells |
| Entrez ID | Symbol | Replicates | Species | Organ | Tissue | Adj P-value | Log2FC | Malignancy |
| 5270 | SERPINE2 | HTA11_2487_2000001011 | Human | Colorectum | SER | 2.89e-04 | 2.94e-01 | -0.1808 |
| 5270 | SERPINE2 | HTA11_1938_2000001011 | Human | Colorectum | AD | 8.58e-13 | 5.40e-01 | -0.0811 |
| 5270 | SERPINE2 | HTA11_78_2000001011 | Human | Colorectum | AD | 2.48e-07 | 2.07e-01 | -0.1088 |
| 5270 | SERPINE2 | HTA11_411_2000001011 | Human | Colorectum | SER | 5.61e-03 | 4.67e-01 | -0.2602 |
| 5270 | SERPINE2 | HTA11_1391_2000001011 | Human | Colorectum | AD | 1.37e-03 | 1.25e-01 | -0.059 |
| 5270 | SERPINE2 | HTA11_6818_2000001021 | Human | Colorectum | AD | 6.03e-04 | 1.89e-01 | 0.0588 |
| 5270 | SERPINE2 | HTA11_99999971662_82457 | Human | Colorectum | MSS | 6.22e-30 | 6.29e-01 | 0.3859 |
| 5270 | SERPINE2 | A001-C-207 | Human | Colorectum | FAP | 1.02e-05 | 3.09e-01 | 0.1278 |
| 5270 | SERPINE2 | CRC-1-8810 | Human | Colorectum | CRC | 5.82e-06 | 3.06e-01 | 0.6257 |
| 5270 | SERPINE2 | LZE2T | Human | Esophagus | ESCC | 1.68e-10 | 5.29e-01 | 0.082 |
| 5270 | SERPINE2 | LZE5T | Human | Esophagus | ESCC | 4.70e-02 | -8.23e-01 | 0.0514 |
| 5270 | SERPINE2 | LZE7T | Human | Esophagus | ESCC | 2.04e-09 | -8.85e-01 | 0.0667 |
| 5270 | SERPINE2 | LZE8T | Human | Esophagus | ESCC | 1.44e-12 | -7.96e-01 | 0.067 |
| 5270 | SERPINE2 | LZE20T | Human | Esophagus | ESCC | 5.23e-07 | -7.25e-01 | 0.0662 |
| 5270 | SERPINE2 | LZE22D1 | Human | Esophagus | HGIN | 3.80e-07 | -9.64e-01 | 0.0595 |
| 5270 | SERPINE2 | LZE22T | Human | Esophagus | ESCC | 4.33e-07 | -6.50e-01 | 0.068 |
| 5270 | SERPINE2 | LZE24T | Human | Esophagus | ESCC | 2.07e-02 | -5.24e-01 | 0.0596 |
| 5270 | SERPINE2 | LZE22D3 | Human | Esophagus | HGIN | 3.26e-05 | 9.35e-01 | 0.0653 |
| 5270 | SERPINE2 | P1T-E | Human | Esophagus | ESCC | 4.83e-07 | -9.64e-01 | 0.0875 |
| 5270 | SERPINE2 | P10T-E | Human | Esophagus | ESCC | 2.02e-03 | -2.30e-01 | 0.116 |
| Page: 1 2 3 4 5 6 |
| Tissue | Expression Dynamics | Abbreviation |
| Colorectum (GSE201348) |  | FAP: Familial adenomatous polyposis |
| CRC: Colorectal cancer | ||
| Colorectum (HTA11) |  | AD: Adenomas |
| SER: Sessile serrated lesions | ||
| MSI-H: Microsatellite-high colorectal cancer | ||
| MSS: Microsatellite stable colorectal cancer | ||
| Esophagus | 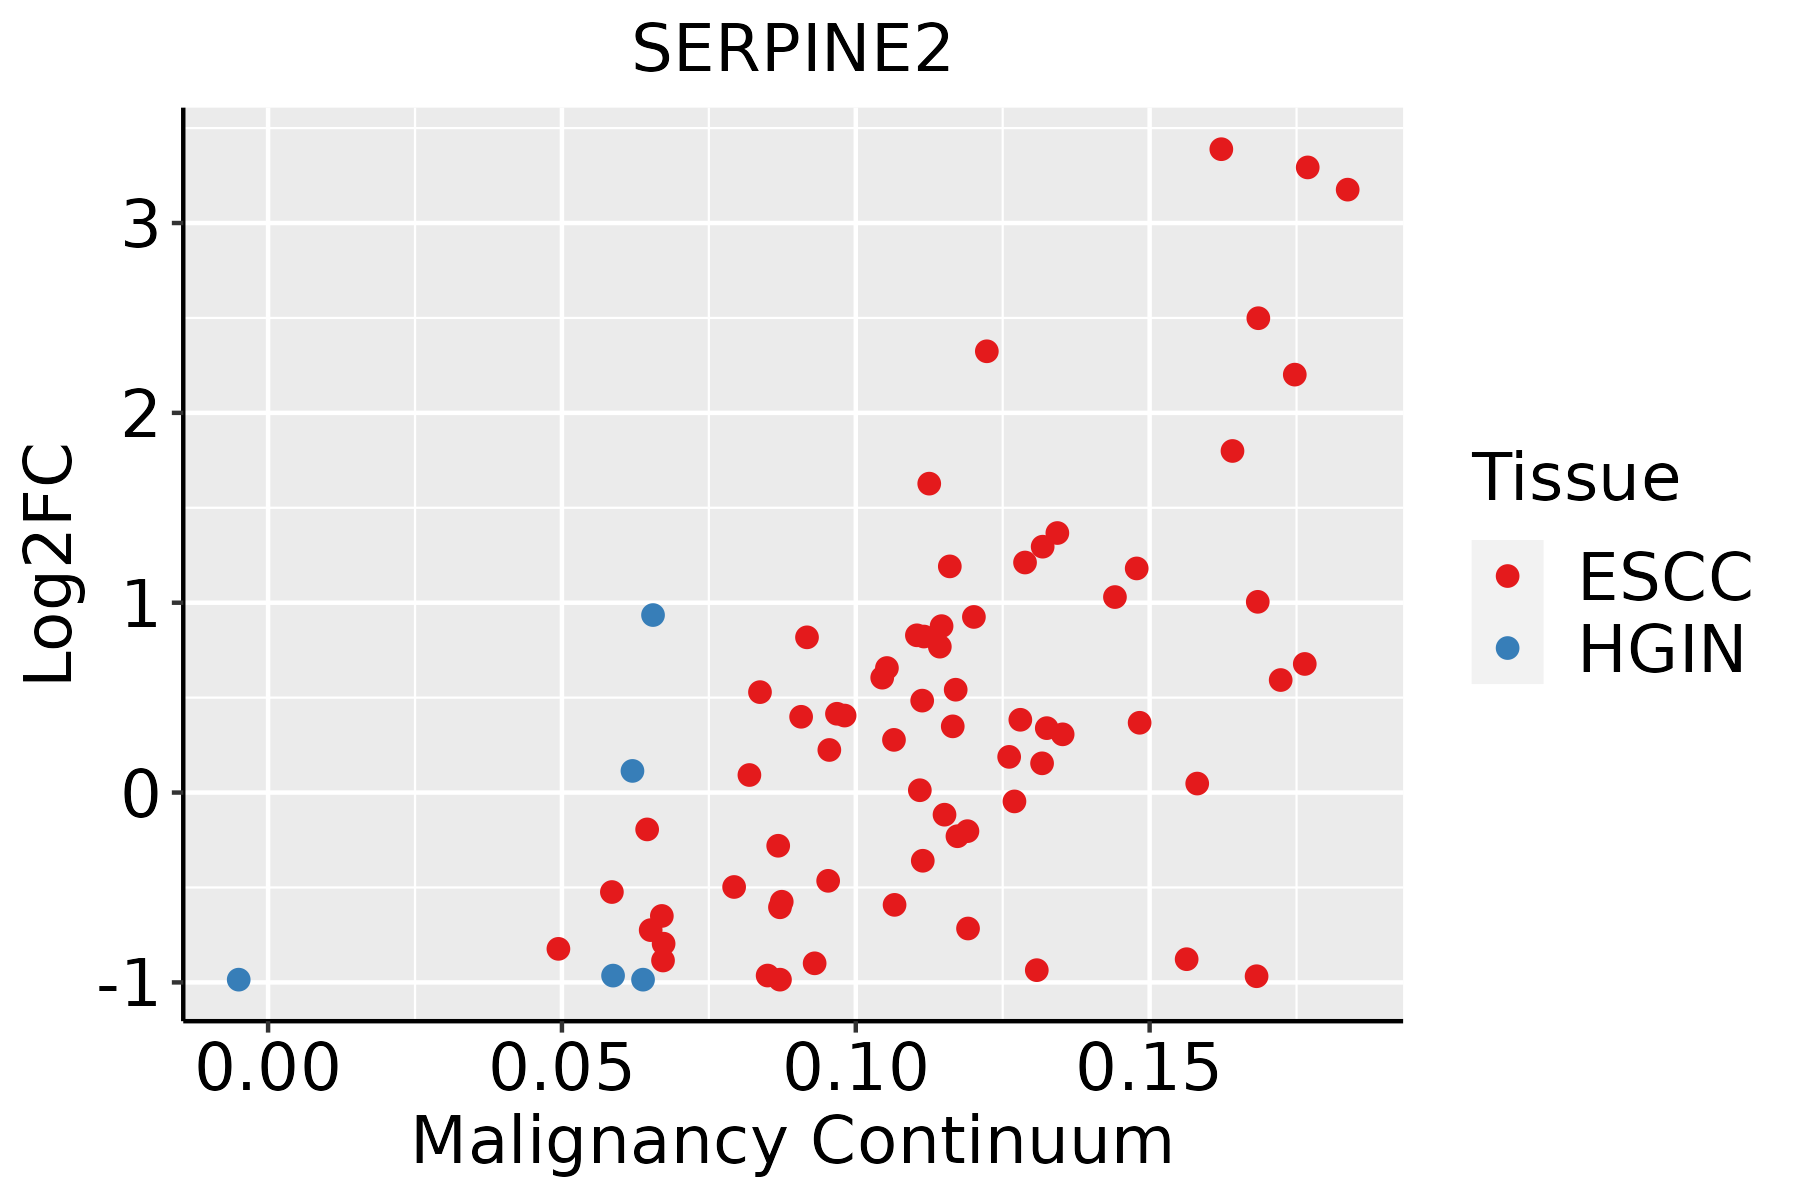 | ESCC: Esophageal squamous cell carcinoma |
| HGIN: High-grade intraepithelial neoplasias | ||
| LGIN: Low-grade intraepithelial neoplasias | ||
| Liver | 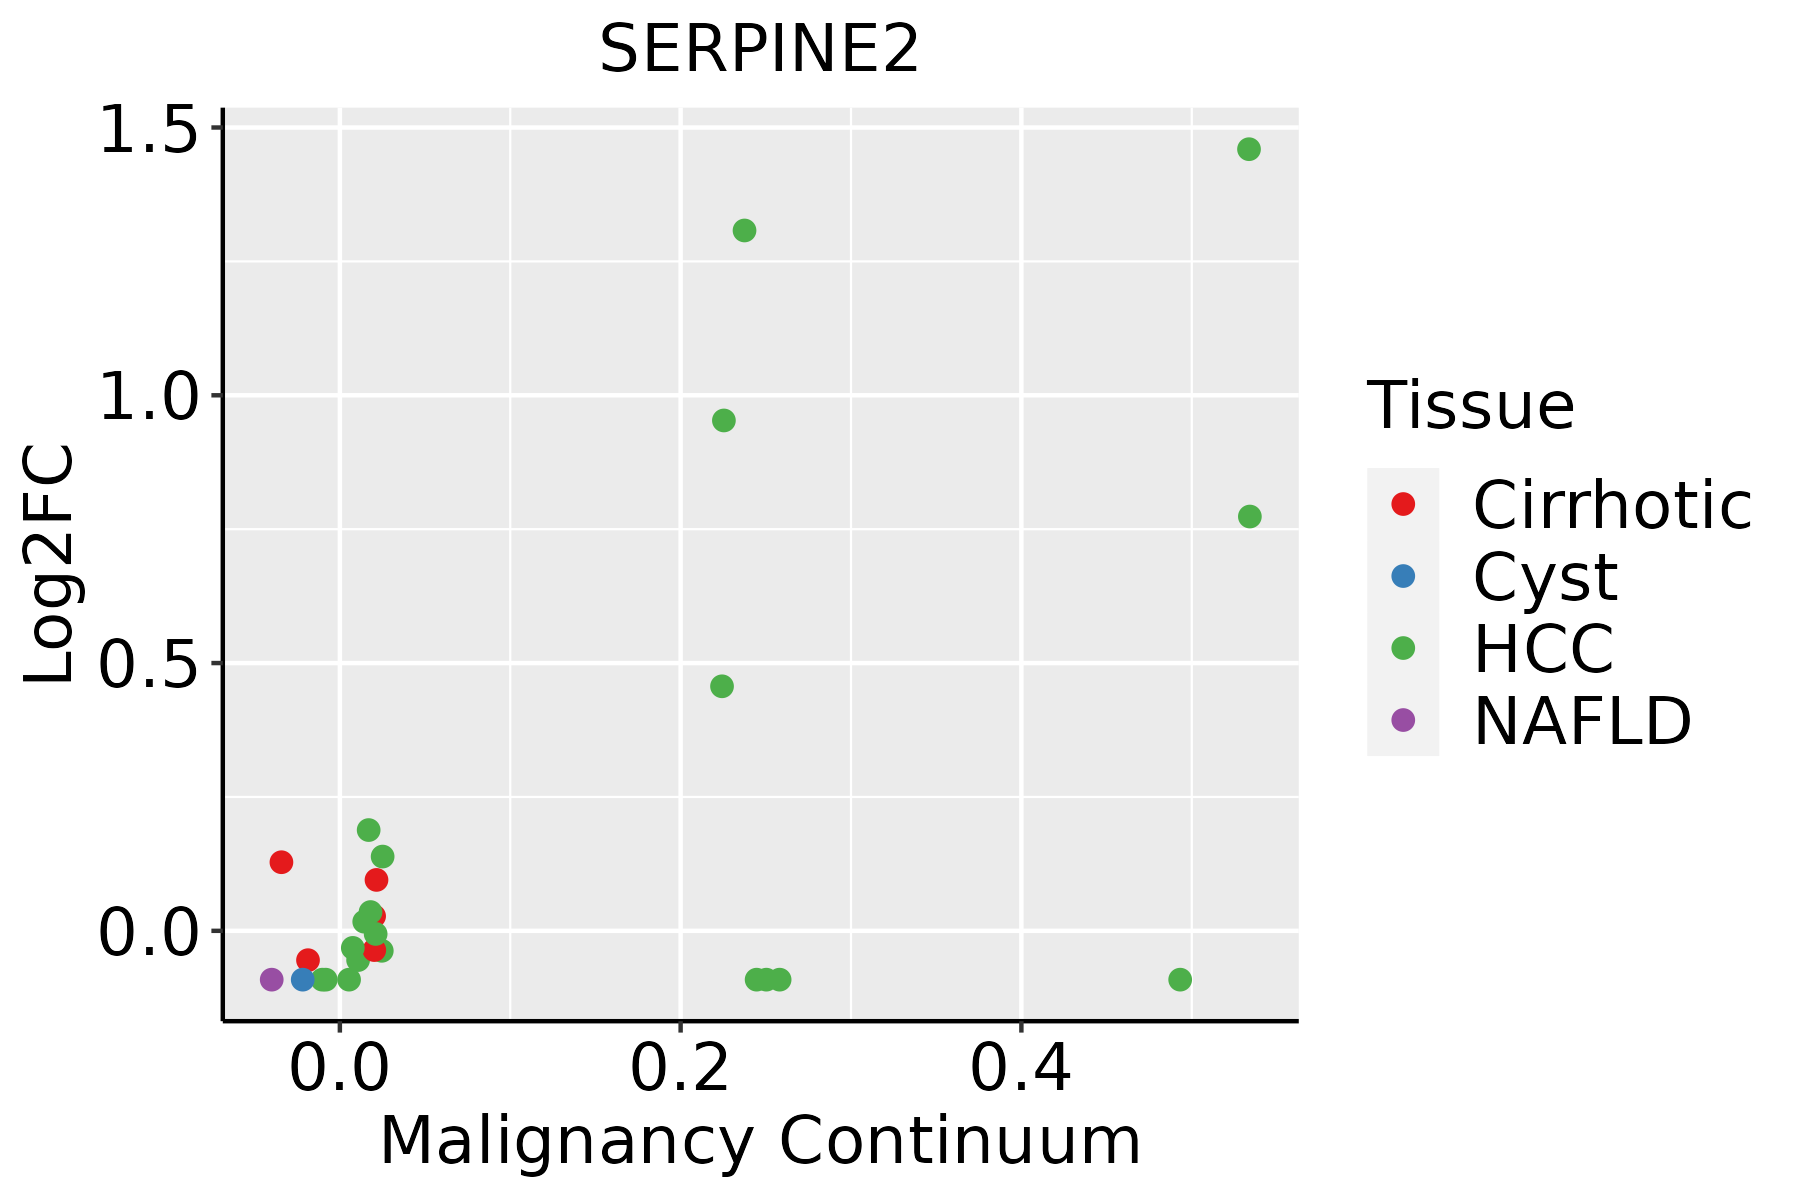 | HCC: Hepatocellular carcinoma |
| NAFLD: Non-alcoholic fatty liver disease | ||
| Oral Cavity |  | EOLP: Erosive Oral lichen planus |
| LP: leukoplakia | ||
| NEOLP: Non-erosive oral lichen planus | ||
| OSCC: Oral squamous cell carcinoma | ||
| Prostate | 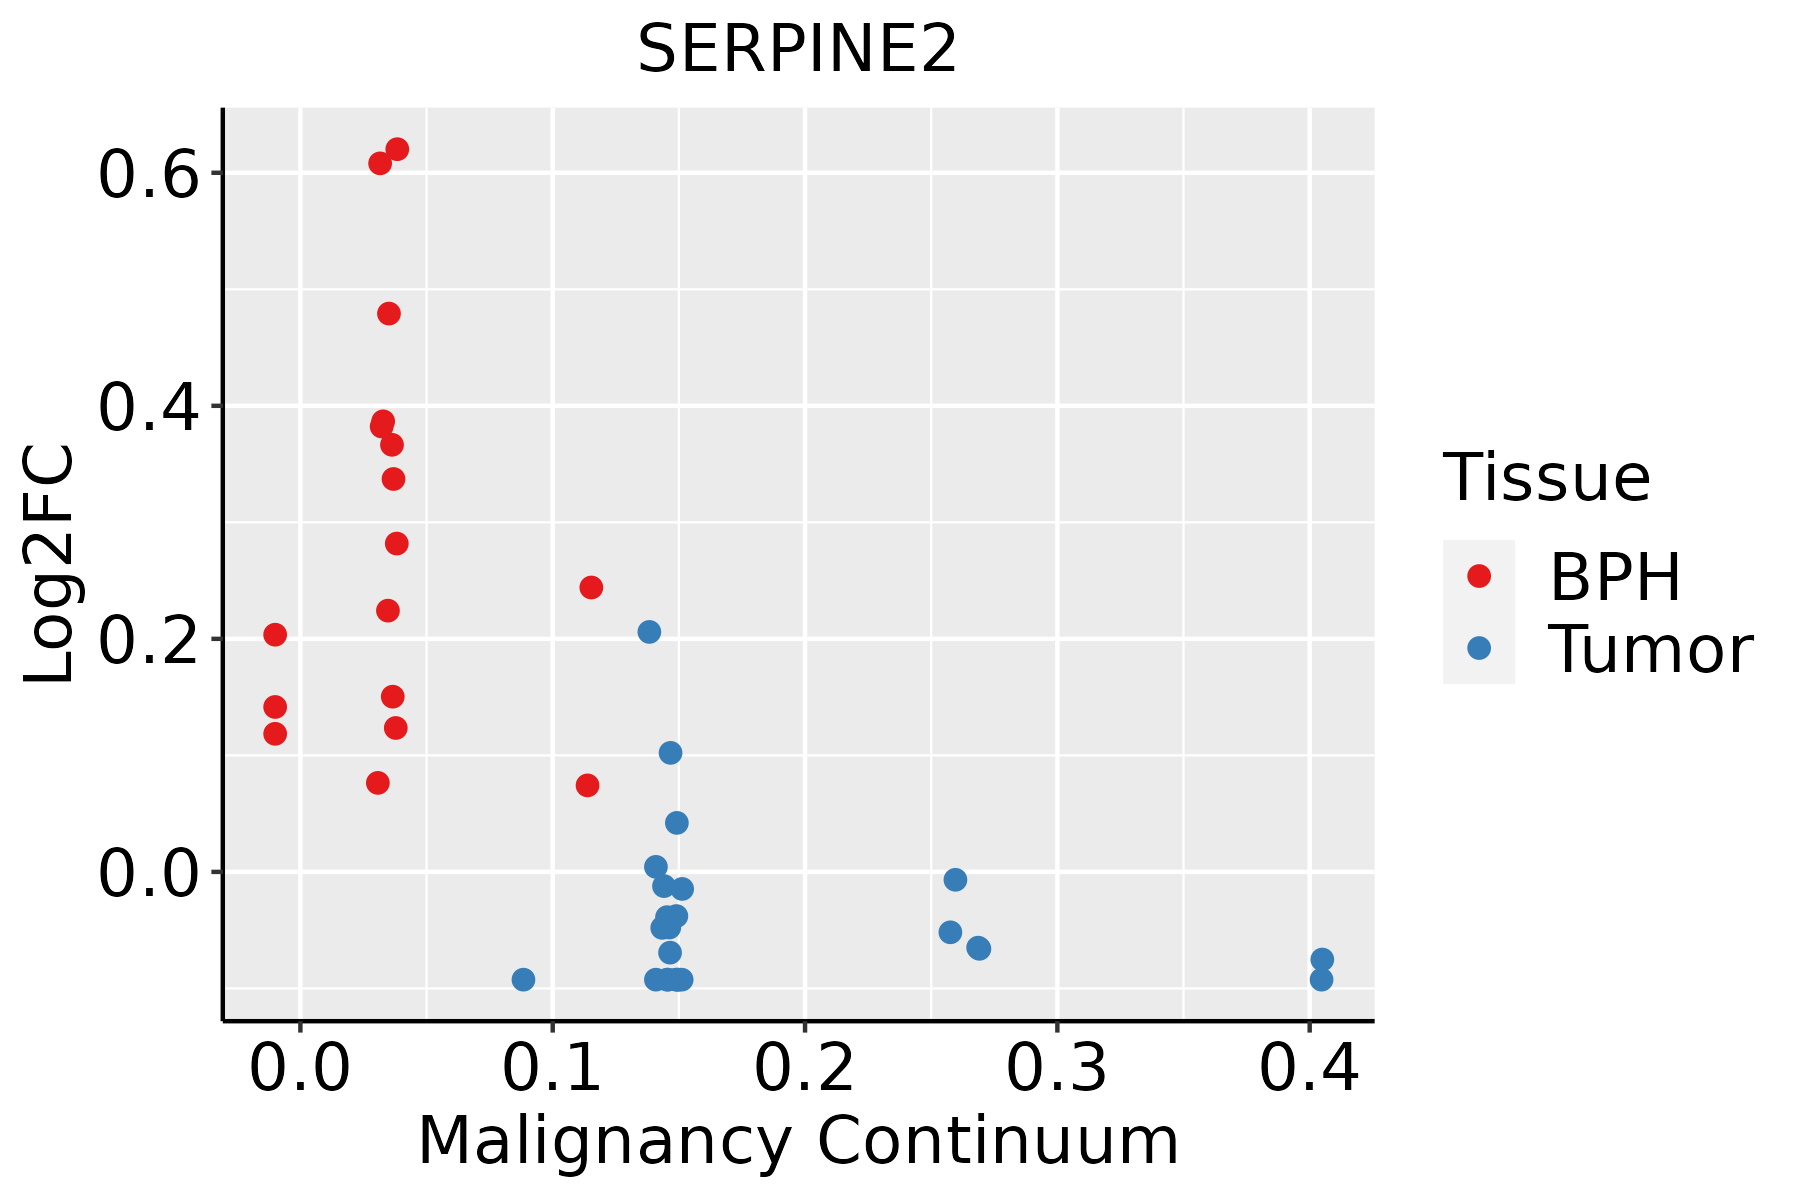 | BPH: Benign Prostatic Hyperplasia |
| Skin | 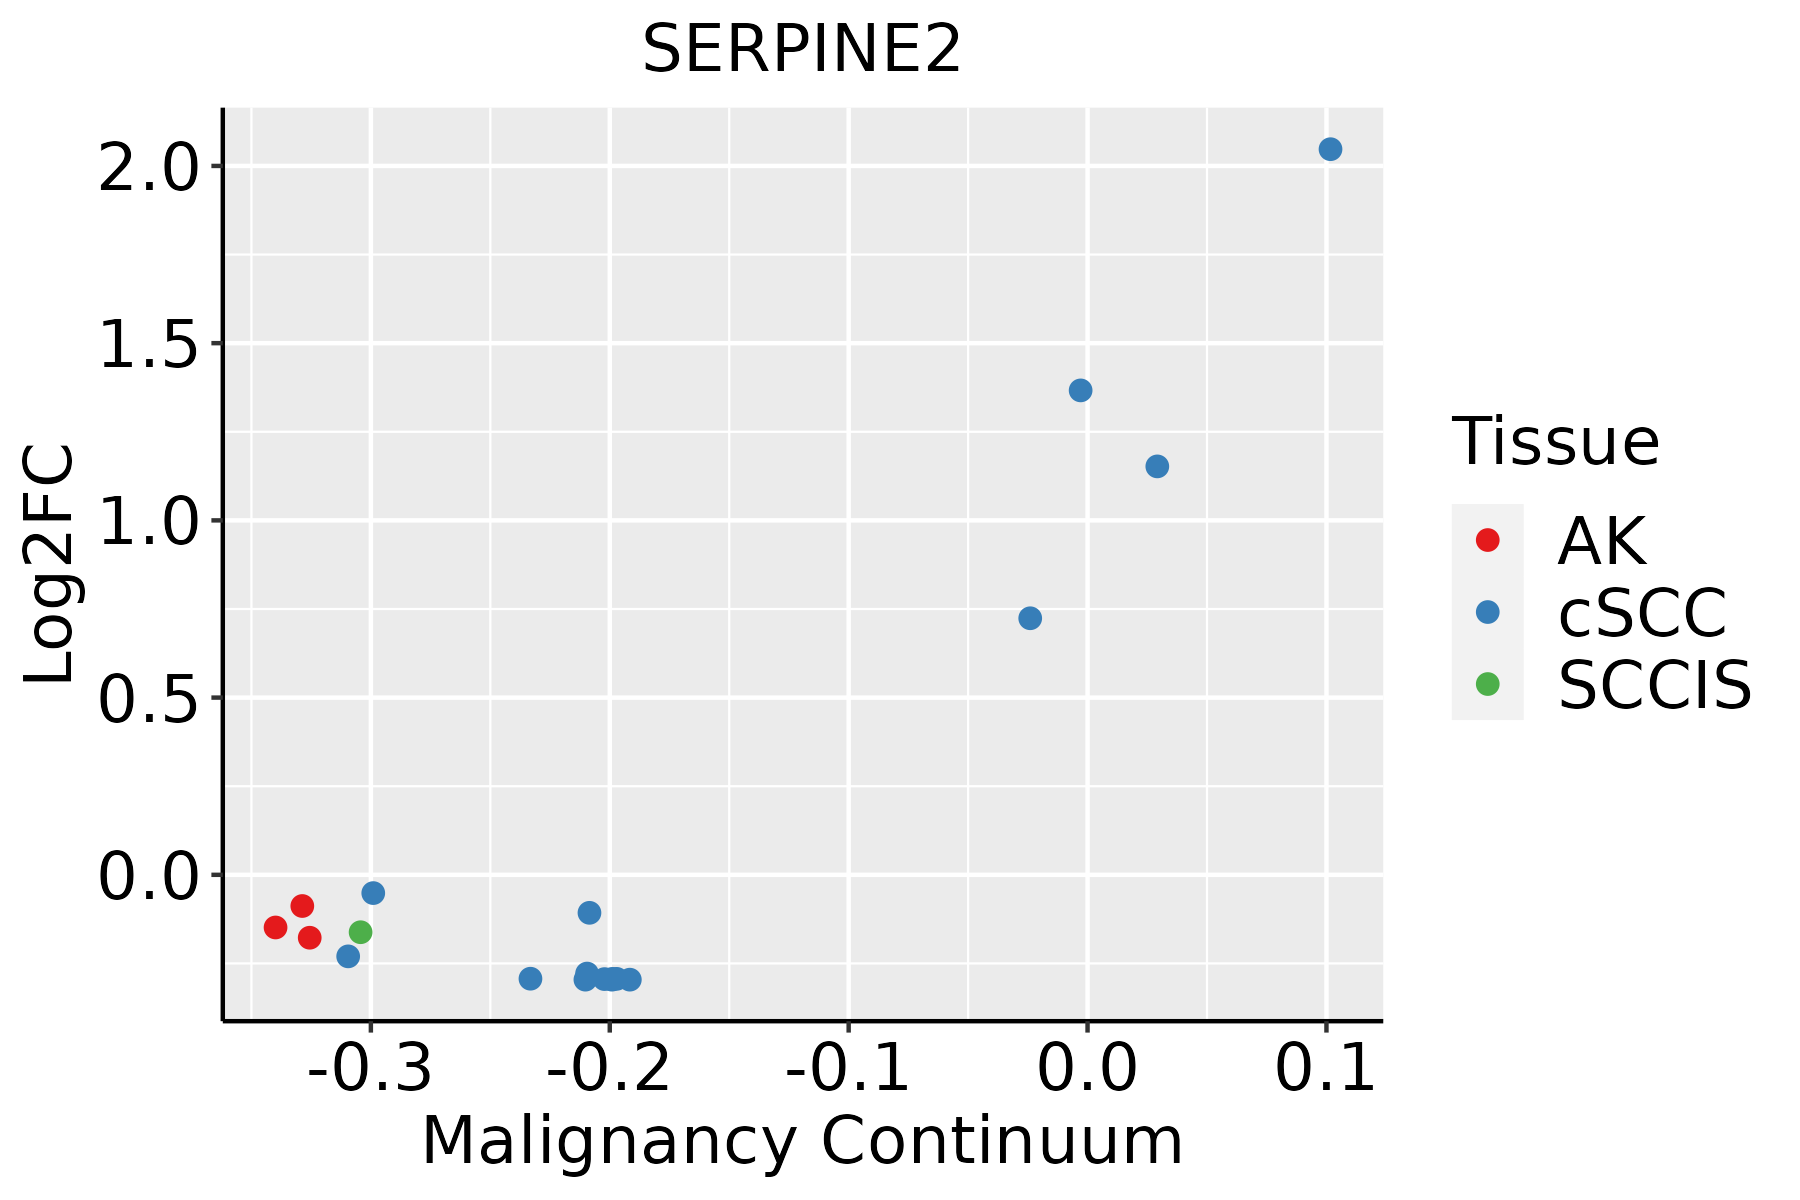 | AK: Actinic keratosis |
| cSCC: Cutaneous squamous cell carcinoma | ||
| SCCIS:squamous cell carcinoma in situ | ||
| Thyroid | 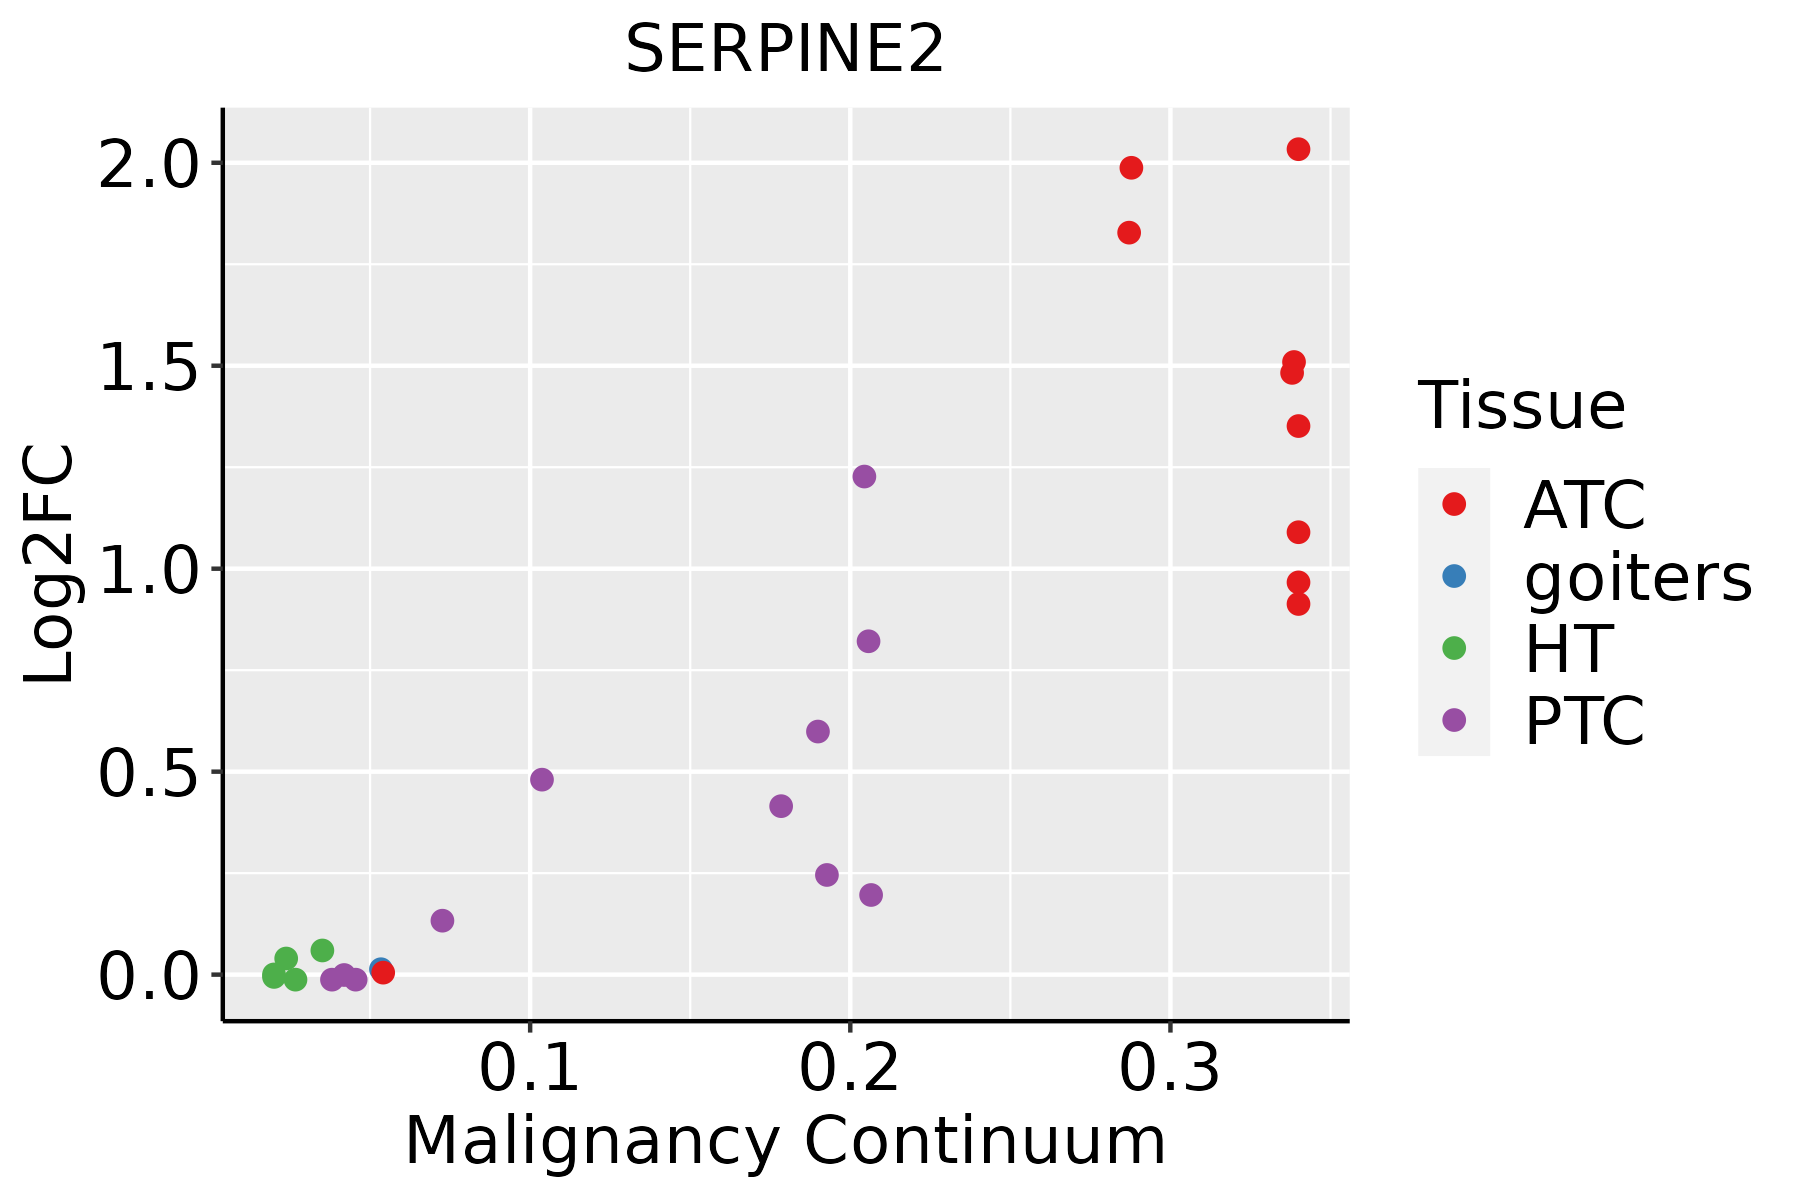 | ATC: Anaplastic thyroid cancer |
| HT: Hashimoto's thyroiditis | ||
| PTC: Papillary thyroid cancer |
| ∗log2FC in expression of this searched gene in stem-like cells from each diseased tissue sample relative to stem-like cells in normal samples in each tissue plotted against the malignancy continuum. Samples are colored based on if they are from different disease stage. |
Top |
Malignant transformation related pathway analysis |
| Find out the enriched GO biological processes and KEGG pathways involved in transition from healthy to precancer to cancer |
| Tissue | Disease Stage | Enriched GO biological Processes |
| Colorectum | AD |  |
| Colorectum | SER |  |
| Colorectum | MSS |  |
| Colorectum | MSI-H |  |
| Colorectum | FAP |  |
| ∗Top 15 enriched GO BP terms are showed in the bar plot of each disease state in each tissue. Each row represents a significant GO biological process which is colored according to the -log10(p.adjust). |
| Page: 1 2 3 4 5 6 7 8 9 |
| GO ID | Tissue | Disease Stage | Description | Gene Ratio | Bg Ratio | pvalue | p.adjust | Count |
| GO:0048732111 | Esophagus | ESCC | gland development | 269/8552 | 436/18723 | 7.81e-12 | 2.95e-10 | 269 |
| GO:005160418 | Esophagus | ESCC | protein maturation | 189/8552 | 294/18723 | 7.64e-11 | 2.39e-09 | 189 |
| GO:0016049110 | Esophagus | ESCC | cell growth | 289/8552 | 482/18723 | 1.29e-10 | 3.77e-09 | 289 |
| GO:0009895111 | Esophagus | ESCC | negative regulation of catabolic process | 201/8552 | 320/18723 | 3.88e-10 | 1.05e-08 | 201 |
| GO:0052547111 | Esophagus | ESCC | regulation of peptidase activity | 275/8552 | 461/18723 | 7.54e-10 | 1.88e-08 | 275 |
| GO:000155819 | Esophagus | ESCC | regulation of cell growth | 248/8552 | 414/18723 | 2.97e-09 | 6.45e-08 | 248 |
| GO:0052548111 | Esophagus | ESCC | regulation of endopeptidase activity | 253/8552 | 432/18723 | 3.68e-08 | 6.78e-07 | 253 |
| GO:0042177111 | Esophagus | ESCC | negative regulation of protein catabolic process | 84/8552 | 121/18723 | 1.03e-07 | 1.69e-06 | 84 |
| GO:0061458110 | Esophagus | ESCC | reproductive system development | 247/8552 | 427/18723 | 2.24e-07 | 3.42e-06 | 247 |
| GO:004860818 | Esophagus | ESCC | reproductive structure development | 245/8552 | 424/18723 | 2.82e-07 | 4.14e-06 | 245 |
| GO:004206027 | Esophagus | ESCC | wound healing | 243/8552 | 422/18723 | 4.62e-07 | 6.25e-06 | 243 |
| GO:00459267 | Esophagus | ESCC | negative regulation of growth | 148/8552 | 249/18723 | 7.88e-06 | 7.73e-05 | 148 |
| GO:001072010 | Esophagus | ESCC | positive regulation of cell development | 172/8552 | 298/18723 | 1.74e-05 | 1.55e-04 | 172 |
| GO:001648514 | Esophagus | ESCC | protein processing | 134/8552 | 225/18723 | 1.81e-05 | 1.60e-04 | 134 |
| GO:00420636 | Esophagus | ESCC | gliogenesis | 172/8552 | 301/18723 | 3.75e-05 | 3.04e-04 | 172 |
| GO:005076710 | Esophagus | ESCC | regulation of neurogenesis | 203/8552 | 364/18723 | 6.10e-05 | 4.68e-04 | 203 |
| GO:00507697 | Esophagus | ESCC | positive regulation of neurogenesis | 131/8552 | 225/18723 | 9.71e-05 | 6.90e-04 | 131 |
| GO:0045861111 | Esophagus | ESCC | negative regulation of proteolysis | 195/8552 | 351/18723 | 1.13e-04 | 7.85e-04 | 195 |
| GO:0051346110 | Esophagus | ESCC | negative regulation of hydrolase activity | 208/8552 | 379/18723 | 1.76e-04 | 1.14e-03 | 208 |
| GO:00100016 | Esophagus | ESCC | glial cell differentiation | 129/8552 | 225/18723 | 2.73e-04 | 1.65e-03 | 129 |
| Page: 1 2 3 4 5 6 7 8 9 10 11 12 13 14 15 16 17 18 19 20 21 22 23 24 25 26 27 28 |
| Pathway ID | Tissue | Disease Stage | Description | Gene Ratio | Bg Ratio | pvalue | p.adjust | qvalue | Count |
| hsa046104 | Liver | HCC | Complement and coagulation cascades | 57/4020 | 86/8465 | 3.19e-04 | 1.45e-03 | 8.04e-04 | 57 |
| hsa046105 | Liver | HCC | Complement and coagulation cascades | 57/4020 | 86/8465 | 3.19e-04 | 1.45e-03 | 8.04e-04 | 57 |
| Page: 1 |
Top |
Cell-cell communication analysis |
| Identification of potential cell-cell interactions between two cell types and their ligand-receptor pairs for different disease states |
| Ligand | Receptor | LRpair | Pathway | Tissue | Disease Stage |
| Page: 1 |
Top |
Single-cell gene regulatory network inference analysis |
| Find out the significant the regulons (TFs) and the target genes of each regulon across cell types for different disease states |
| TF | Cell Type | Tissue | Disease Stage | Target Gene | RSS | Regulon Activity |
| ∗The dot plots of a searched regulon are shown for all cell subpopulations in each disease state of each tissue based on the regulon specific score inferred using pySCENIC and by calculating the average expression. |
| Page: 1 |
Top |
Somatic mutation of malignant transformation related genes |
| Annotation of somatic variants for genes involved in malignant transformation |
| Hugo Symbol | Variant Class | Variant Classification | dbSNP RS | HGVSc | HGVSp | HGVSp Short | SWISSPROT | BIOTYPE | SIFT | PolyPhen | Tumor Sample Barcode | Tissue | Histology | Sex | Age | Stage | Therapy Types | Drugs | Outcome |
| SERPINE2 | SNV | Missense_Mutation | c.1017N>G | p.Ile339Met | p.I339M | P07093 | protein_coding | tolerated(0.06) | probably_damaging(0.978) | TCGA-E2-A1LS-01 | Breast | breast invasive carcinoma | Female | <65 | I/II | Unspecific | Cyclophosphamide | SD | |
| SERPINE2 | SNV | Missense_Mutation | c.279G>A | p.Met93Ile | p.M93I | P07093 | protein_coding | deleterious(0.01) | possibly_damaging(0.718) | TCGA-FU-A23K-01 | Cervix | cervical & endocervical cancer | Female | <65 | III/IV | Unknown | Unknown | SD | |
| SERPINE2 | SNV | Missense_Mutation | c.967C>A | p.Leu323Ile | p.L323I | P07093 | protein_coding | deleterious(0.01) | probably_damaging(0.999) | TCGA-AA-3510-01 | Colorectum | colon adenocarcinoma | Male | >=65 | I/II | Unknown | Unknown | SD | |
| SERPINE2 | SNV | Missense_Mutation | c.802N>A | p.Ala268Thr | p.A268T | P07093 | protein_coding | deleterious(0) | possibly_damaging(0.886) | TCGA-AA-3811-01 | Colorectum | colon adenocarcinoma | Female | >=65 | III/IV | Unknown | Unknown | PD | |
| SERPINE2 | SNV | Missense_Mutation | novel | c.554T>G | p.Leu185Arg | p.L185R | P07093 | protein_coding | tolerated(0.35) | possibly_damaging(0.702) | TCGA-AA-3984-01 | Colorectum | colon adenocarcinoma | Female | <65 | I/II | Unknown | Unknown | SD |
| SERPINE2 | SNV | Missense_Mutation | c.833N>T | p.Ser278Phe | p.S278F | P07093 | protein_coding | deleterious(0) | probably_damaging(0.997) | TCGA-AY-6197-01 | Colorectum | colon adenocarcinoma | Male | <65 | I/II | Unknown | Unknown | SD | |
| SERPINE2 | SNV | Missense_Mutation | rs137914245 | c.452N>A | p.Arg151Gln | p.R151Q | P07093 | protein_coding | tolerated(0.16) | benign(0.085) | TCGA-AZ-4313-01 | Colorectum | colon adenocarcinoma | Female | <65 | I/II | Unknown | Unknown | SD |
| SERPINE2 | SNV | Missense_Mutation | rs757503754 | c.1178N>A | p.Arg393Gln | p.R393Q | P07093 | protein_coding | deleterious(0.05) | probably_damaging(0.953) | TCGA-G4-6323-01 | Colorectum | colon adenocarcinoma | Male | <65 | I/II | Unknown | Unknown | SD |
| SERPINE2 | SNV | Missense_Mutation | rs757503754 | c.1178N>A | p.Arg393Gln | p.R393Q | P07093 | protein_coding | deleterious(0.05) | probably_damaging(0.953) | TCGA-F5-6814-01 | Colorectum | rectum adenocarcinoma | Male | <65 | I/II | Unknown | Unknown | SD |
| SERPINE2 | SNV | Missense_Mutation | novel | c.759N>A | p.Phe253Leu | p.F253L | P07093 | protein_coding | tolerated(0.05) | benign(0.156) | TCGA-F5-6814-01 | Colorectum | rectum adenocarcinoma | Male | <65 | I/II | Unknown | Unknown | SD |
| Page: 1 2 3 4 5 6 |
Top |
Related drugs of malignant transformation related genes |
| Identification of chemicals and drugs interact with genes involved in malignant transfromation |
| (DGIdb 4.0) |
| Entrez ID | Symbol | Category | Interaction Types | Drug Claim Name | Drug Name | PMIDs |
| Page: 1 |

Copyright 2023-Present -The University of Texas Health Science Center at Houston |