Schematic overview of the cellular and molecular mechanisms involved in the cancer progression, including the proposed cellular and molecular mechanisms in cancer cells trajectory. AT1: alveolar type 1 cells; AT2: alveolar type 2 cells; AAH: atypical adenomatous hyperplasia; AIS: adenocarcinoma in situ; MIA: minimally invasive adenocarcinoma; IA: invasive adenocarcinoma; EMT: epithelial-mesenchymal transition

Home

Download

Statistics

Help

Contact

Center for Computational Systems Medicine
leaf

Gene summary

leaf

Malignant transformation analysis

leaf

Malignant transformation related pathway analysis

leaf

Cell-cell communication analysis

leaf

Single-cell gene regulatory network inference analysis

leaf

Somatic mutation of malignant transformation related genes

leaf

Related drugs of malignant transformation related genes

Gene: SCAF11

Gene summary for SCAF11

check button Gene summary.

Gene informationSpeciesHuman
Gene symbol

SCAF11

Gene ID

9169

Gene nameSR-related CTD associated factor 11
Gene AliasCASP11
Cytomap12q12
Gene Typeprotein-coding
GO ID

GO:0000245

UniProtAcc

Q99590


Top

Malignant transformation analysis

check button Identification of the aberrant gene expression in precancerous and cancerous lesions by comparing the gene expression of stem-like cells in diseased tissues with normal stem cells
check button Malignant transformation involving gene list.
Entrez IDSymbolReplicatesSpeciesOrganTissueAdj P-valueLog2FCMalignancy
9169SCAF11HTA11_3410_2000001011HumanColorectumAD2.53e-09-4.08e-010.0155
9169SCAF11HTA11_347_2000001011HumanColorectumAD1.97e-196.80e-01-0.1954
9169SCAF11HTA11_99999965062_69753HumanColorectumMSI-H2.05e-071.10e+000.3487
9169SCAF11HTA11_99999965104_69814HumanColorectumMSS1.97e-076.41e-010.281
9169SCAF11HTA11_99999974143_84620HumanColorectumMSS2.26e-08-3.92e-010.3005
9169SCAF11A015-C-203HumanColorectumFAP4.10e-32-1.74e-01-0.1294
9169SCAF11A015-C-204HumanColorectumFAP3.12e-04-1.56e-02-0.0228
9169SCAF11A014-C-040HumanColorectumFAP3.58e-04-7.83e-02-0.1184
9169SCAF11A002-C-201HumanColorectumFAP7.88e-11-2.01e-010.0324
9169SCAF11A001-C-119HumanColorectumFAP4.60e-061.16e-01-0.1557
9169SCAF11A001-C-108HumanColorectumFAP2.20e-127.20e-02-0.0272
9169SCAF11A002-C-205HumanColorectumFAP2.66e-21-8.51e-02-0.1236
9169SCAF11A001-C-104HumanColorectumFAP1.36e-031.95e-020.0184
9169SCAF11A015-C-006HumanColorectumFAP7.63e-158.63e-03-0.0994
9169SCAF11A015-C-106HumanColorectumFAP4.37e-07-2.55e-02-0.0511
9169SCAF11A002-C-114HumanColorectumFAP4.16e-17-7.34e-02-0.1561
9169SCAF11A015-C-104HumanColorectumFAP7.11e-33-7.00e-02-0.1899
9169SCAF11A001-C-014HumanColorectumFAP2.30e-13-9.82e-030.0135
9169SCAF11A002-C-016HumanColorectumFAP1.07e-22-8.09e-020.0521
9169SCAF11A015-C-002HumanColorectumFAP1.33e-112.80e-02-0.0763
Page: 1 2 3 4 5 6 7 8 9 10 11 12 

check button Transcriptomic changes along malignancy continuum.
TissueExpression DynamicsAbbreviation
Colorectum (GSE201348)The image shows the transcriptomic changes along malignancy continuum.log2FC in expression of this searched gene in stem-like cells from each diseased tissue sample relative to stem-like cells in normal samples in each tissue plotted against the malignancy continuum. Samples are colored based on if they are from different disease stage.FAP: Familial adenomatous polyposis
CRC: Colorectal cancer
Colorectum (HTA11)The image shows the transcriptomic changes along malignancy continuum.log2FC in expression of this searched gene in stem-like cells from each diseased tissue sample relative to stem-like cells in normal samples in each tissue plotted against the malignancy continuum. Samples are colored based on if they are from different disease stage.AD: Adenomas
SER: Sessile serrated lesions
MSI-H: Microsatellite-high colorectal cancer
MSS: Microsatellite stable colorectal cancer
EndometriumThe image shows the transcriptomic changes along malignancy continuum.log2FC in expression of this searched gene in stem-like cells from each diseased tissue sample relative to stem-like cells in normal samples in each tissue plotted against the malignancy continuum. Samples are colored based on if they are from different disease stage.AEH: Atypical endometrial hyperplasia
EEC: Endometrioid Cancer
EsophagusThe image shows the transcriptomic changes along malignancy continuum.log2FC in expression of this searched gene in stem-like cells from each diseased tissue sample relative to stem-like cells in normal samples in each tissue plotted against the malignancy continuum. Samples are colored based on if they are from different disease stage.
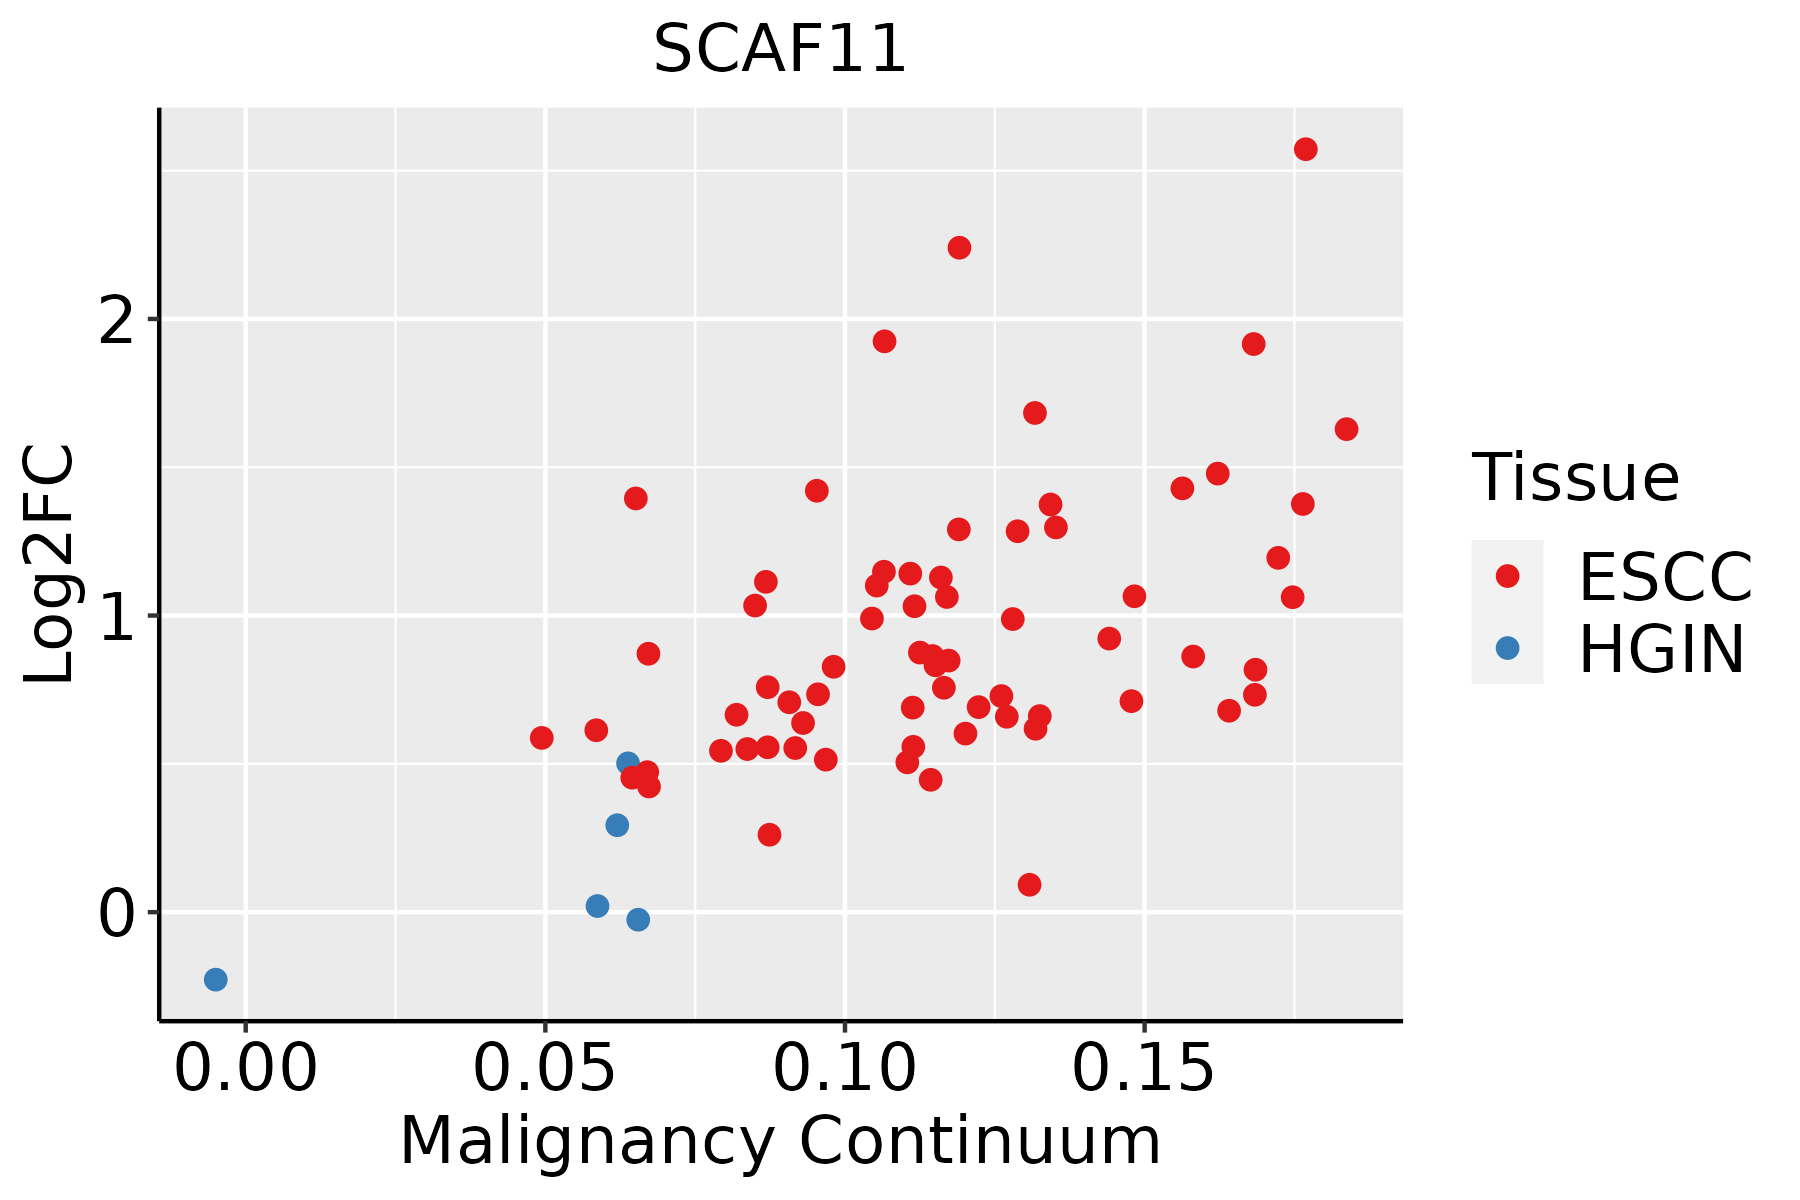
ESCC: Esophageal squamous cell carcinoma
HGIN: High-grade intraepithelial neoplasias
LGIN: Low-grade intraepithelial neoplasias
LiverThe image shows the transcriptomic changes along malignancy continuum.log2FC in expression of this searched gene in stem-like cells from each diseased tissue sample relative to stem-like cells in normal samples in each tissue plotted against the malignancy continuum. Samples are colored based on if they are from different disease stage.
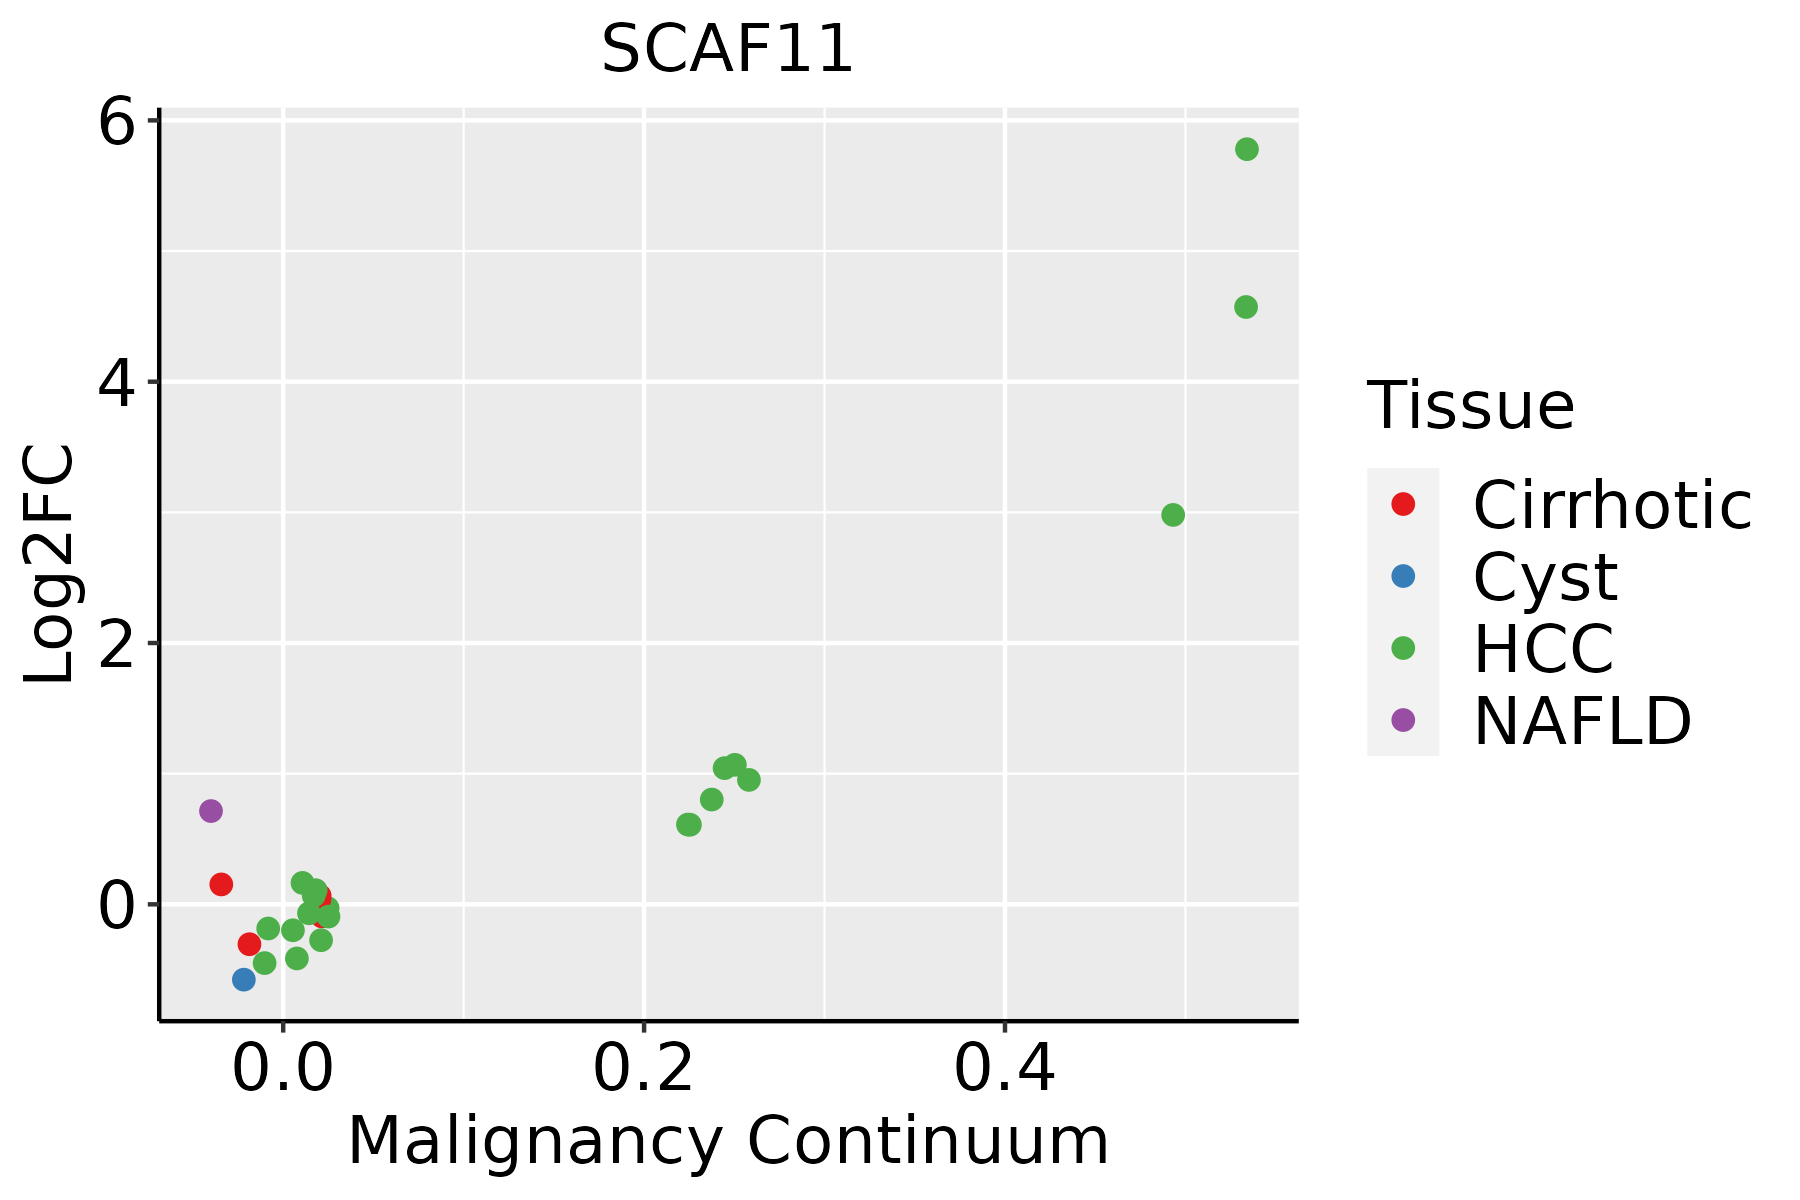
HCC: Hepatocellular carcinoma
NAFLD: Non-alcoholic fatty liver disease
LungThe image shows the transcriptomic changes along malignancy continuum.log2FC in expression of this searched gene in stem-like cells from each diseased tissue sample relative to stem-like cells in normal samples in each tissue plotted against the malignancy continuum. Samples are colored based on if they are from different disease stage.
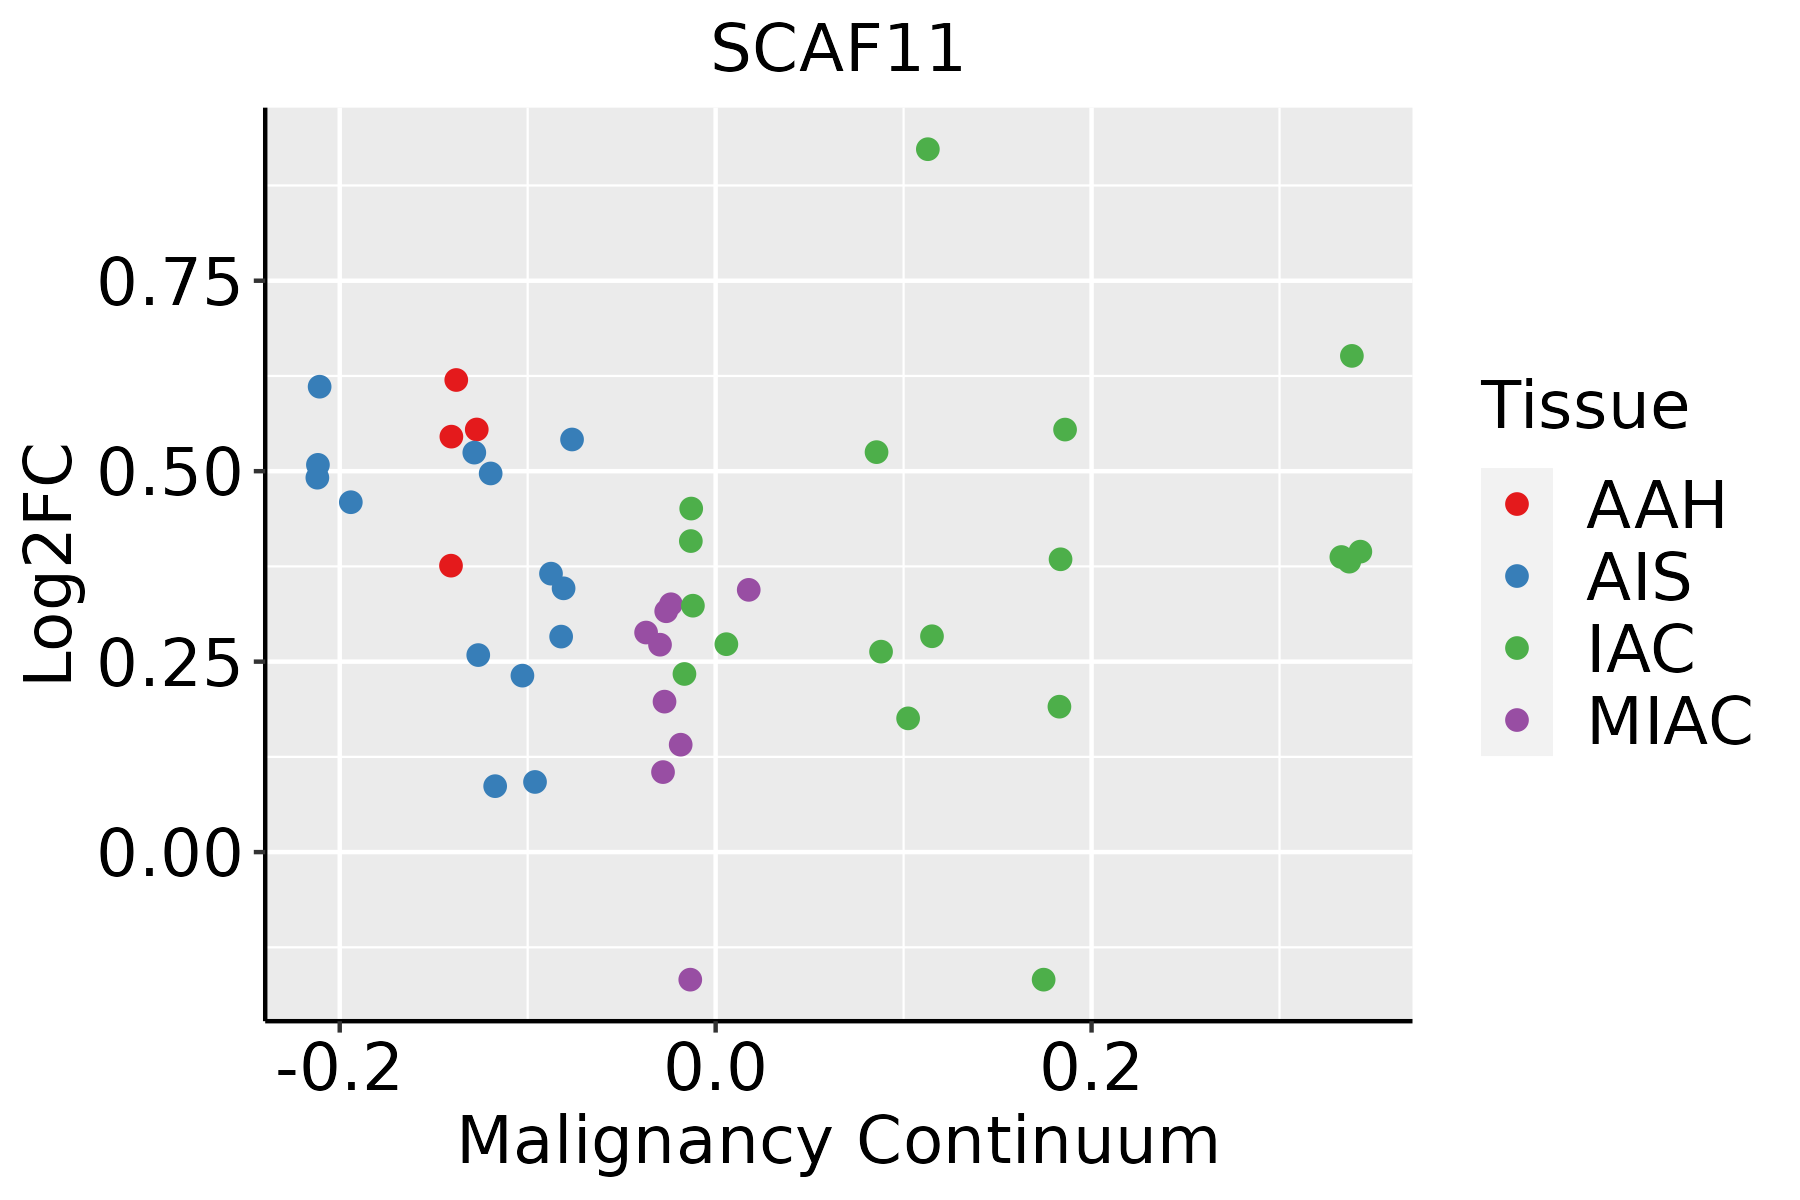
AAH: Atypical adenomatous hyperplasia
AIS: Adenocarcinoma in situ
IAC: Invasive lung adenocarcinoma
MIA: Minimally invasive adenocarcinoma
Oral CavityThe image shows the transcriptomic changes along malignancy continuum.log2FC in expression of this searched gene in stem-like cells from each diseased tissue sample relative to stem-like cells in normal samples in each tissue plotted against the malignancy continuum. Samples are colored based on if they are from different disease stage.EOLP: Erosive Oral lichen planus
LP: leukoplakia
NEOLP: Non-erosive oral lichen planus
OSCC: Oral squamous cell carcinoma
ProstateThe image shows the transcriptomic changes along malignancy continuum.log2FC in expression of this searched gene in stem-like cells from each diseased tissue sample relative to stem-like cells in normal samples in each tissue plotted against the malignancy continuum. Samples are colored based on if they are from different disease stage.BPH: Benign Prostatic Hyperplasia
SkinThe image shows the transcriptomic changes along malignancy continuum.log2FC in expression of this searched gene in stem-like cells from each diseased tissue sample relative to stem-like cells in normal samples in each tissue plotted against the malignancy continuum. Samples are colored based on if they are from different disease stage.AK: Actinic keratosis
cSCC: Cutaneous squamous cell carcinoma
SCCIS:squamous cell carcinoma in situ
ThyroidThe image shows the transcriptomic changes along malignancy continuum.log2FC in expression of this searched gene in stem-like cells from each diseased tissue sample relative to stem-like cells in normal samples in each tissue plotted against the malignancy continuum. Samples are colored based on if they are from different disease stage.ATC: Anaplastic thyroid cancer
HT: Hashimoto's thyroiditis
PTC: Papillary thyroid cancer
∗log2FC in expression of this searched gene in stem-like cells from each diseased tissue sample relative to stem-like cells in normal samples in each tissue plotted against the malignancy continuum. Samples are colored based on if they are from different disease stage.

Top

Malignant transformation related pathway analysis

check buttonFind out the enriched GO biological processes and KEGG pathways involved in transition from healthy to precancer to cancer
check button Figure of enriched GO biological processes.
TissueDisease StageEnriched GO biological Processes
ColorectumADGO analysis - Figure of enriched GO biological processes: Top 15 enriched GO BP terms are showed in the bar plot of each disease state in each tissue. Each row represents a significant GO biological process which is colored according to the -log10(p.adjust).
ColorectumSERGO analysis - Figure of enriched GO biological processes: Top 15 enriched GO BP terms are showed in the bar plot of each disease state in each tissue. Each row represents a significant GO biological process which is colored according to the -log10(p.adjust).
ColorectumMSSGO analysis - Figure of enriched GO biological processes: Top 15 enriched GO BP terms are showed in the bar plot of each disease state in each tissue. Each row represents a significant GO biological process which is colored according to the -log10(p.adjust).
ColorectumMSI-HGO analysis - Figure of enriched GO biological processes: Top 15 enriched GO BP terms are showed in the bar plot of each disease state in each tissue. Each row represents a significant GO biological process which is colored according to the -log10(p.adjust).
ColorectumFAPGO analysis - Figure of enriched GO biological processes: Top 15 enriched GO BP terms are showed in the bar plot of each disease state in each tissue. Each row represents a significant GO biological process which is colored according to the -log10(p.adjust).
∗Top 15 enriched GO BP terms are showed in the bar plot of each disease state in each tissue. Each row represents a significant GO biological process which is colored according to the -log10(p.adjust).
Page: 1 2 3 4 5 6 7 8 9 

check button Enriched GO biological processes.
GO IDTissueDisease StageDescriptionGene RatioBg Ratiopvaluep.adjustCount
GO:0008380112SkincSCCRNA splicing263/4864434/187232.45e-535.13e-50263
GO:0000375112SkincSCCRNA splicing, via transesterification reactions201/4864324/187234.07e-435.10e-40201
GO:0000377112SkincSCCRNA splicing, via transesterification reactions with bulged adenosine as nucleophile197/4864320/187231.45e-411.14e-38197
GO:0000398112SkincSCCmRNA splicing, via spliceosome197/4864320/187231.45e-411.14e-38197
GO:007182629SkincSCCribonucleoprotein complex subunit organization140/4864227/187235.54e-303.16e-27140
GO:002261829SkincSCCribonucleoprotein complex assembly136/4864220/187232.60e-291.25e-26136
GO:00002458SkincSCCspliceosomal complex assembly42/486479/187232.35e-074.99e-0642
GO:0022613113ThyroidPTCribonucleoprotein complex biogenesis292/5968463/187233.24e-442.05e-40292
GO:0008380113ThyroidPTCRNA splicing273/5968434/187234.44e-411.40e-37273
GO:0000375113ThyroidPTCRNA splicing, via transesterification reactions202/5968324/187236.81e-303.91e-27202
GO:0000377113ThyroidPTCRNA splicing, via transesterification reactions with bulged adenosine as nucleophile199/5968320/187232.96e-291.44e-26199
GO:0000398113ThyroidPTCmRNA splicing, via spliceosome199/5968320/187232.96e-291.44e-26199
GO:0071826113ThyroidPTCribonucleoprotein complex subunit organization134/5968227/187232.34e-172.24e-15134
GO:0022618113ThyroidPTCribonucleoprotein complex assembly130/5968220/187236.25e-175.47e-15130
GO:00002459ThyroidPTCspliceosomal complex assembly39/596879/187238.86e-045.40e-0339
GO:002261334ThyroidATCribonucleoprotein complex biogenesis292/6293463/187233.05e-399.63e-36292
GO:000838034ThyroidATCRNA splicing270/6293434/187237.50e-351.19e-31270
GO:000037534ThyroidATCRNA splicing, via transesterification reactions200/6293324/187231.75e-257.39e-23200
GO:000037734ThyroidATCRNA splicing, via transesterification reactions with bulged adenosine as nucleophile197/6293320/187236.54e-252.18e-22197
GO:000039834ThyroidATCmRNA splicing, via spliceosome197/6293320/187236.54e-252.18e-22197
Page: 1 2 3 4 5 6 7 8 9 10 

check button Enriched KEGG pathways.
Pathway IDTissueDisease StageDescriptionGene RatioBg Ratiopvaluep.adjustqvalueCount
Page: 1 

Top

Cell-cell communication analysis

check buttonIdentification of potential cell-cell interactions between two cell types and their ligand-receptor pairs for different disease states
LigandReceptorLRpairPathwayTissueDisease Stage
Page: 1 

Top

Single-cell gene regulatory network inference analysis

check buttonFind out the significant the regulons (TFs) and the target genes of each regulon across cell types for different disease states
TFCell TypeTissueDisease StageTarget GeneRSSRegulon Activity
∗The dot plots of a searched regulon are shown for all cell subpopulations in each disease state of each tissue based on the regulon specific score inferred using pySCENIC and by calculating the average expression.
Page: 1 

Top

Somatic mutation of malignant transformation related genes

check buttonAnnotation of somatic variants for genes involved in malignant transformation
Hugo SymbolVariant ClassVariant ClassificationdbSNP RSHGVScHGVSpHGVSp ShortSWISSPROTBIOTYPESIFTPolyPhenTumor Sample BarcodeTissueHistologySexAgeStageTherapy TypesDrugsOutcome
SCAF11SNVMissense_Mutationc.3194N>Tp.Ser1065Phep.S1065FQ99590protein_codingdeleterious(0)possibly_damaging(0.786)TCGA-A8-A0A7-01Breastbreast invasive carcinomaFemale<65I/IIUnknownUnknownSD
SCAF11SNVMissense_Mutationnovelc.646N>Cp.Glu216Glnp.E216QQ99590protein_codingdeleterious(0)possibly_damaging(0.805)TCGA-AC-A23H-01Breastbreast invasive carcinomaFemale>=65I/IIUnknownUnknownPD
SCAF11SNVMissense_Mutationc.2243C>Tp.Ser748Phep.S748FQ99590protein_codingtolerated(0.08)benign(0.007)TCGA-BH-A18P-01Breastbreast invasive carcinomaFemale<65I/IIUnknownUnknownPD
SCAF11SNVMissense_Mutationrs372602350c.4102N>Ap.Ala1368Thrp.A1368TQ99590protein_codingdeleterious(0.01)probably_damaging(0.999)TCGA-BH-A42T-01Breastbreast invasive carcinomaFemale>=65I/IIUnknownUnknownSD
SCAF11SNVMissense_Mutationc.2708N>Tp.Pro903Leup.P903LQ99590protein_codingdeleterious(0)possibly_damaging(0.726)TCGA-C8-A1HM-01Breastbreast invasive carcinomaFemale>=65I/IIChemotherapydoxorubicinCR
SCAF11SNVMissense_Mutationc.2720N>Tp.Ser907Phep.S907FQ99590protein_codingdeleterious(0)probably_damaging(0.972)TCGA-E9-A243-01Breastbreast invasive carcinomaFemale<65I/IIChemotherapy5-fluorouracilPD
SCAF11SNVMissense_Mutationrs533218274c.3923N>Gp.Ser1308Cysp.S1308CQ99590protein_codingdeleterious(0.03)benign(0.014)TCGA-EW-A6SA-01Breastbreast invasive carcinomaMale<65I/IIUnknownUnknownSD
SCAF11SNVMissense_Mutationnovelc.493N>Gp.Lys165Glup.K165EQ99590protein_codingtolerated(0.06)possibly_damaging(0.473)TCGA-EW-A6SB-01Breastbreast invasive carcinomaFemale<65I/IIUnknownUnknownSD
SCAF11insertionFrame_Shift_Insnovelc.2_3insTAATCATGTCCp.Met1?p.M1?Q99590protein_codingTCGA-A2-A0CP-01Breastbreast invasive carcinomaFemale<65I/IIChemotherapycytoxanSD
SCAF11insertionFrame_Shift_Insnovelc.2967dupAp.Glu990ArgfsTer5p.E990Rfs*5Q99590protein_codingTCGA-EW-A1IZ-01Breastbreast invasive carcinomaFemale<65III/IVChemotherapytaxotereSD
Page: 1 2 3 4 5 6 7 8 9 10 11 12 13 14 15 16 17 

Top

Related drugs of malignant transformation related genes

check buttonIdentification of chemicals and drugs interact with genes involved in malignant transfromation
(DGIdb 4.0)
Entrez IDSymbolCategoryInteraction TypesDrug Claim NameDrug NamePMIDs
Page: 1