
|
|||||
|
 | |
| |
| |
| |
| |
| |
|
Gene: SAMD4A |
Gene summary for SAMD4A |
| Gene information | Species | Human | Gene symbol | SAMD4A | Gene ID | 23034 |
| Gene name | sterile alpha motif domain containing 4A | |
| Gene Alias | SAMD4 | |
| Cytomap | 14q22.2 | |
| Gene Type | protein-coding | GO ID | GO:0000288 | UniProtAcc | Q9UPU9 |
Top |
Malignant transformation analysis |
| Identification of the aberrant gene expression in precancerous and cancerous lesions by comparing the gene expression of stem-like cells in diseased tissues with normal stem cells |
| Entrez ID | Symbol | Replicates | Species | Organ | Tissue | Adj P-value | Log2FC | Malignancy |
| 23034 | SAMD4A | AEH-subject1 | Human | Endometrium | AEH | 1.60e-06 | 2.54e-01 | -0.3059 |
| 23034 | SAMD4A | AEH-subject2 | Human | Endometrium | AEH | 1.74e-04 | 2.49e-01 | -0.2525 |
| 23034 | SAMD4A | AEH-subject4 | Human | Endometrium | AEH | 7.57e-11 | 5.15e-01 | -0.2657 |
| 23034 | SAMD4A | EEC-subject1 | Human | Endometrium | EEC | 4.65e-18 | 6.21e-01 | -0.2682 |
| 23034 | SAMD4A | EEC-subject2 | Human | Endometrium | EEC | 1.96e-05 | 2.71e-01 | -0.2607 |
| 23034 | SAMD4A | EEC-subject3 | Human | Endometrium | EEC | 5.82e-10 | 4.87e-01 | -0.2525 |
| 23034 | SAMD4A | GSM5276934 | Human | Endometrium | EEC | 2.97e-09 | 3.77e-01 | -0.0913 |
| 23034 | SAMD4A | GSM5276937 | Human | Endometrium | EEC | 5.91e-08 | 3.42e-01 | -0.0897 |
| 23034 | SAMD4A | GSM6177620_NYU_UCEC1_lib3_lib3 | Human | Endometrium | EEC | 2.15e-04 | -3.42e-02 | -0.1883 |
| 23034 | SAMD4A | GSM6177622_NYU_UCEC3_lib1_lib1 | Human | Endometrium | EEC | 3.29e-02 | -7.43e-02 | -0.1917 |
| 23034 | SAMD4A | GSM6177622_NYU_UCEC3_lib2_lib2 | Human | Endometrium | EEC | 1.73e-02 | -7.43e-02 | -0.1916 |
| 23034 | SAMD4A | TD9 | Human | Lung | IAC | 1.99e-06 | 7.63e-01 | 0.088 |
| 23034 | SAMD4A | RNA-P10T2-P10T2-1 | Human | Lung | AAH | 1.77e-08 | 1.09e+00 | -0.1271 |
| 23034 | SAMD4A | RNA-P10T2-P10T2-2 | Human | Lung | AAH | 1.77e-08 | 9.54e-01 | -0.1406 |
| 23034 | SAMD4A | RNA-P10T2-P10T2-3 | Human | Lung | AAH | 2.77e-05 | 7.25e-01 | -0.1408 |
| 23034 | SAMD4A | RNA-P10T2-P10T2-4 | Human | Lung | AAH | 8.52e-06 | 8.28e-01 | -0.138 |
| 23034 | SAMD4A | RNA-P17T-P17T-2 | Human | Lung | IAC | 1.99e-06 | 8.11e-01 | 0.3371 |
| 23034 | SAMD4A | RNA-P17T-P17T-4 | Human | Lung | IAC | 5.52e-10 | 1.03e+00 | 0.343 |
| 23034 | SAMD4A | RNA-P17T-P17T-6 | Human | Lung | IAC | 1.13e-06 | 8.32e-01 | 0.3385 |
| 23034 | SAMD4A | RNA-P17T-P17T-8 | Human | Lung | IAC | 5.26e-09 | 8.28e-01 | 0.3329 |
| Page: 1 2 3 4 |
| Tissue | Expression Dynamics | Abbreviation |
| Endometrium | 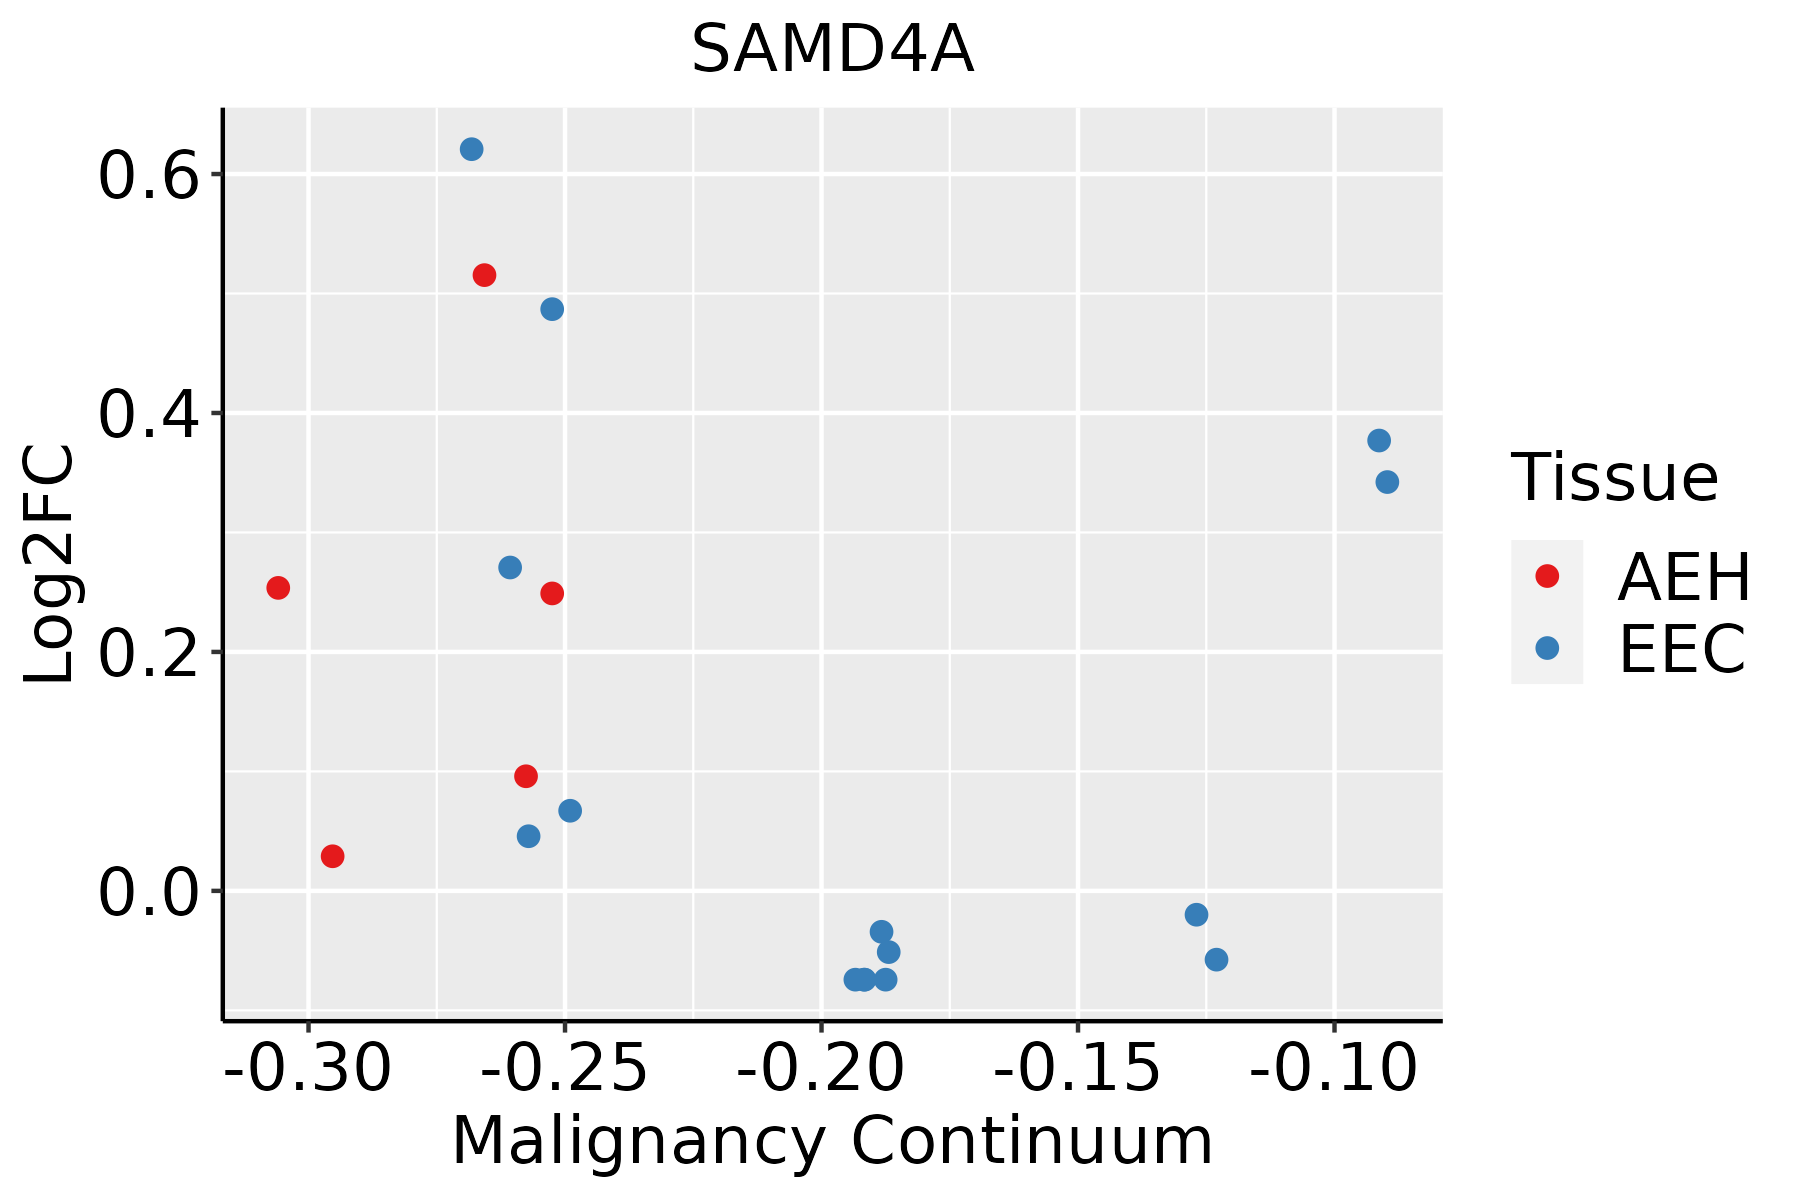 | AEH: Atypical endometrial hyperplasia |
| EEC: Endometrioid Cancer | ||
| Lung | 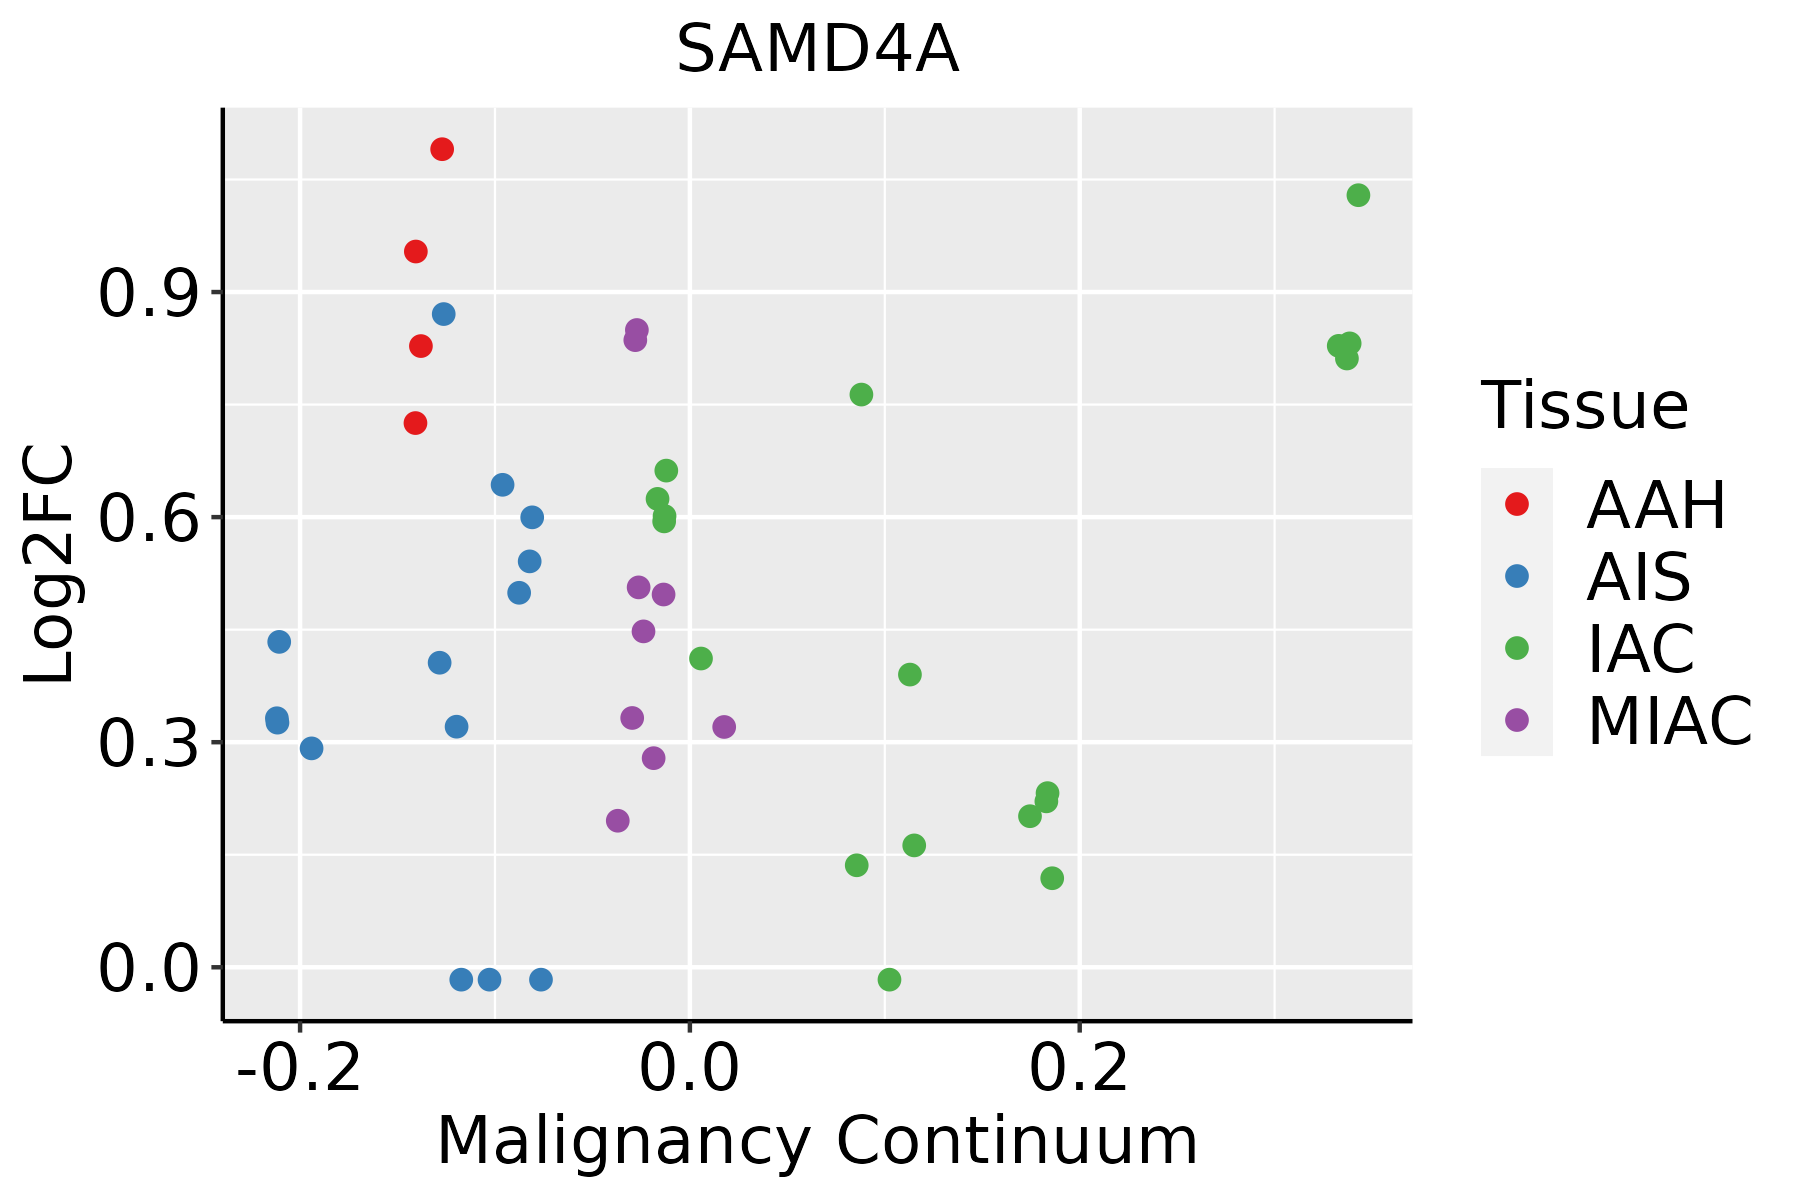 | AAH: Atypical adenomatous hyperplasia |
| AIS: Adenocarcinoma in situ | ||
| IAC: Invasive lung adenocarcinoma | ||
| MIA: Minimally invasive adenocarcinoma | ||
| Prostate | 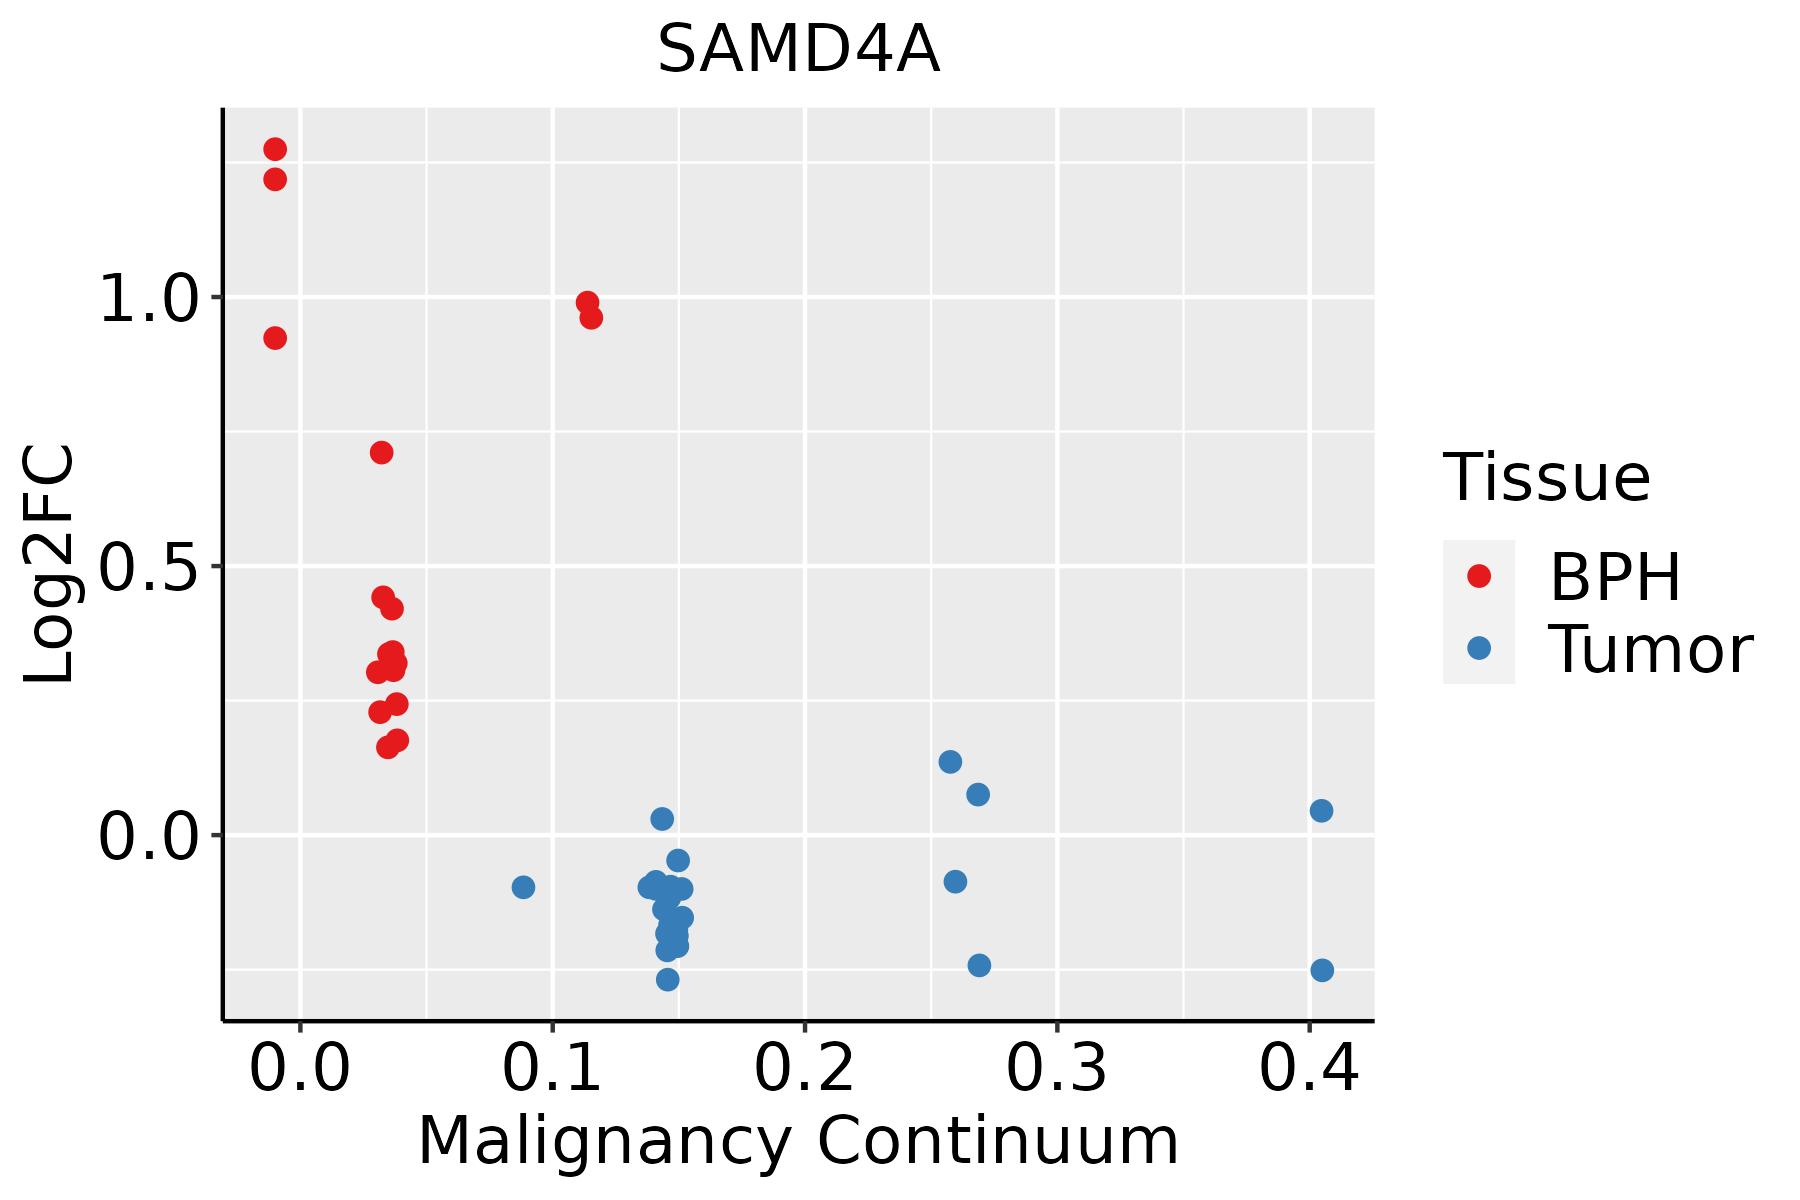 | BPH: Benign Prostatic Hyperplasia |
| Thyroid |  | ATC: Anaplastic thyroid cancer |
| HT: Hashimoto's thyroiditis | ||
| PTC: Papillary thyroid cancer |
| ∗log2FC in expression of this searched gene in stem-like cells from each diseased tissue sample relative to stem-like cells in normal samples in each tissue plotted against the malignancy continuum. Samples are colored based on if they are from different disease stage. |
Top |
Malignant transformation related pathway analysis |
| Find out the enriched GO biological processes and KEGG pathways involved in transition from healthy to precancer to cancer |
| Tissue | Disease Stage | Enriched GO biological Processes |
| Colorectum | AD |  |
| Colorectum | SER |  |
| Colorectum | MSS |  |
| Colorectum | MSI-H |  |
| Colorectum | FAP |  |
| ∗Top 15 enriched GO BP terms are showed in the bar plot of each disease state in each tissue. Each row represents a significant GO biological process which is colored according to the -log10(p.adjust). |
| Page: 1 2 3 4 5 6 7 8 9 |
| GO ID | Tissue | Disease Stage | Description | Gene Ratio | Bg Ratio | pvalue | p.adjust | Count |
| GO:1903311112 | Thyroid | PTC | regulation of mRNA metabolic process | 181/5968 | 288/18723 | 1.60e-27 | 5.94e-25 | 181 |
| GO:0006401112 | Thyroid | PTC | RNA catabolic process | 163/5968 | 278/18723 | 2.13e-20 | 3.27e-18 | 163 |
| GO:0006402112 | Thyroid | PTC | mRNA catabolic process | 139/5968 | 232/18723 | 9.59e-19 | 1.12e-16 | 139 |
| GO:0006417113 | Thyroid | PTC | regulation of translation | 236/5968 | 468/18723 | 2.70e-17 | 2.52e-15 | 236 |
| GO:0034655112 | Thyroid | PTC | nucleobase-containing compound catabolic process | 211/5968 | 407/18723 | 2.72e-17 | 2.52e-15 | 211 |
| GO:0000956111 | Thyroid | PTC | nuclear-transcribed mRNA catabolic process | 78/5968 | 112/18723 | 2.37e-16 | 1.94e-14 | 78 |
| GO:0046700111 | Thyroid | PTC | heterocycle catabolic process | 221/5968 | 445/18723 | 2.43e-15 | 1.72e-13 | 221 |
| GO:0044270111 | Thyroid | PTC | cellular nitrogen compound catabolic process | 223/5968 | 451/18723 | 3.34e-15 | 2.31e-13 | 223 |
| GO:0034250113 | Thyroid | PTC | positive regulation of cellular amide metabolic process | 98/5968 | 162/18723 | 5.26e-14 | 3.04e-12 | 98 |
| GO:0019439111 | Thyroid | PTC | aromatic compound catabolic process | 225/5968 | 467/18723 | 8.51e-14 | 4.71e-12 | 225 |
| GO:1903313110 | Thyroid | PTC | positive regulation of mRNA metabolic process | 76/5968 | 118/18723 | 3.60e-13 | 1.80e-11 | 76 |
| GO:0045727113 | Thyroid | PTC | positive regulation of translation | 84/5968 | 136/18723 | 6.52e-13 | 3.08e-11 | 84 |
| GO:1901361111 | Thyroid | PTC | organic cyclic compound catabolic process | 231/5968 | 495/18723 | 2.55e-12 | 1.12e-10 | 231 |
| GO:0043487111 | Thyroid | PTC | regulation of RNA stability | 97/5968 | 170/18723 | 9.51e-12 | 3.97e-10 | 97 |
| GO:0061013111 | Thyroid | PTC | regulation of mRNA catabolic process | 94/5968 | 166/18723 | 3.55e-11 | 1.29e-09 | 94 |
| GO:0043488111 | Thyroid | PTC | regulation of mRNA stability | 90/5968 | 158/18723 | 5.98e-11 | 2.11e-09 | 90 |
| GO:006115719 | Thyroid | PTC | mRNA destabilization | 52/5968 | 84/18723 | 1.40e-08 | 3.30e-07 | 52 |
| GO:006101419 | Thyroid | PTC | positive regulation of mRNA catabolic process | 53/5968 | 87/18723 | 2.25e-08 | 5.16e-07 | 53 |
| GO:005077919 | Thyroid | PTC | RNA destabilization | 53/5968 | 88/18723 | 3.91e-08 | 8.51e-07 | 53 |
| GO:000028819 | Thyroid | PTC | nuclear-transcribed mRNA catabolic process, deadenylation-dependent decay | 36/5968 | 56/18723 | 6.19e-07 | 9.83e-06 | 36 |
| Page: 1 2 3 4 5 6 7 8 9 10 11 |
| Pathway ID | Tissue | Disease Stage | Description | Gene Ratio | Bg Ratio | pvalue | p.adjust | qvalue | Count |
| Page: 1 |
Top |
Cell-cell communication analysis |
| Identification of potential cell-cell interactions between two cell types and their ligand-receptor pairs for different disease states |
| Ligand | Receptor | LRpair | Pathway | Tissue | Disease Stage |
| Page: 1 |
Top |
Single-cell gene regulatory network inference analysis |
| Find out the significant the regulons (TFs) and the target genes of each regulon across cell types for different disease states |
| TF | Cell Type | Tissue | Disease Stage | Target Gene | RSS | Regulon Activity |
| ∗The dot plots of a searched regulon are shown for all cell subpopulations in each disease state of each tissue based on the regulon specific score inferred using pySCENIC and by calculating the average expression. |
| Page: 1 |
Top |
Somatic mutation of malignant transformation related genes |
| Annotation of somatic variants for genes involved in malignant transformation |
| Hugo Symbol | Variant Class | Variant Classification | dbSNP RS | HGVSc | HGVSp | HGVSp Short | SWISSPROT | BIOTYPE | SIFT | PolyPhen | Tumor Sample Barcode | Tissue | Histology | Sex | Age | Stage | Therapy Types | Drugs | Outcome |
| SAMD4A | SNV | Missense_Mutation | c.361G>A | p.Glu121Lys | p.E121K | Q9UPU9 | protein_coding | tolerated(0.05) | probably_damaging(0.918) | TCGA-A8-A094-01 | Breast | breast invasive carcinoma | Female | >=65 | I/II | Unknown | Unknown | SD | |
| SAMD4A | SNV | Missense_Mutation | c.570N>T | p.Trp190Cys | p.W190C | Q9UPU9 | protein_coding | deleterious(0) | probably_damaging(0.997) | TCGA-AR-A24N-01 | Breast | breast invasive carcinoma | Female | <65 | I/II | Unknown | Unknown | SD | |
| SAMD4A | SNV | Missense_Mutation | c.1589N>C | p.Ile530Thr | p.I530T | Q9UPU9 | protein_coding | tolerated(0.63) | benign(0.001) | TCGA-BH-A0BZ-01 | Breast | breast invasive carcinoma | Female | <65 | III/IV | Chemotherapy | doxorubicin | CR | |
| SAMD4A | SNV | Missense_Mutation | c.820N>A | p.Glu274Lys | p.E274K | Q9UPU9 | protein_coding | deleterious(0.04) | benign(0.321) | TCGA-D8-A1JA-01 | Breast | breast invasive carcinoma | Female | <65 | III/IV | Chemotherapy | adriamycin | PD | |
| SAMD4A | deletion | Frame_Shift_Del | c.866delN | p.Leu291CysfsTer7 | p.L291Cfs*7 | Q9UPU9 | protein_coding | TCGA-AO-A128-01 | Breast | breast invasive carcinoma | Female | <65 | I/II | Chemotherapy | doxorubicin | SD | |||
| SAMD4A | insertion | Frame_Shift_Ins | novel | c.523dupC | p.His175ProfsTer10 | p.H175Pfs*10 | Q9UPU9 | protein_coding | TCGA-B6-A0IE-01 | Breast | breast invasive carcinoma | Female | <65 | III/IV | Unknown | Unknown | PD | ||
| SAMD4A | insertion | Nonsense_Mutation | novel | c.524_525insAGGATAAAGTGATTTCCCTCCTGTTAACTCATCTGCCTTTG | p.His175GlnfsTer3 | p.H175Qfs*3 | Q9UPU9 | protein_coding | TCGA-B6-A0IE-01 | Breast | breast invasive carcinoma | Female | <65 | III/IV | Unknown | Unknown | PD | ||
| SAMD4A | deletion | Frame_Shift_Del | c.866delN | p.Leu291CysfsTer7 | p.L291Cfs*7 | Q9UPU9 | protein_coding | TCGA-EW-A2FV-01 | Breast | breast invasive carcinoma | Female | <65 | III/IV | Chemotherapy | docetaxel | SD | |||
| SAMD4A | SNV | Missense_Mutation | c.931N>G | p.Gln311Glu | p.Q311E | Q9UPU9 | protein_coding | tolerated(0.2) | benign(0.015) | TCGA-C5-A1BK-01 | Cervix | cervical & endocervical cancer | Female | <65 | I/II | Unknown | Unknown | SD | |
| SAMD4A | SNV | Missense_Mutation | c.1540N>A | p.Asp514Asn | p.D514N | Q9UPU9 | protein_coding | deleterious(0) | benign(0.146) | TCGA-C5-A1BQ-01 | Cervix | cervical & endocervical cancer | Female | >=65 | III/IV | Chemotherapy | cisplatin | CR |
| Page: 1 2 3 4 5 6 7 8 |
Top |
Related drugs of malignant transformation related genes |
| Identification of chemicals and drugs interact with genes involved in malignant transfromation |
| (DGIdb 4.0) |
| Entrez ID | Symbol | Category | Interaction Types | Drug Claim Name | Drug Name | PMIDs |
| Page: 1 |

Copyright 2023-Present -The University of Texas Health Science Center at Houston |