
|
|||||
|
 | |
| |
| |
| |
| |
| |
|
Gene: RNF126 |
Gene summary for RNF126 |
| Gene information | Species | Human | Gene symbol | RNF126 | Gene ID | 55658 |
| Gene name | ring finger protein 126 | |
| Gene Alias | RNF126 | |
| Cytomap | 19p13.3 | |
| Gene Type | protein-coding | GO ID | GO:0000209 | UniProtAcc | A0A024R206 |
Top |
Malignant transformation analysis |
| Identification of the aberrant gene expression in precancerous and cancerous lesions by comparing the gene expression of stem-like cells in diseased tissues with normal stem cells |
| Entrez ID | Symbol | Replicates | Species | Organ | Tissue | Adj P-value | Log2FC | Malignancy |
| 55658 | RNF126 | HTA11_3410_2000001011 | Human | Colorectum | AD | 1.73e-02 | 1.29e-01 | 0.0155 |
| 55658 | RNF126 | HTA11_2487_2000001011 | Human | Colorectum | SER | 1.30e-06 | 3.30e-01 | -0.1808 |
| 55658 | RNF126 | HTA11_347_2000001011 | Human | Colorectum | AD | 6.55e-06 | 2.09e-01 | -0.1954 |
| 55658 | RNF126 | HTA11_2112_2000001011 | Human | Colorectum | SER | 4.46e-04 | 4.04e-01 | -0.2196 |
| 55658 | RNF126 | HTA11_83_2000001011 | Human | Colorectum | SER | 1.42e-04 | 2.80e-01 | -0.1526 |
| 55658 | RNF126 | HTA11_696_2000001011 | Human | Colorectum | AD | 2.63e-02 | 2.44e-01 | -0.1464 |
| 55658 | RNF126 | HTA11_1391_2000001011 | Human | Colorectum | AD | 6.65e-12 | 4.55e-01 | -0.059 |
| 55658 | RNF126 | HTA11_99999965062_69753 | Human | Colorectum | MSI-H | 1.26e-03 | 7.85e-01 | 0.3487 |
| 55658 | RNF126 | HTA11_99999965104_69814 | Human | Colorectum | MSS | 5.39e-09 | 4.43e-01 | 0.281 |
| 55658 | RNF126 | HTA11_99999971662_82457 | Human | Colorectum | MSS | 4.50e-04 | 3.10e-01 | 0.3859 |
| 55658 | RNF126 | LZE4T | Human | Esophagus | ESCC | 7.22e-05 | 4.93e-02 | 0.0811 |
| 55658 | RNF126 | LZE7T | Human | Esophagus | ESCC | 4.48e-04 | 2.73e-01 | 0.0667 |
| 55658 | RNF126 | LZE8T | Human | Esophagus | ESCC | 7.54e-03 | 5.22e-03 | 0.067 |
| 55658 | RNF126 | LZE20T | Human | Esophagus | ESCC | 1.65e-04 | 1.29e-01 | 0.0662 |
| 55658 | RNF126 | LZE22T | Human | Esophagus | ESCC | 1.17e-03 | 3.89e-01 | 0.068 |
| 55658 | RNF126 | LZE24T | Human | Esophagus | ESCC | 2.50e-12 | 4.66e-01 | 0.0596 |
| 55658 | RNF126 | LZE21T | Human | Esophagus | ESCC | 1.92e-03 | 3.74e-01 | 0.0655 |
| 55658 | RNF126 | P1T-E | Human | Esophagus | ESCC | 3.62e-14 | 7.94e-01 | 0.0875 |
| 55658 | RNF126 | P2T-E | Human | Esophagus | ESCC | 2.59e-25 | 5.12e-01 | 0.1177 |
| 55658 | RNF126 | P4T-E | Human | Esophagus | ESCC | 4.97e-44 | 1.16e+00 | 0.1323 |
| Page: 1 2 3 4 5 6 7 |
| Tissue | Expression Dynamics | Abbreviation |
| Colorectum (GSE201348) |  | FAP: Familial adenomatous polyposis |
| CRC: Colorectal cancer | ||
| Colorectum (HTA11) |  | AD: Adenomas |
| SER: Sessile serrated lesions | ||
| MSI-H: Microsatellite-high colorectal cancer | ||
| MSS: Microsatellite stable colorectal cancer | ||
| Esophagus | 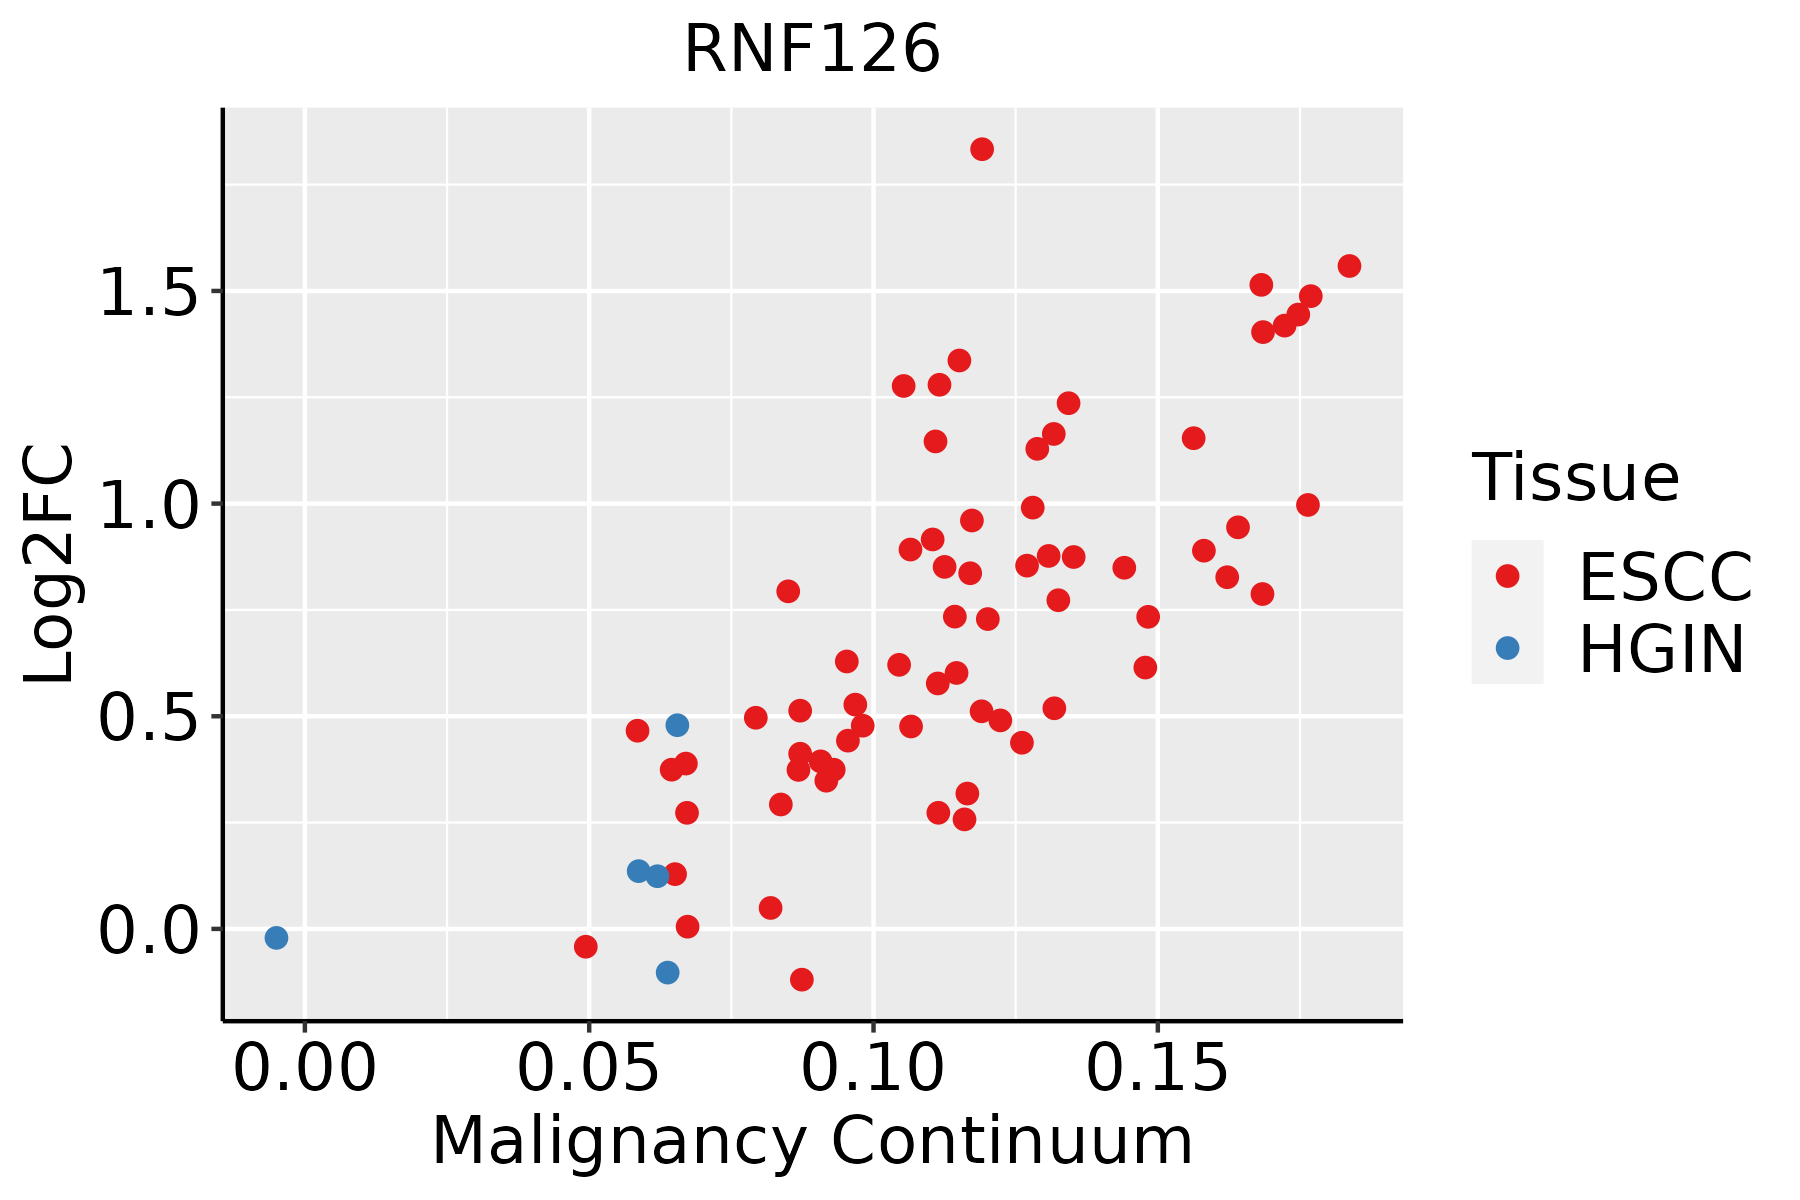 | ESCC: Esophageal squamous cell carcinoma |
| HGIN: High-grade intraepithelial neoplasias | ||
| LGIN: Low-grade intraepithelial neoplasias | ||
| Liver | 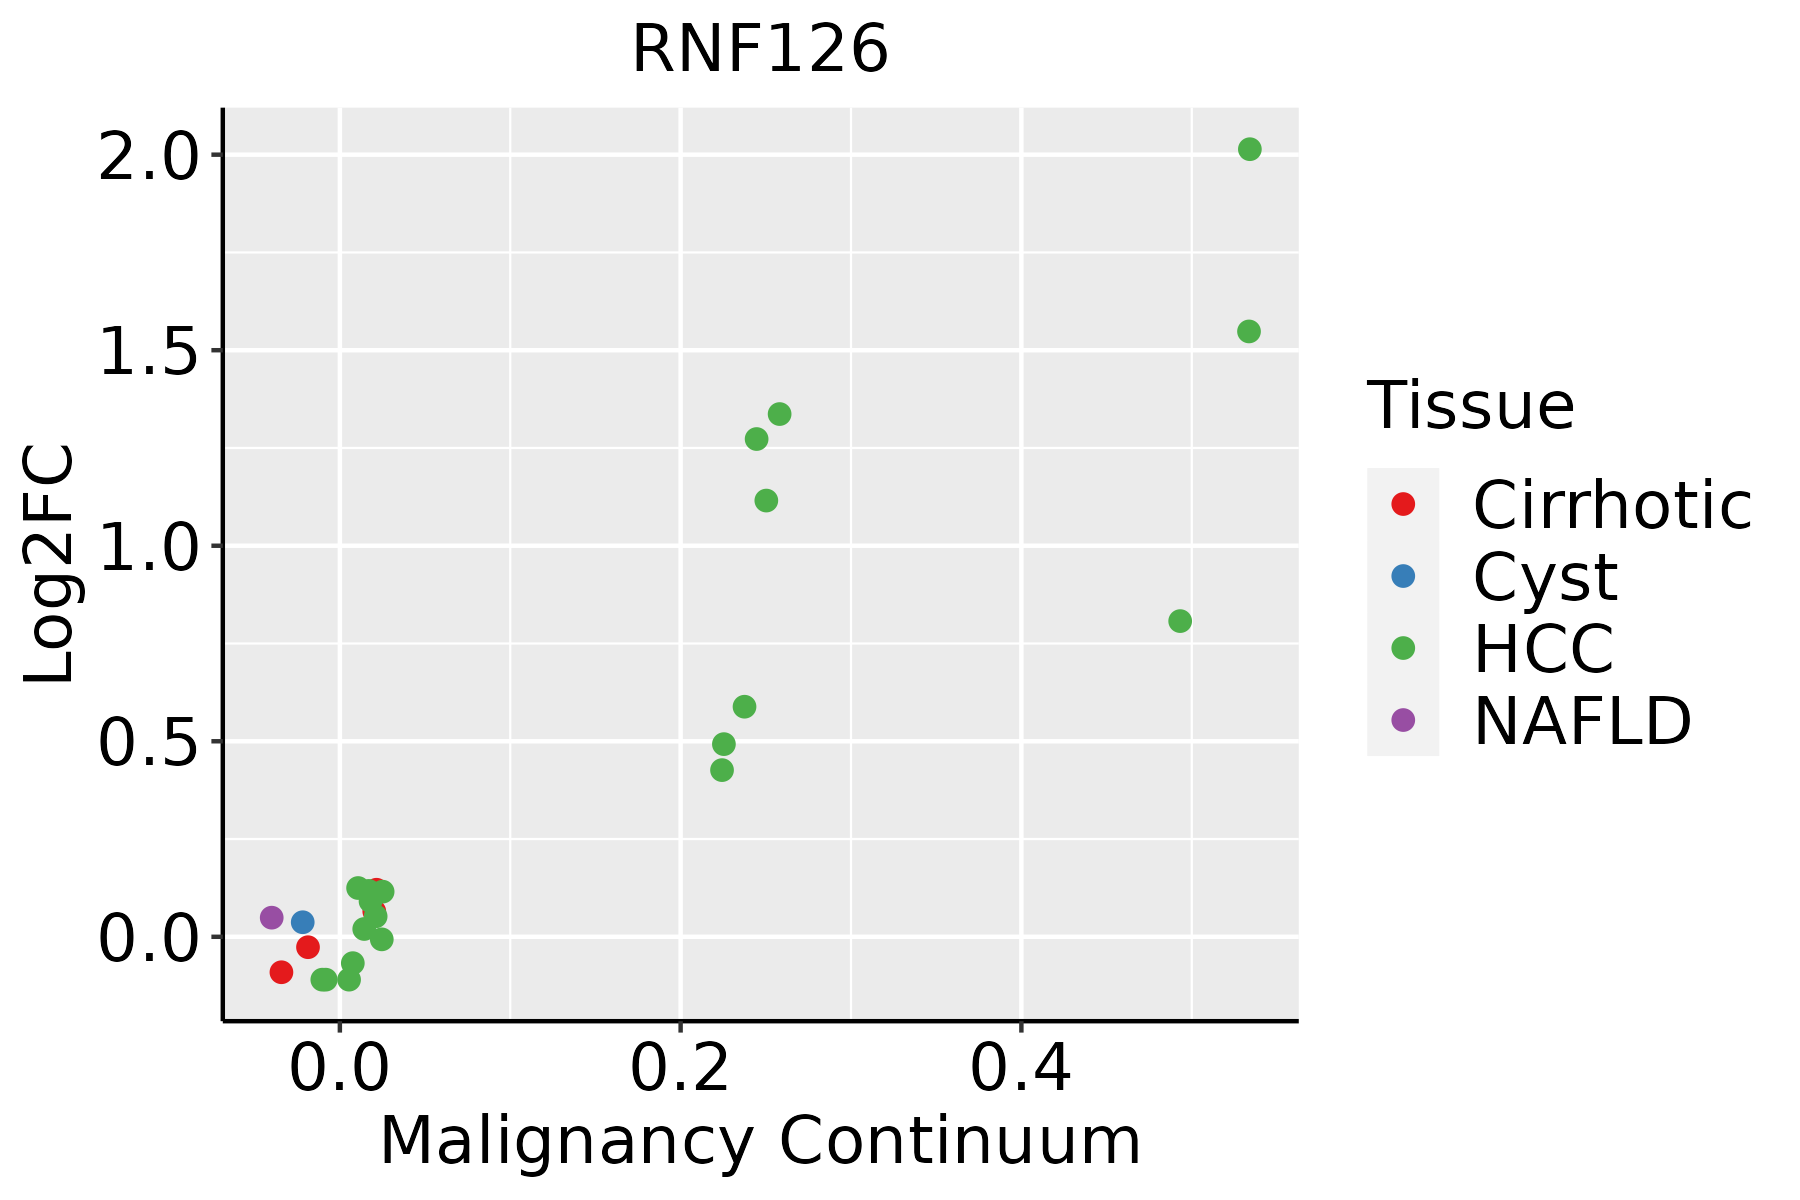 | HCC: Hepatocellular carcinoma |
| NAFLD: Non-alcoholic fatty liver disease | ||
| Oral Cavity | 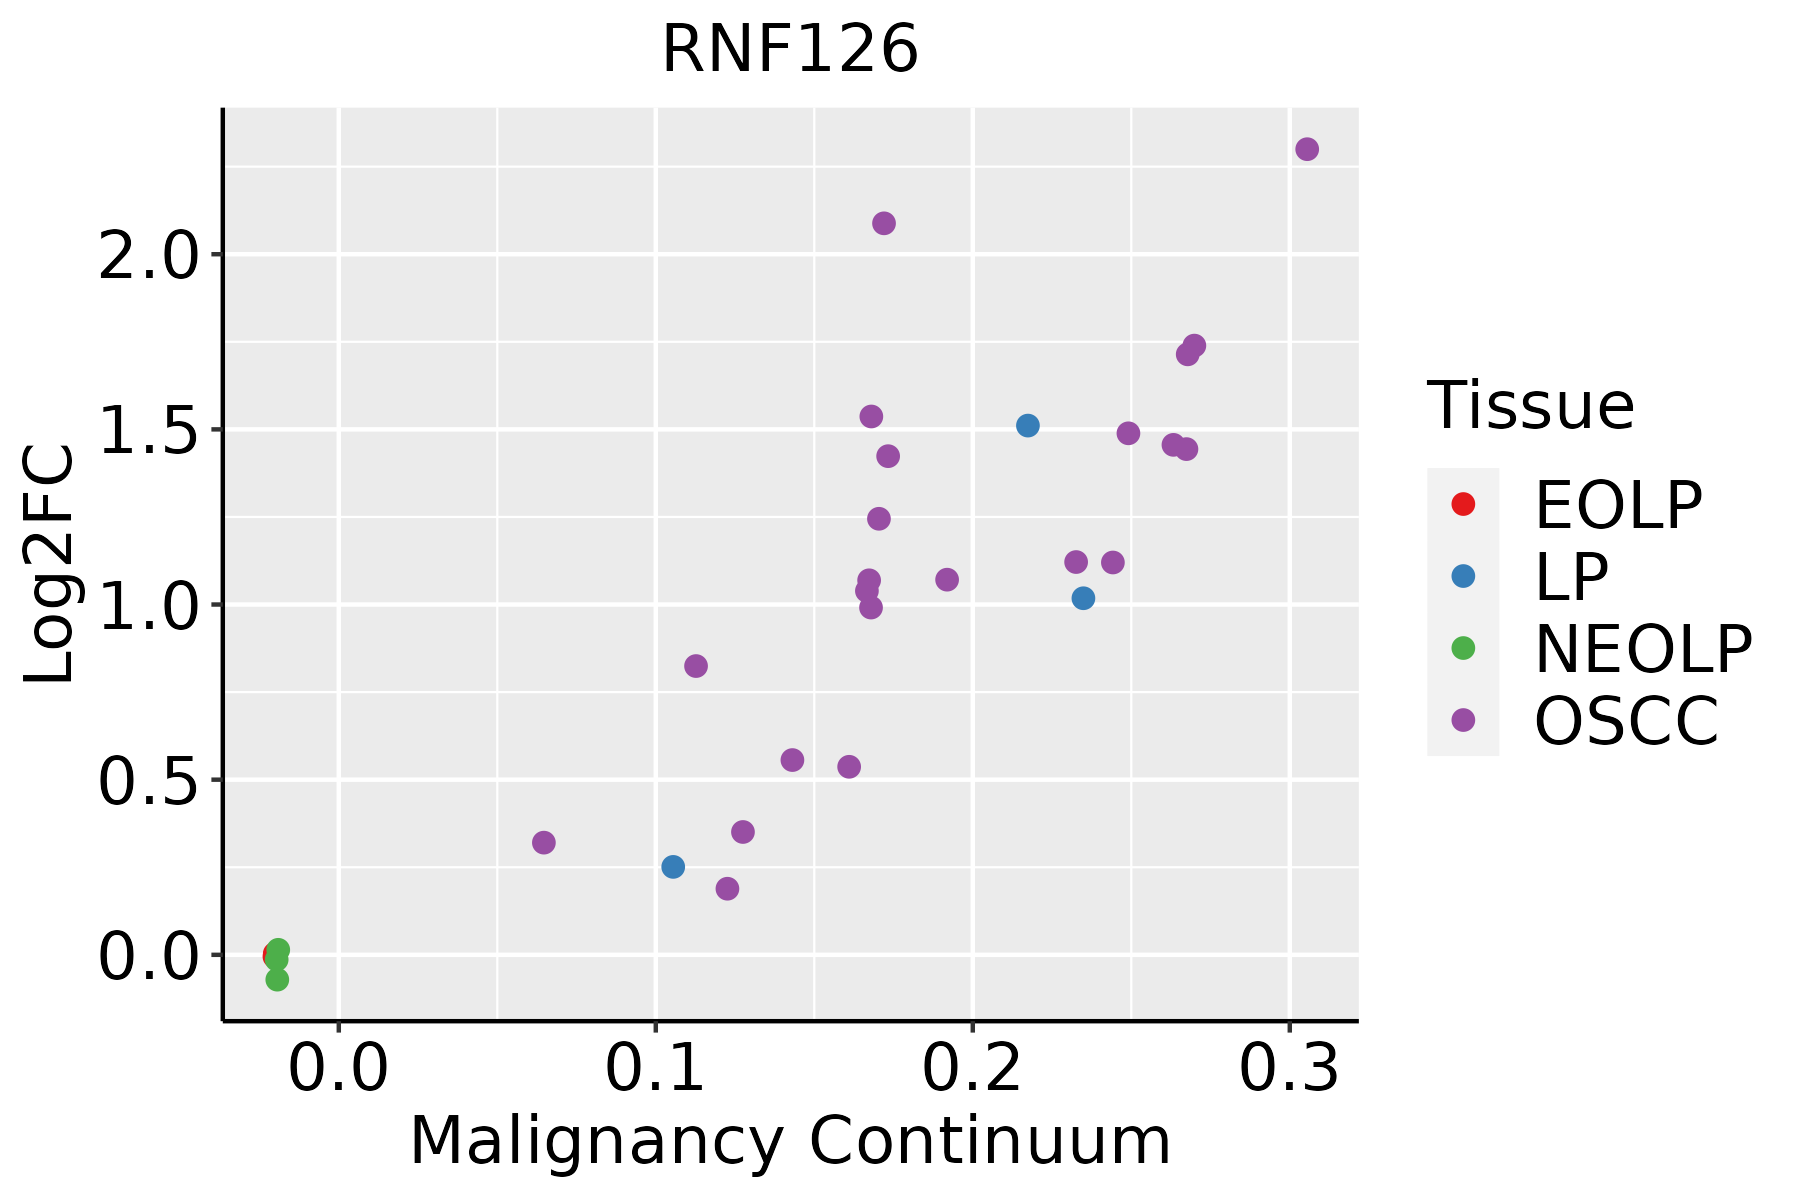 | EOLP: Erosive Oral lichen planus |
| LP: leukoplakia | ||
| NEOLP: Non-erosive oral lichen planus | ||
| OSCC: Oral squamous cell carcinoma | ||
| Skin | 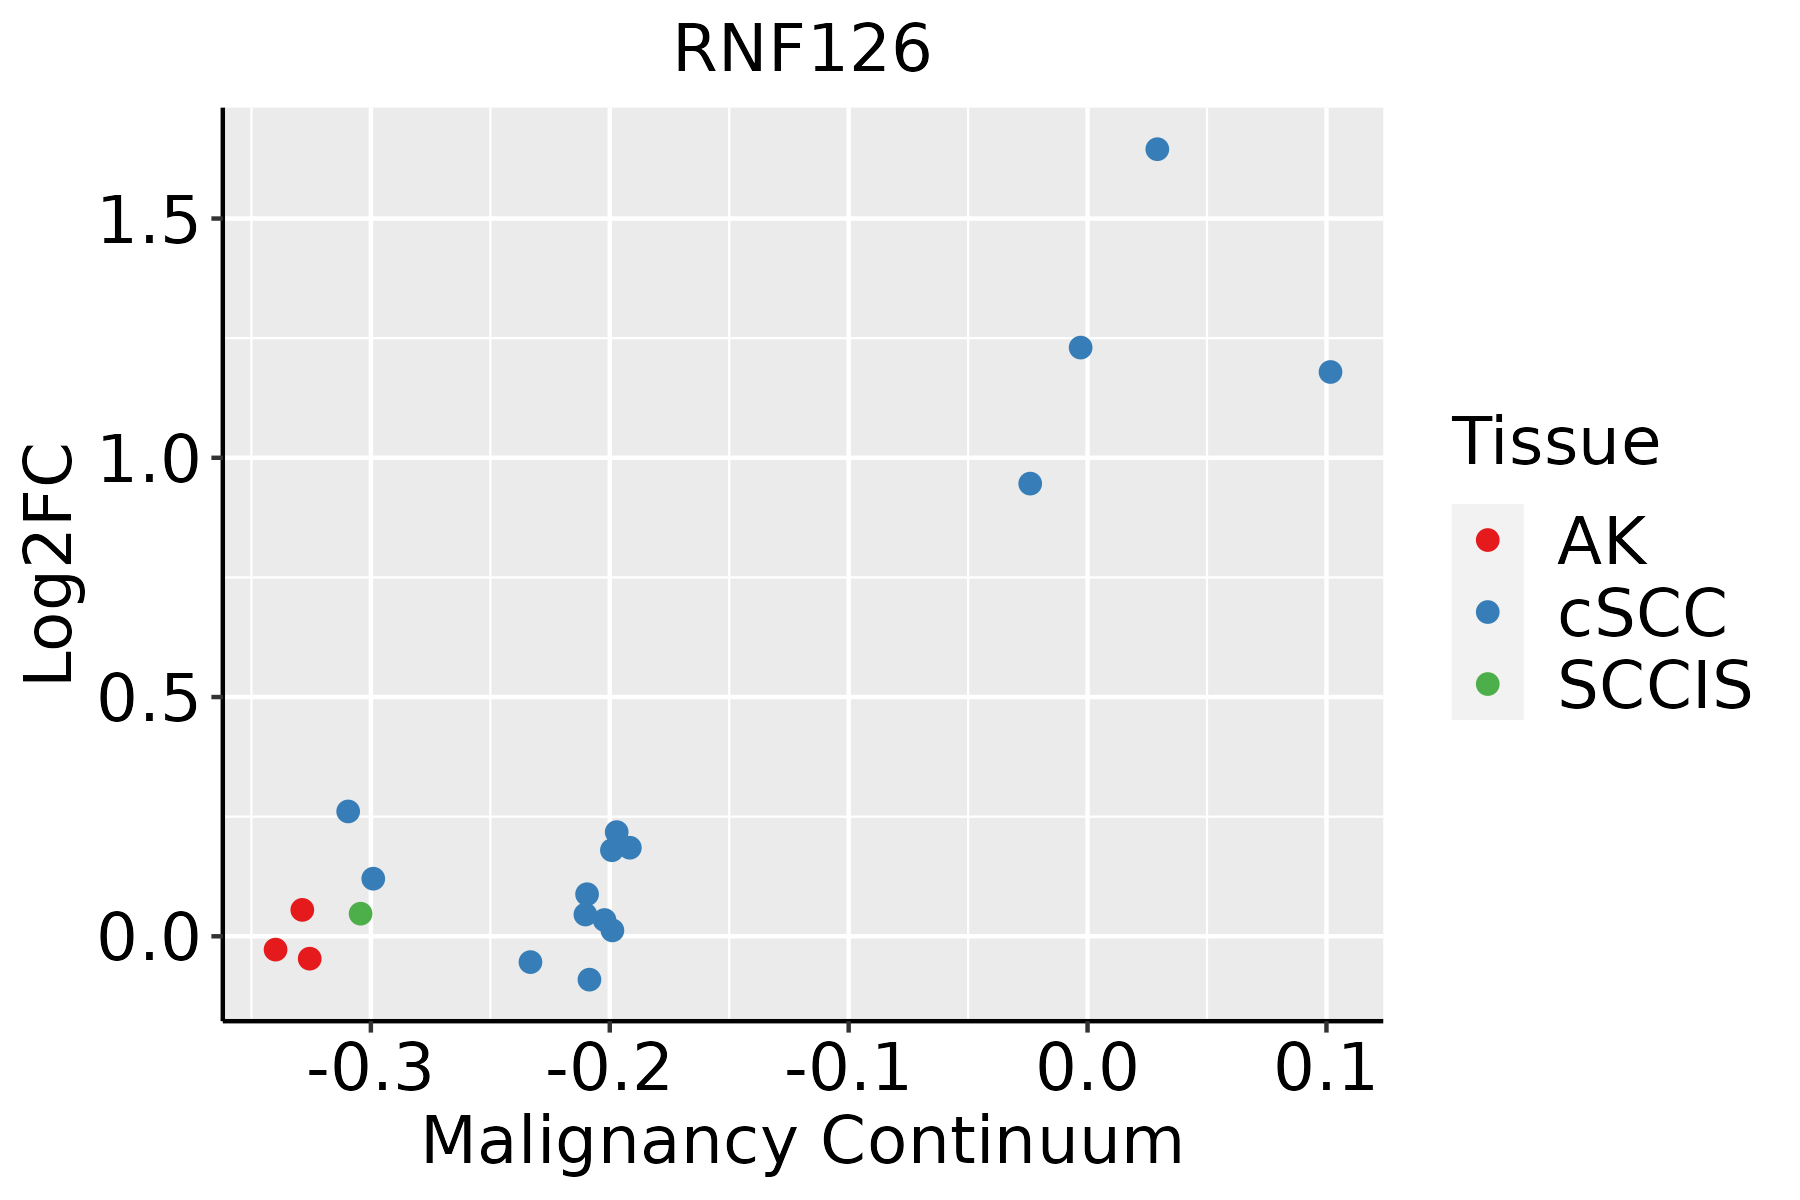 | AK: Actinic keratosis |
| cSCC: Cutaneous squamous cell carcinoma | ||
| SCCIS:squamous cell carcinoma in situ | ||
| Thyroid | 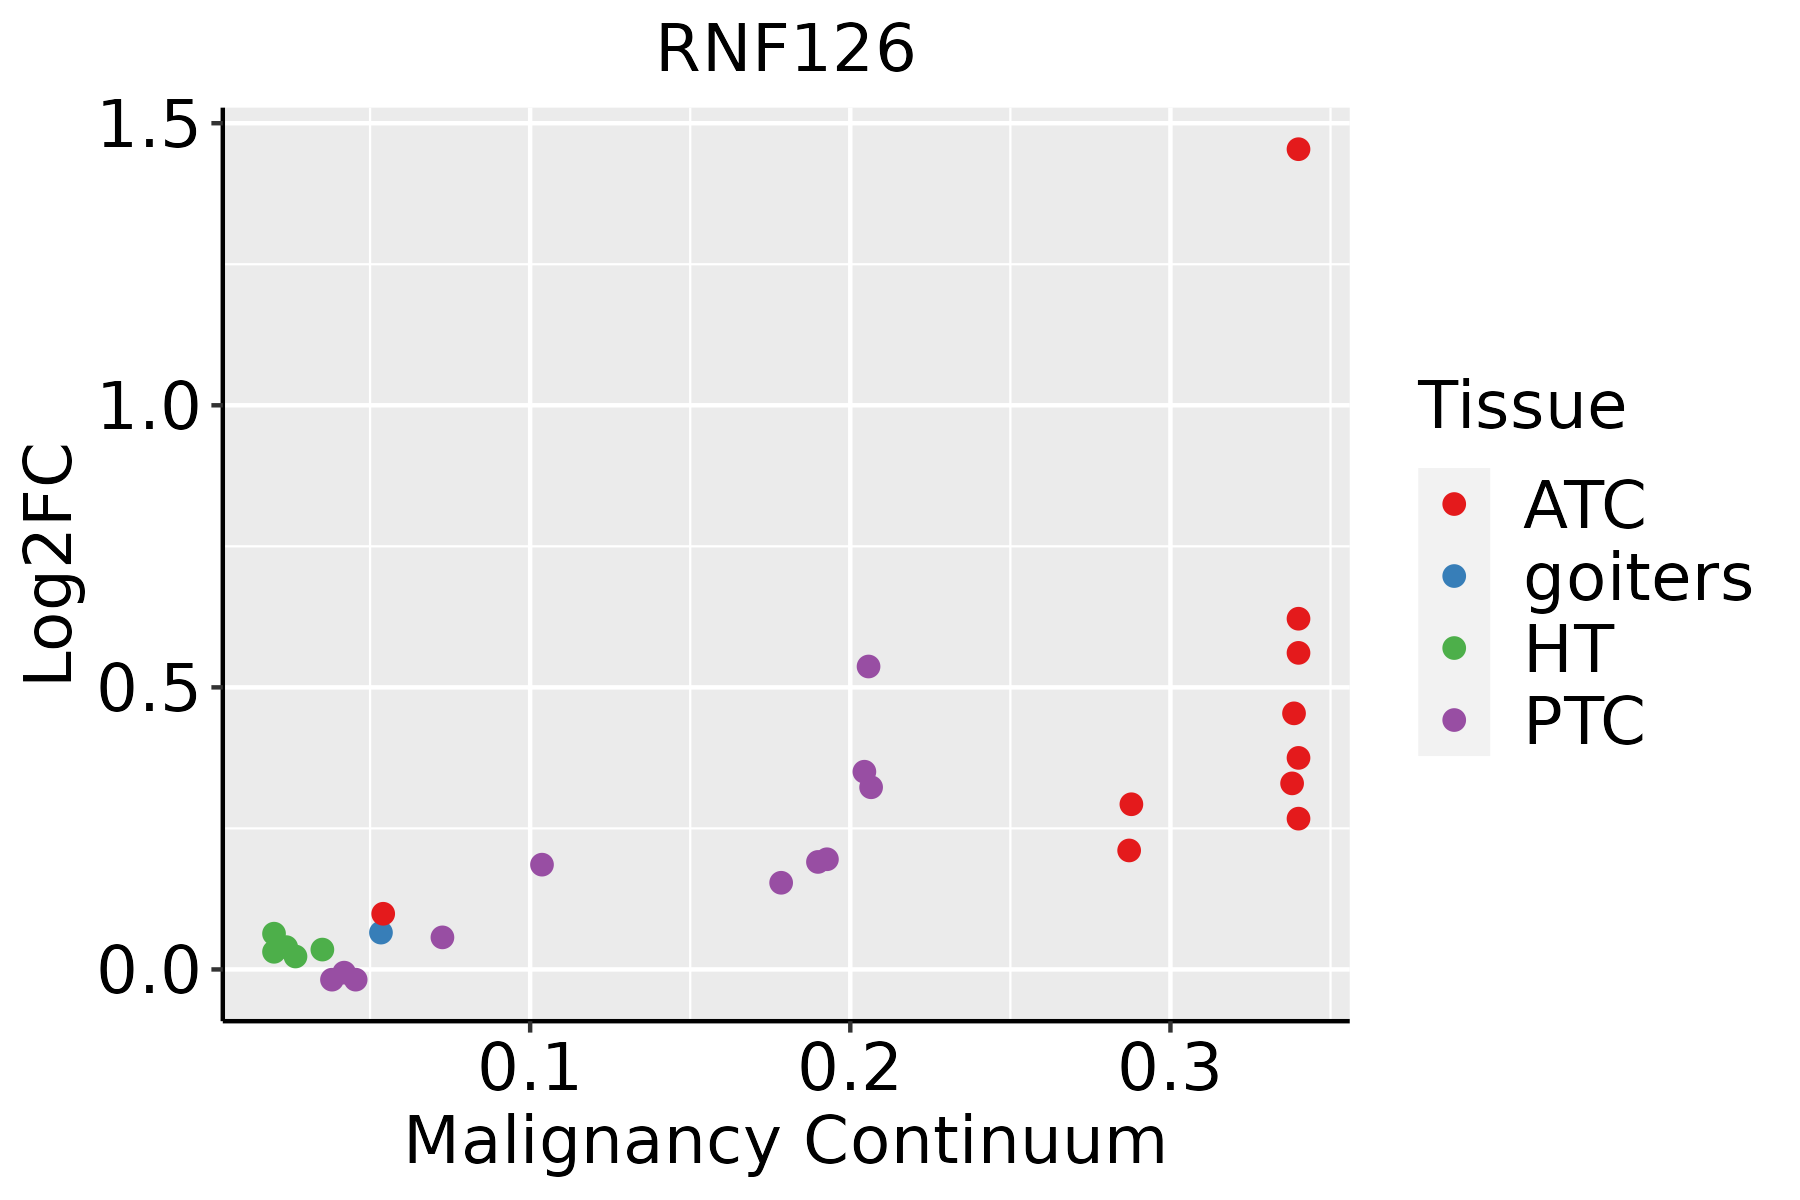 | ATC: Anaplastic thyroid cancer |
| HT: Hashimoto's thyroiditis | ||
| PTC: Papillary thyroid cancer |
| ∗log2FC in expression of this searched gene in stem-like cells from each diseased tissue sample relative to stem-like cells in normal samples in each tissue plotted against the malignancy continuum. Samples are colored based on if they are from different disease stage. |
Top |
Malignant transformation related pathway analysis |
| Find out the enriched GO biological processes and KEGG pathways involved in transition from healthy to precancer to cancer |
| Tissue | Disease Stage | Enriched GO biological Processes |
| Colorectum | AD |  |
| Colorectum | SER |  |
| Colorectum | MSS |  |
| Colorectum | MSI-H |  |
| Colorectum | FAP |  |
| ∗Top 15 enriched GO BP terms are showed in the bar plot of each disease state in each tissue. Each row represents a significant GO biological process which is colored according to the -log10(p.adjust). |
| Page: 1 2 3 4 5 6 7 8 9 |
| GO ID | Tissue | Disease Stage | Description | Gene Ratio | Bg Ratio | pvalue | p.adjust | Count |
| GO:003812724 | Skin | cSCC | ERBB signaling pathway | 55/4864 | 121/18723 | 2.77e-06 | 4.38e-05 | 55 |
| GO:001648216 | Skin | cSCC | cytosolic transport | 71/4864 | 168/18723 | 3.02e-06 | 4.72e-05 | 71 |
| GO:000717323 | Skin | cSCC | epidermal growth factor receptor signaling pathway | 48/4864 | 108/18723 | 2.42e-05 | 2.76e-04 | 48 |
| GO:007053414 | Skin | cSCC | protein K63-linked ubiquitination | 29/4864 | 56/18723 | 3.25e-05 | 3.56e-04 | 29 |
| GO:004214714 | Skin | cSCC | retrograde transport, endosome to Golgi | 40/4864 | 91/18723 | 1.49e-04 | 1.33e-03 | 40 |
| GO:00517885 | Skin | cSCC | response to misfolded protein | 15/4864 | 25/18723 | 3.36e-04 | 2.67e-03 | 15 |
| GO:00431624 | Skin | cSCC | ubiquitin-dependent protein catabolic process via the multivesicular body sorting pathway | 14/4864 | 23/18723 | 4.32e-04 | 3.34e-03 | 14 |
| GO:004205813 | Skin | cSCC | regulation of epidermal growth factor receptor signaling pathway | 32/4864 | 73/18723 | 6.98e-04 | 4.97e-03 | 32 |
| GO:190118414 | Skin | cSCC | regulation of ERBB signaling pathway | 34/4864 | 79/18723 | 7.23e-04 | 5.06e-03 | 34 |
| GO:00065137 | Skin | cSCC | protein monoubiquitination | 29/4864 | 67/18723 | 1.55e-03 | 9.60e-03 | 29 |
| GO:00065155 | Skin | cSCC | protein quality control for misfolded or incompletely synthesized proteins | 15/4864 | 28/18723 | 1.69e-03 | 1.04e-02 | 15 |
| GO:004205910 | Skin | cSCC | negative regulation of epidermal growth factor receptor signaling pathway | 15/4864 | 28/18723 | 1.69e-03 | 1.04e-02 | 15 |
| GO:00712185 | Skin | cSCC | cellular response to misfolded protein | 13/4864 | 23/18723 | 1.81e-03 | 1.09e-02 | 13 |
| GO:190118510 | Skin | cSCC | negative regulation of ERBB signaling pathway | 16/4864 | 32/18723 | 3.04e-03 | 1.67e-02 | 16 |
| GO:0010498113 | Thyroid | PTC | proteasomal protein catabolic process | 297/5968 | 490/18723 | 4.58e-40 | 9.63e-37 | 297 |
| GO:0043161113 | Thyroid | PTC | proteasome-mediated ubiquitin-dependent protein catabolic process | 254/5968 | 412/18723 | 3.91e-36 | 4.54e-33 | 254 |
| GO:0035966113 | Thyroid | PTC | response to topologically incorrect protein | 101/5968 | 159/18723 | 2.00e-16 | 1.66e-14 | 101 |
| GO:001619718 | Thyroid | PTC | endosomal transport | 128/5968 | 230/18723 | 6.26e-14 | 3.52e-12 | 128 |
| GO:000020920 | Thyroid | PTC | protein polyubiquitination | 128/5968 | 236/18723 | 7.81e-13 | 3.65e-11 | 128 |
| GO:0035967113 | Thyroid | PTC | cellular response to topologically incorrect protein | 73/5968 | 116/18723 | 5.62e-12 | 2.41e-10 | 73 |
| Page: 1 2 3 4 5 6 7 8 9 10 11 |
| Pathway ID | Tissue | Disease Stage | Description | Gene Ratio | Bg Ratio | pvalue | p.adjust | qvalue | Count |
| Page: 1 |
Top |
Cell-cell communication analysis |
| Identification of potential cell-cell interactions between two cell types and their ligand-receptor pairs for different disease states |
| Ligand | Receptor | LRpair | Pathway | Tissue | Disease Stage |
| Page: 1 |
Top |
Single-cell gene regulatory network inference analysis |
| Find out the significant the regulons (TFs) and the target genes of each regulon across cell types for different disease states |
| TF | Cell Type | Tissue | Disease Stage | Target Gene | RSS | Regulon Activity |
| ∗The dot plots of a searched regulon are shown for all cell subpopulations in each disease state of each tissue based on the regulon specific score inferred using pySCENIC and by calculating the average expression. |
| Page: 1 |
Top |
Somatic mutation of malignant transformation related genes |
| Annotation of somatic variants for genes involved in malignant transformation |
| Hugo Symbol | Variant Class | Variant Classification | dbSNP RS | HGVSc | HGVSp | HGVSp Short | SWISSPROT | BIOTYPE | SIFT | PolyPhen | Tumor Sample Barcode | Tissue | Histology | Sex | Age | Stage | Therapy Types | Drugs | Outcome |
| RNF126 | insertion | Frame_Shift_Ins | novel | c.792_793insGGAGTAGGGGGGCTCGGGACCATGAGGATGACCAGCAAAATTCAAGA | p.Ser265GlyfsTer40 | p.S265Gfs*40 | Q9BV68 | protein_coding | TCGA-A2-A0CP-01 | Breast | breast invasive carcinoma | Female | <65 | I/II | Chemotherapy | cytoxan | SD | ||
| RNF126 | deletion | Frame_Shift_Del | c.848delN | p.Pro283LeufsTer6 | p.P283Lfs*6 | Q9BV68 | protein_coding | TCGA-BH-A18G-01 | Breast | breast invasive carcinoma | Female | >=65 | I/II | Unknown | Unknown | SD | |||
| RNF126 | SNV | Missense_Mutation | c.835N>T | p.Ala279Ser | p.A279S | Q9BV68 | protein_coding | tolerated(0.31) | possibly_damaging(0.862) | TCGA-C5-A1BK-01 | Cervix | cervical & endocervical cancer | Female | <65 | I/II | Unknown | Unknown | SD | |
| RNF126 | SNV | Missense_Mutation | novel | c.814A>T | p.Ser272Cys | p.S272C | Q9BV68 | protein_coding | deleterious(0) | probably_damaging(0.999) | TCGA-EA-A3HU-01 | Cervix | cervical & endocervical cancer | Female | <65 | I/II | Unknown | Unknown | SD |
| RNF126 | SNV | Missense_Mutation | novel | c.341N>A | p.Arg114Lys | p.R114K | Q9BV68 | protein_coding | tolerated(0.07) | benign(0.288) | TCGA-VS-A8EK-01 | Cervix | cervical & endocervical cancer | Female | >=65 | I/II | Chemotherapy | cisplatin | PD |
| RNF126 | SNV | Missense_Mutation | c.902N>T | p.Ser301Leu | p.S301L | Q9BV68 | protein_coding | deleterious_low_confidence(0) | possibly_damaging(0.5) | TCGA-A6-5665-01 | Colorectum | colon adenocarcinoma | Female | >=65 | I/II | Unknown | Unknown | PD | |
| RNF126 | SNV | Missense_Mutation | rs751599993 | c.727C>T | p.Arg243Trp | p.R243W | Q9BV68 | protein_coding | deleterious(0) | probably_damaging(0.999) | TCGA-AD-6895-01 | Colorectum | colon adenocarcinoma | Male | >=65 | III/IV | Unknown | Unknown | SD |
| RNF126 | SNV | Missense_Mutation | c.479N>T | p.Pro160Leu | p.P160L | Q9BV68 | protein_coding | deleterious(0.01) | benign(0.104) | TCGA-CK-4951-01 | Colorectum | colon adenocarcinoma | Female | >=65 | I/II | Unknown | Unknown | PD | |
| RNF126 | deletion | Frame_Shift_Del | rs753517011 | c.159delN | p.Ser54ProfsTer170 | p.S54Pfs*170 | Q9BV68 | protein_coding | TCGA-AZ-4313-01 | Colorectum | colon adenocarcinoma | Female | <65 | I/II | Unknown | Unknown | SD | ||
| RNF126 | insertion | Frame_Shift_Ins | novel | c.801_802insC | p.Val268ArgfsTer123 | p.V268Rfs*123 | Q9BV68 | protein_coding | TCGA-EI-6507-01 | Colorectum | rectum adenocarcinoma | Male | <65 | I/II | Unknown | Unknown | SD |
| Page: 1 2 3 |
Top |
Related drugs of malignant transformation related genes |
| Identification of chemicals and drugs interact with genes involved in malignant transfromation |
| (DGIdb 4.0) |
| Entrez ID | Symbol | Category | Interaction Types | Drug Claim Name | Drug Name | PMIDs |
| Page: 1 |

Copyright 2023-Present -The University of Texas Health Science Center at Houston |