
|
|||||
|
 | |
| |
| |
| |
| |
| |
|
Gene: RAB11B |
Gene summary for RAB11B |
| Gene information | Species | Human | Gene symbol | RAB11B | Gene ID | 9230 |
| Gene name | RAB11B, member RAS oncogene family | |
| Gene Alias | H-YPT3 | |
| Cytomap | 19p13.2 | |
| Gene Type | protein-coding | GO ID | GO:0000041 | UniProtAcc | Q15907 |
Top |
Malignant transformation analysis |
| Identification of the aberrant gene expression in precancerous and cancerous lesions by comparing the gene expression of stem-like cells in diseased tissues with normal stem cells |
| Entrez ID | Symbol | Replicates | Species | Organ | Tissue | Adj P-value | Log2FC | Malignancy |
| 9230 | RAB11B | HTA11_3410_2000001011 | Human | Colorectum | AD | 6.16e-05 | 2.03e-01 | 0.0155 |
| 9230 | RAB11B | HTA11_2487_2000001011 | Human | Colorectum | SER | 2.35e-06 | 3.29e-01 | -0.1808 |
| 9230 | RAB11B | HTA11_1938_2000001011 | Human | Colorectum | AD | 2.97e-09 | 4.08e-01 | -0.0811 |
| 9230 | RAB11B | HTA11_78_2000001011 | Human | Colorectum | AD | 1.62e-04 | 2.10e-01 | -0.1088 |
| 9230 | RAB11B | HTA11_347_2000001011 | Human | Colorectum | AD | 3.49e-09 | 3.38e-01 | -0.1954 |
| 9230 | RAB11B | HTA11_411_2000001011 | Human | Colorectum | SER | 3.11e-07 | 6.37e-01 | -0.2602 |
| 9230 | RAB11B | HTA11_3361_2000001011 | Human | Colorectum | AD | 2.21e-03 | 3.28e-01 | -0.1207 |
| 9230 | RAB11B | HTA11_696_2000001011 | Human | Colorectum | AD | 1.82e-12 | 3.47e-01 | -0.1464 |
| 9230 | RAB11B | HTA11_866_2000001011 | Human | Colorectum | AD | 2.81e-06 | 2.35e-01 | -0.1001 |
| 9230 | RAB11B | HTA11_1391_2000001011 | Human | Colorectum | AD | 4.25e-17 | 5.44e-01 | -0.059 |
| 9230 | RAB11B | HTA11_2992_2000001011 | Human | Colorectum | SER | 1.05e-02 | 3.20e-01 | -0.1706 |
| 9230 | RAB11B | HTA11_5212_2000001011 | Human | Colorectum | AD | 6.33e-07 | 3.97e-01 | -0.2061 |
| 9230 | RAB11B | HTA11_5216_2000001011 | Human | Colorectum | SER | 3.42e-03 | 3.34e-01 | -0.1462 |
| 9230 | RAB11B | HTA11_866_3004761011 | Human | Colorectum | AD | 1.21e-06 | 2.49e-01 | 0.096 |
| 9230 | RAB11B | HTA11_7663_2000001011 | Human | Colorectum | SER | 2.43e-03 | 5.25e-01 | 0.0131 |
| 9230 | RAB11B | HTA11_10623_2000001011 | Human | Colorectum | AD | 3.33e-07 | 5.69e-01 | -0.0177 |
| 9230 | RAB11B | HTA11_6801_2000001011 | Human | Colorectum | SER | 2.43e-02 | 2.78e-01 | 0.0171 |
| 9230 | RAB11B | HTA11_10711_2000001011 | Human | Colorectum | AD | 1.19e-13 | 4.86e-01 | 0.0338 |
| 9230 | RAB11B | HTA11_7696_3000711011 | Human | Colorectum | AD | 1.30e-29 | 6.22e-01 | 0.0674 |
| 9230 | RAB11B | HTA11_6818_2000001021 | Human | Colorectum | AD | 1.59e-02 | 2.85e-01 | 0.0588 |
| Page: 1 2 3 4 5 6 7 8 |
| Tissue | Expression Dynamics | Abbreviation |
| Colorectum (GSE201348) |  | FAP: Familial adenomatous polyposis |
| CRC: Colorectal cancer | ||
| Colorectum (HTA11) |  | AD: Adenomas |
| SER: Sessile serrated lesions | ||
| MSI-H: Microsatellite-high colorectal cancer | ||
| MSS: Microsatellite stable colorectal cancer | ||
| Esophagus |  | ESCC: Esophageal squamous cell carcinoma |
| HGIN: High-grade intraepithelial neoplasias | ||
| LGIN: Low-grade intraepithelial neoplasias | ||
| Liver | 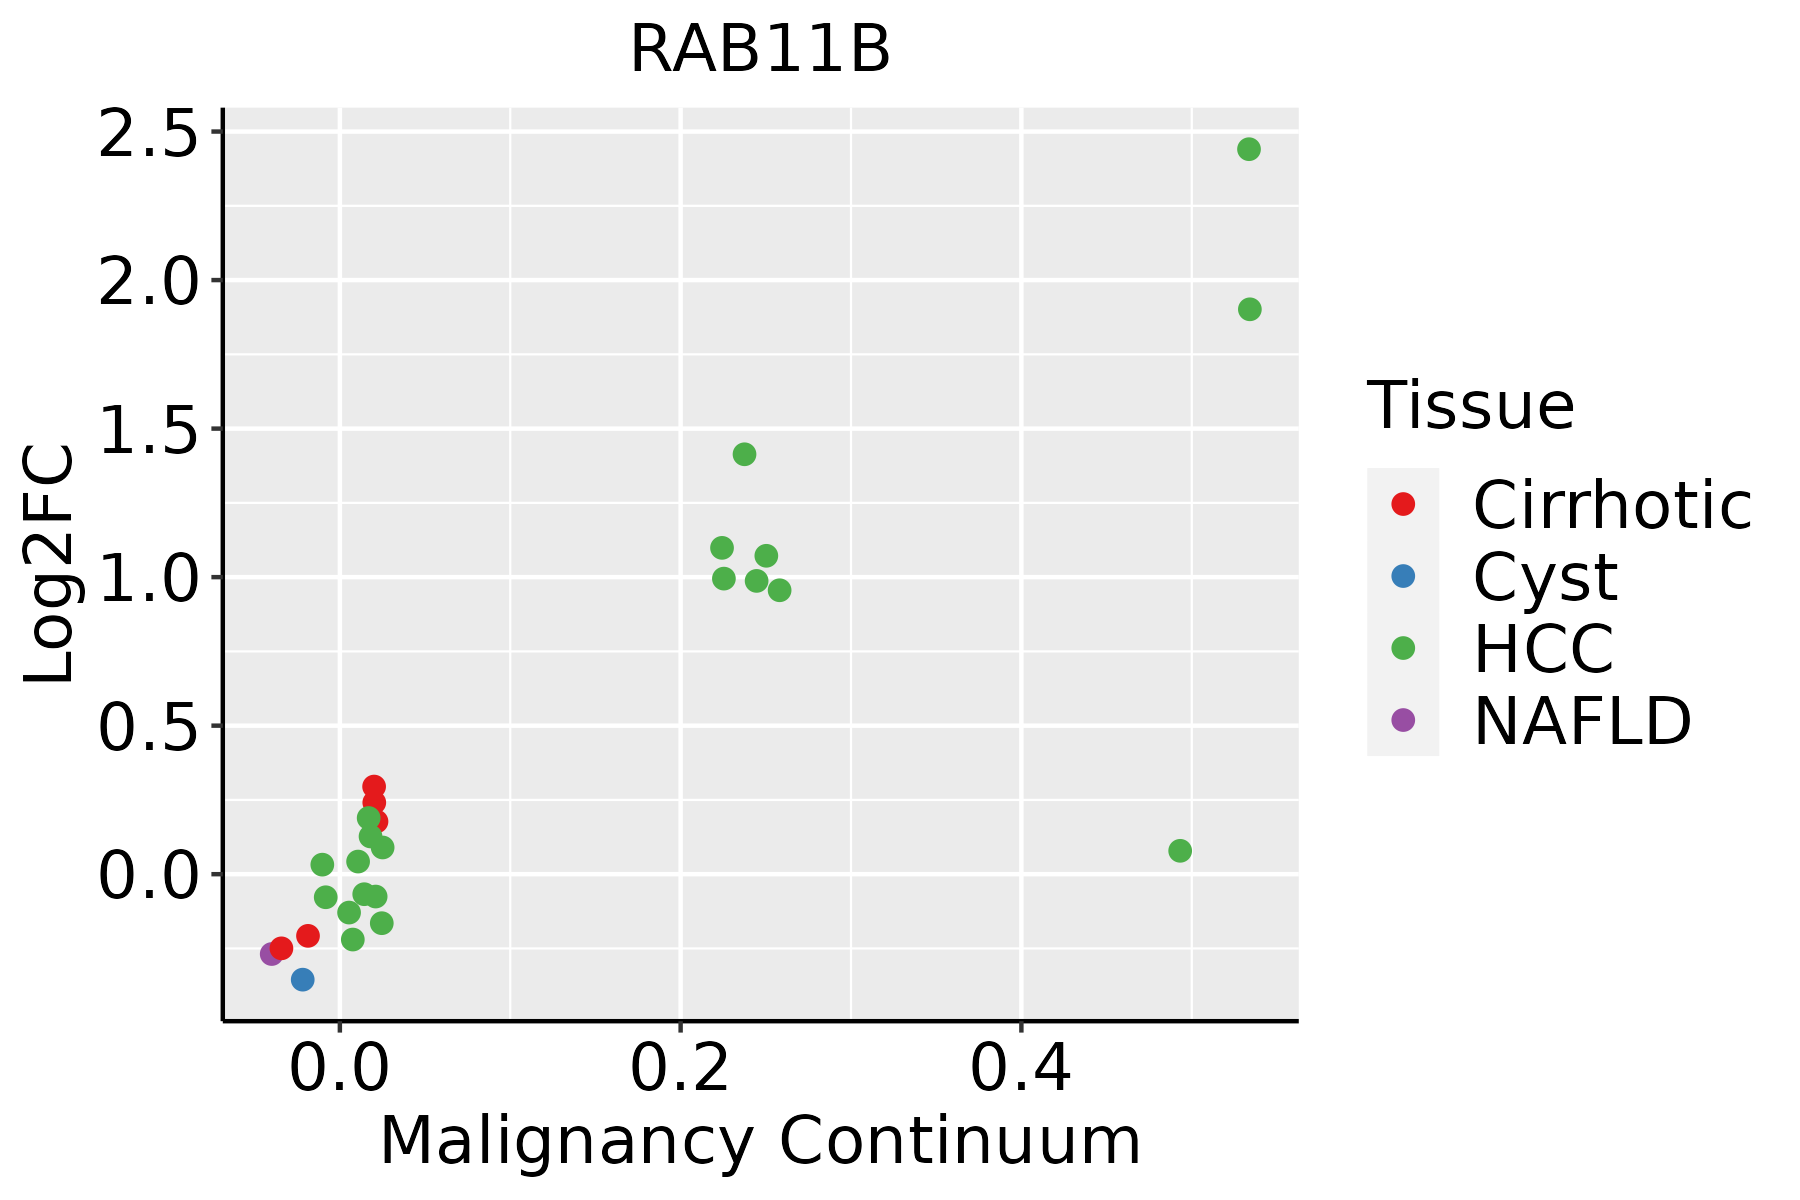 | HCC: Hepatocellular carcinoma |
| NAFLD: Non-alcoholic fatty liver disease | ||
| Oral Cavity | 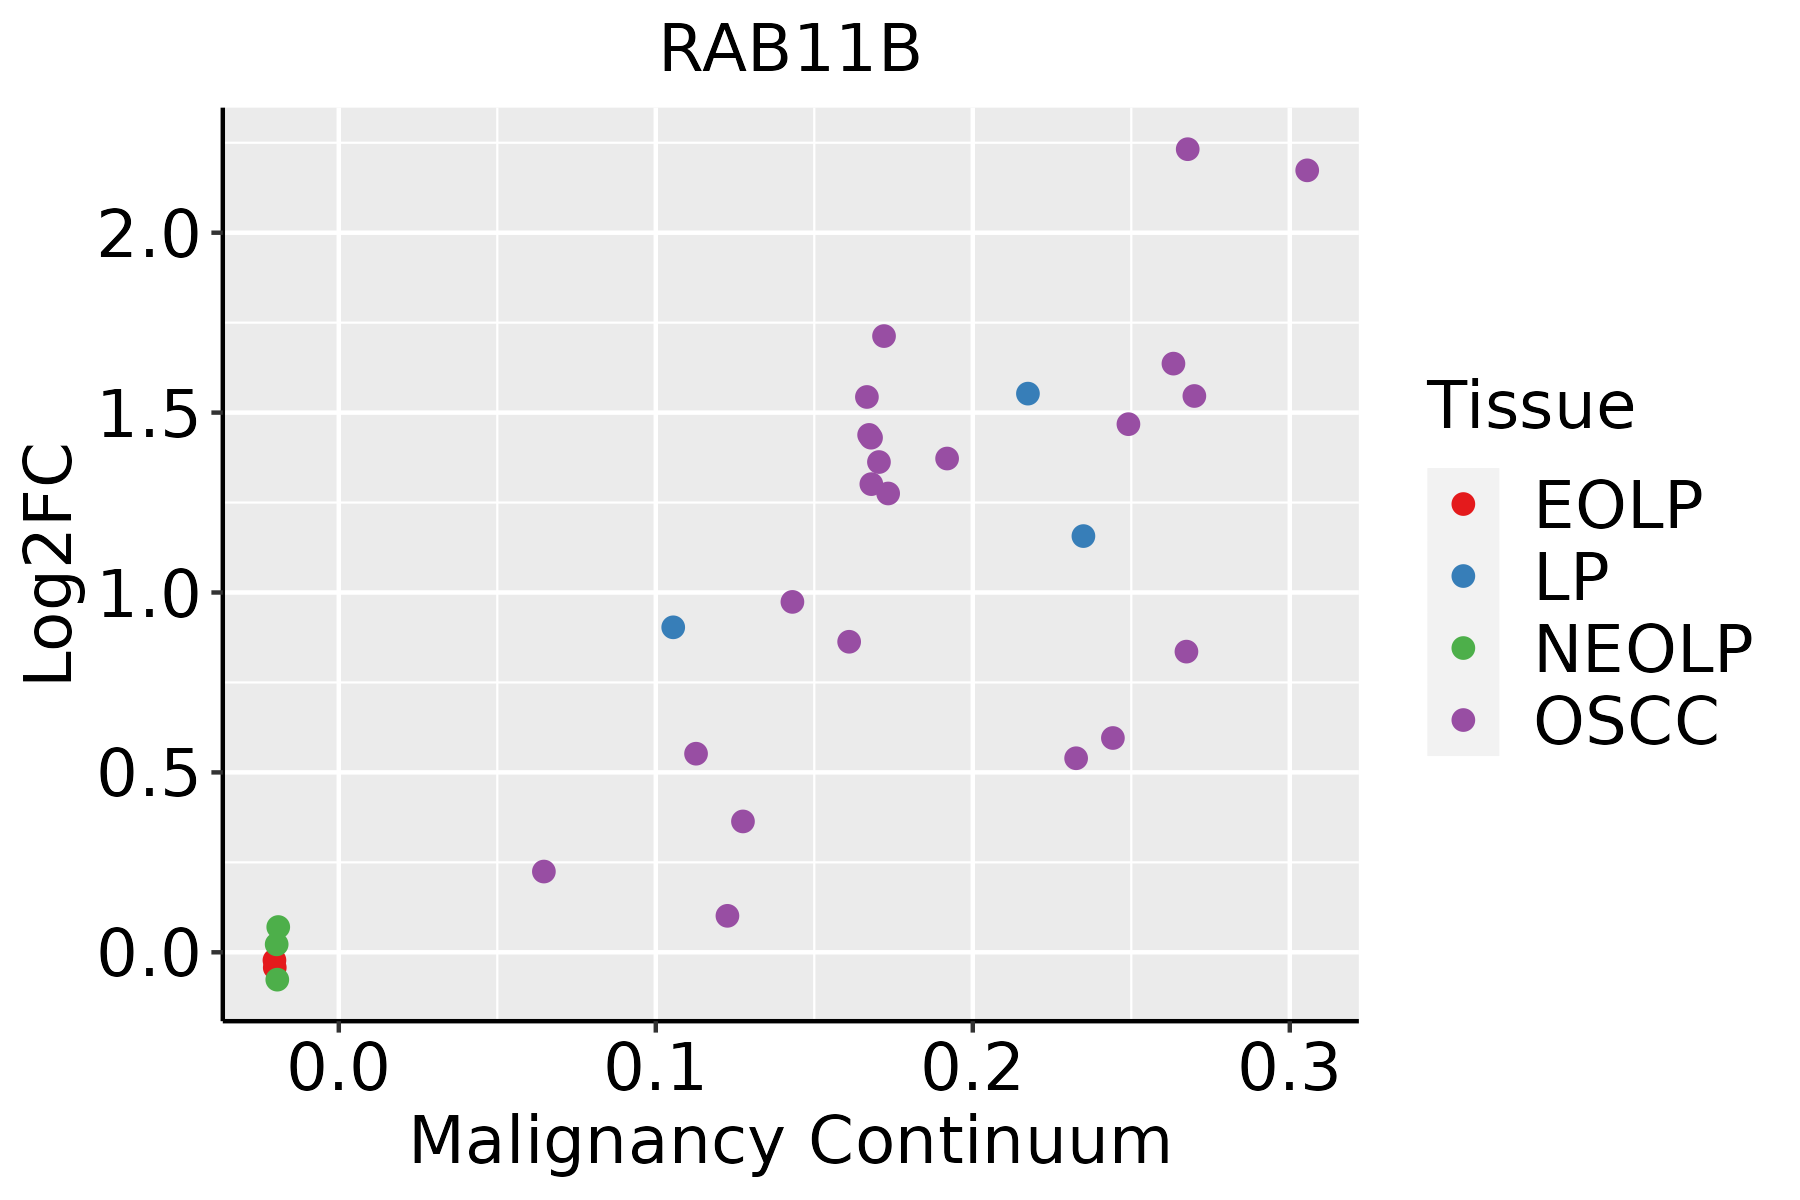 | EOLP: Erosive Oral lichen planus |
| LP: leukoplakia | ||
| NEOLP: Non-erosive oral lichen planus | ||
| OSCC: Oral squamous cell carcinoma | ||
| Skin |  | AK: Actinic keratosis |
| cSCC: Cutaneous squamous cell carcinoma | ||
| SCCIS:squamous cell carcinoma in situ | ||
| Thyroid | 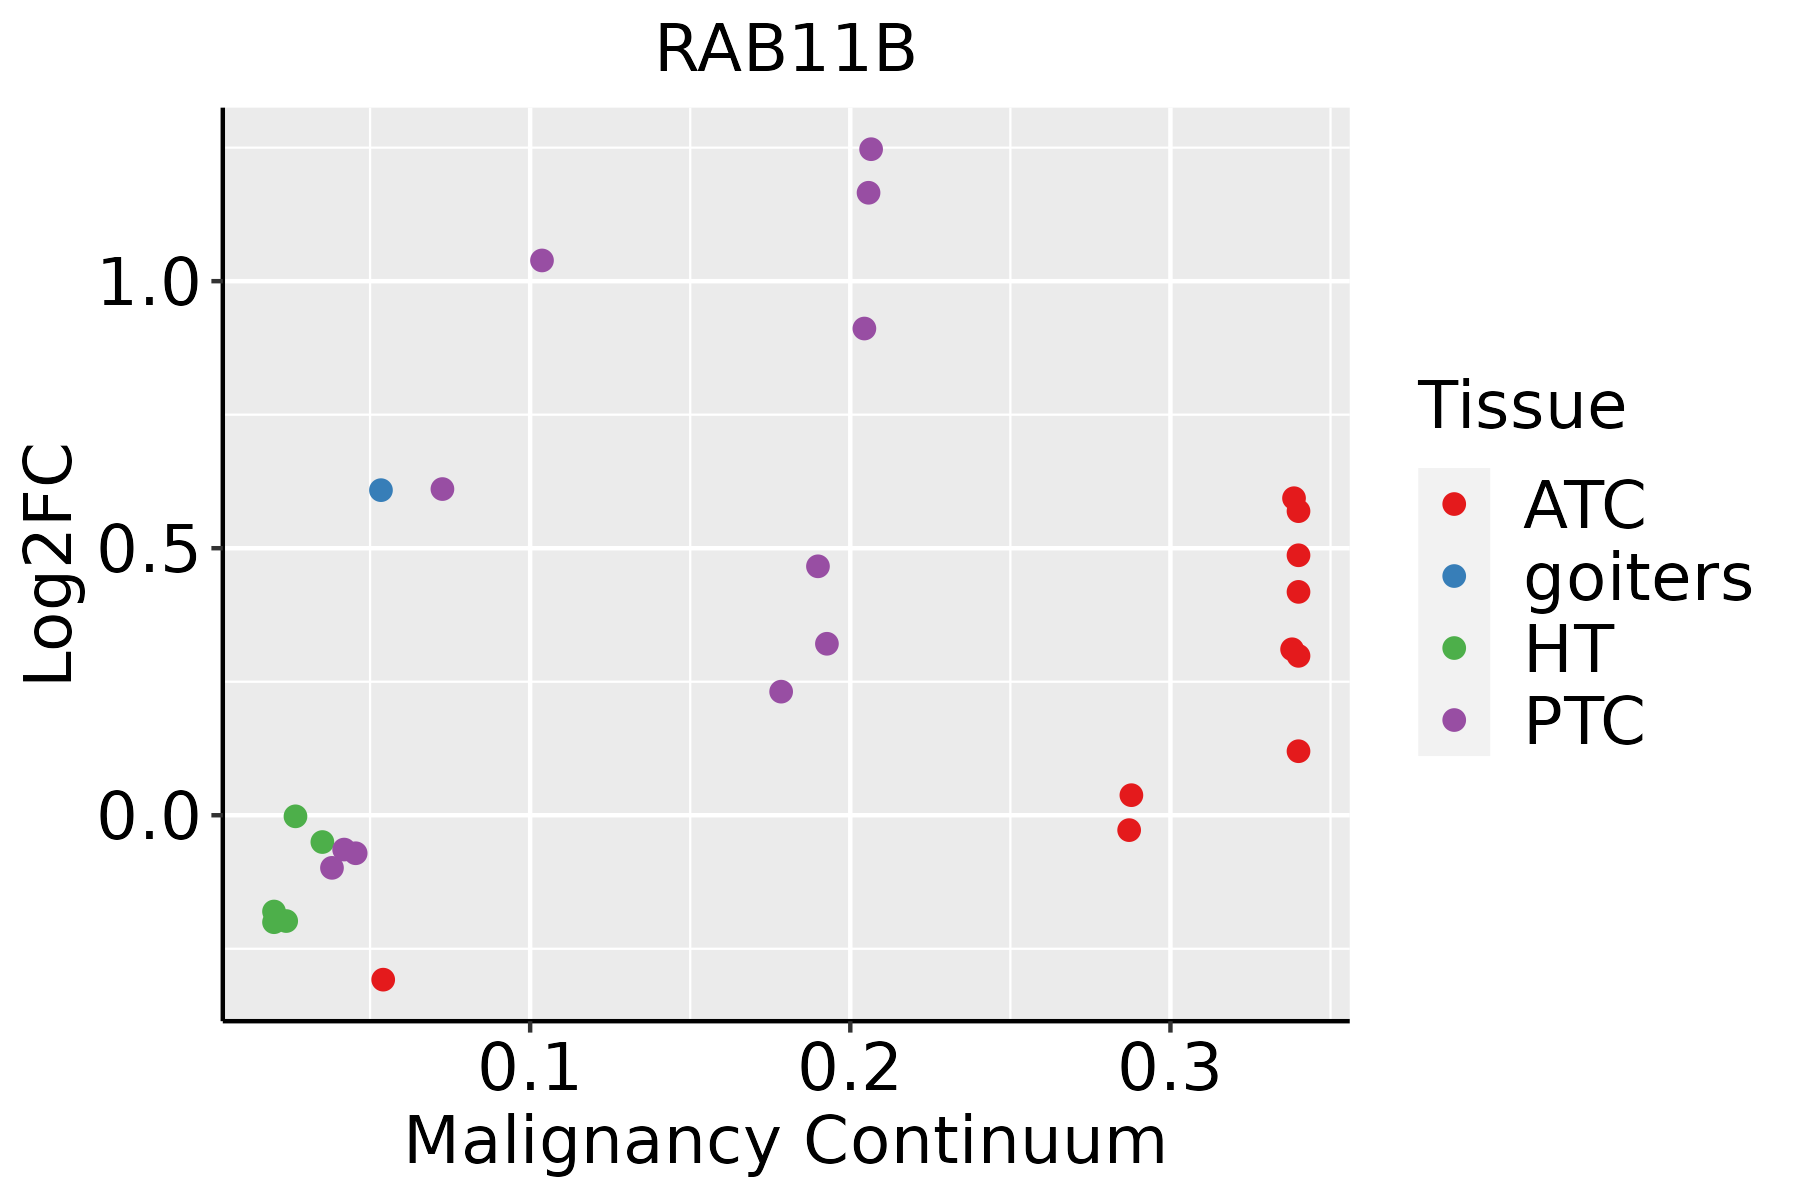 | ATC: Anaplastic thyroid cancer |
| HT: Hashimoto's thyroiditis | ||
| PTC: Papillary thyroid cancer |
| ∗log2FC in expression of this searched gene in stem-like cells from each diseased tissue sample relative to stem-like cells in normal samples in each tissue plotted against the malignancy continuum. Samples are colored based on if they are from different disease stage. |
Top |
Malignant transformation related pathway analysis |
| Find out the enriched GO biological processes and KEGG pathways involved in transition from healthy to precancer to cancer |
| Tissue | Disease Stage | Enriched GO biological Processes |
| Colorectum | AD |  |
| Colorectum | SER |  |
| Colorectum | MSS |  |
| Colorectum | MSI-H |  |
| Colorectum | FAP |  |
| ∗Top 15 enriched GO BP terms are showed in the bar plot of each disease state in each tissue. Each row represents a significant GO biological process which is colored according to the -log10(p.adjust). |
| Page: 1 2 3 4 5 6 7 8 9 |
| GO ID | Tissue | Disease Stage | Description | Gene Ratio | Bg Ratio | pvalue | p.adjust | Count |
| GO:000974912 | Liver | HCC | response to glucose | 121/7958 | 212/18723 | 1.24e-05 | 1.39e-04 | 121 |
| GO:004311221 | Liver | HCC | receptor metabolic process | 96/7958 | 166/18723 | 4.69e-05 | 4.50e-04 | 96 |
| GO:00324562 | Liver | HCC | endocytic recycling | 48/7958 | 73/18723 | 5.07e-05 | 4.83e-04 | 48 |
| GO:004259322 | Liver | HCC | glucose homeostasis | 137/7958 | 258/18723 | 3.59e-04 | 2.49e-03 | 137 |
| GO:003350022 | Liver | HCC | carbohydrate homeostasis | 137/7958 | 259/18723 | 4.45e-04 | 2.98e-03 | 137 |
| GO:000167822 | Liver | HCC | cellular glucose homeostasis | 95/7958 | 172/18723 | 4.95e-04 | 3.24e-03 | 95 |
| GO:007133112 | Liver | HCC | cellular response to hexose stimulus | 85/7958 | 153/18723 | 7.47e-04 | 4.52e-03 | 85 |
| GO:007133312 | Liver | HCC | cellular response to glucose stimulus | 84/7958 | 151/18723 | 7.57e-04 | 4.56e-03 | 84 |
| GO:007132612 | Liver | HCC | cellular response to monosaccharide stimulus | 85/7958 | 154/18723 | 9.78e-04 | 5.68e-03 | 85 |
| GO:007132212 | Liver | HCC | cellular response to carbohydrate stimulus | 89/7958 | 163/18723 | 1.19e-03 | 6.62e-03 | 89 |
| GO:003357211 | Liver | HCC | transferrin transport | 9/7958 | 10/18723 | 2.79e-03 | 1.31e-02 | 9 |
| GO:00000411 | Liver | HCC | transition metal ion transport | 59/7958 | 105/18723 | 3.18e-03 | 1.47e-02 | 59 |
| GO:00357733 | Liver | HCC | insulin secretion involved in cellular response to glucose stimulus | 42/7958 | 73/18723 | 6.78e-03 | 2.73e-02 | 42 |
| GO:004505611 | Liver | HCC | transcytosis | 15/7958 | 21/18723 | 7.03e-03 | 2.80e-02 | 15 |
| GO:003559212 | Liver | HCC | establishment of protein localization to extracellular region | 176/7958 | 360/18723 | 7.96e-03 | 3.15e-02 | 176 |
| GO:000930612 | Liver | HCC | protein secretion | 175/7958 | 359/18723 | 9.32e-03 | 3.57e-02 | 175 |
| GO:00068261 | Liver | HCC | iron ion transport | 34/7958 | 58/18723 | 9.66e-03 | 3.63e-02 | 34 |
| GO:003238615 | Oral cavity | OSCC | regulation of intracellular transport | 218/7305 | 337/18723 | 6.91e-22 | 1.41e-19 | 218 |
| GO:005165610 | Oral cavity | OSCC | establishment of organelle localization | 239/7305 | 390/18723 | 2.46e-19 | 3.31e-17 | 239 |
| GO:009015018 | Oral cavity | OSCC | establishment of protein localization to membrane | 163/7305 | 260/18723 | 7.13e-15 | 4.47e-13 | 163 |
| Page: 1 2 3 4 5 6 7 8 9 10 11 12 13 14 15 16 |
| Pathway ID | Tissue | Disease Stage | Description | Gene Ratio | Bg Ratio | pvalue | p.adjust | qvalue | Count |
| hsa04144 | Colorectum | AD | Endocytosis | 111/2092 | 251/8465 | 5.95e-12 | 1.42e-10 | 9.08e-11 | 111 |
| hsa04152 | Colorectum | AD | AMPK signaling pathway | 47/2092 | 121/8465 | 3.74e-04 | 2.82e-03 | 1.80e-03 | 47 |
| hsa04962 | Colorectum | AD | Vasopressin-regulated water reabsorption | 19/2092 | 44/8465 | 5.48e-03 | 2.48e-02 | 1.58e-02 | 19 |
| hsa041441 | Colorectum | AD | Endocytosis | 111/2092 | 251/8465 | 5.95e-12 | 1.42e-10 | 9.08e-11 | 111 |
| hsa041521 | Colorectum | AD | AMPK signaling pathway | 47/2092 | 121/8465 | 3.74e-04 | 2.82e-03 | 1.80e-03 | 47 |
| hsa049621 | Colorectum | AD | Vasopressin-regulated water reabsorption | 19/2092 | 44/8465 | 5.48e-03 | 2.48e-02 | 1.58e-02 | 19 |
| hsa041442 | Colorectum | SER | Endocytosis | 81/1580 | 251/8465 | 1.14e-07 | 2.36e-06 | 1.71e-06 | 81 |
| hsa041443 | Colorectum | SER | Endocytosis | 81/1580 | 251/8465 | 1.14e-07 | 2.36e-06 | 1.71e-06 | 81 |
| hsa041444 | Colorectum | MSS | Endocytosis | 102/1875 | 251/8465 | 1.85e-11 | 4.43e-10 | 2.71e-10 | 102 |
| hsa041522 | Colorectum | MSS | AMPK signaling pathway | 41/1875 | 121/8465 | 1.91e-03 | 9.83e-03 | 6.03e-03 | 41 |
| hsa049622 | Colorectum | MSS | Vasopressin-regulated water reabsorption | 17/1875 | 44/8465 | 9.76e-03 | 3.55e-02 | 2.18e-02 | 17 |
| hsa041445 | Colorectum | MSS | Endocytosis | 102/1875 | 251/8465 | 1.85e-11 | 4.43e-10 | 2.71e-10 | 102 |
| hsa041523 | Colorectum | MSS | AMPK signaling pathway | 41/1875 | 121/8465 | 1.91e-03 | 9.83e-03 | 6.03e-03 | 41 |
| hsa049623 | Colorectum | MSS | Vasopressin-regulated water reabsorption | 17/1875 | 44/8465 | 9.76e-03 | 3.55e-02 | 2.18e-02 | 17 |
| hsa0414429 | Esophagus | HGIN | Endocytosis | 76/1383 | 251/8465 | 1.74e-08 | 3.34e-07 | 2.65e-07 | 76 |
| hsa0516420 | Esophagus | HGIN | Influenza A | 42/1383 | 171/8465 | 3.41e-03 | 2.54e-02 | 2.02e-02 | 42 |
| hsa049627 | Esophagus | HGIN | Vasopressin-regulated water reabsorption | 14/1383 | 44/8465 | 8.21e-03 | 4.71e-02 | 3.74e-02 | 14 |
| hsa04144113 | Esophagus | HGIN | Endocytosis | 76/1383 | 251/8465 | 1.74e-08 | 3.34e-07 | 2.65e-07 | 76 |
| hsa05164110 | Esophagus | HGIN | Influenza A | 42/1383 | 171/8465 | 3.41e-03 | 2.54e-02 | 2.02e-02 | 42 |
| hsa0496214 | Esophagus | HGIN | Vasopressin-regulated water reabsorption | 14/1383 | 44/8465 | 8.21e-03 | 4.71e-02 | 3.74e-02 | 14 |
| Page: 1 2 3 |
Top |
Cell-cell communication analysis |
| Identification of potential cell-cell interactions between two cell types and their ligand-receptor pairs for different disease states |
| Ligand | Receptor | LRpair | Pathway | Tissue | Disease Stage |
| Page: 1 |
Top |
Single-cell gene regulatory network inference analysis |
| Find out the significant the regulons (TFs) and the target genes of each regulon across cell types for different disease states |
| TF | Cell Type | Tissue | Disease Stage | Target Gene | RSS | Regulon Activity |
| ∗The dot plots of a searched regulon are shown for all cell subpopulations in each disease state of each tissue based on the regulon specific score inferred using pySCENIC and by calculating the average expression. |
| Page: 1 |
Top |
Somatic mutation of malignant transformation related genes |
| Annotation of somatic variants for genes involved in malignant transformation |
| Hugo Symbol | Variant Class | Variant Classification | dbSNP RS | HGVSc | HGVSp | HGVSp Short | SWISSPROT | BIOTYPE | SIFT | PolyPhen | Tumor Sample Barcode | Tissue | Histology | Sex | Age | Stage | Therapy Types | Drugs | Outcome |
| RAB11B | SNV | Missense_Mutation | novel | c.152G>A | p.Arg51His | p.R51H | Q15907 | protein_coding | deleterious_low_confidence(0) | probably_damaging(0.982) | TCGA-IR-A3L7-01 | Cervix | cervical & endocervical cancer | Female | <65 | I/II | Chemotherapy | cisplatin | CR |
| RAB11B | SNV | Missense_Mutation | c.136N>A | p.Val46Met | p.V46M | Q15907 | protein_coding | deleterious_low_confidence(0.02) | probably_damaging(0.984) | TCGA-AA-3664-01 | Colorectum | colon adenocarcinoma | Female | >=65 | I/II | Unknown | Unknown | SD | |
| RAB11B | SNV | Missense_Mutation | novel | c.142T>G | p.Phe48Val | p.F48V | Q15907 | protein_coding | deleterious_low_confidence(0) | probably_damaging(0.997) | TCGA-AA-A010-01 | Colorectum | colon adenocarcinoma | Female | <65 | I/II | Chemotherapy | folinic | CR |
| RAB11B | SNV | Missense_Mutation | c.245N>A | p.Arg82His | p.R82H | Q15907 | protein_coding | deleterious_low_confidence(0) | possibly_damaging(0.83) | TCGA-D5-6928-01 | Colorectum | colon adenocarcinoma | Male | >=65 | I/II | Unknown | Unknown | SD | |
| RAB11B | SNV | Missense_Mutation | c.382N>A | p.Leu128Met | p.L128M | Q15907 | protein_coding | deleterious_low_confidence(0) | probably_damaging(0.991) | TCGA-G4-6302-01 | Colorectum | colon adenocarcinoma | Female | >=65 | I/II | Unknown | Unknown | SD | |
| RAB11B | SNV | Missense_Mutation | novel | c.422C>T | p.Ala141Val | p.A141V | Q15907 | protein_coding | tolerated_low_confidence(0.06) | benign(0.014) | TCGA-AP-A1DK-01 | Endometrium | uterine corpus endometrioid carcinoma | Female | <65 | I/II | Unknown | Unknown | SD |
| RAB11B | SNV | Missense_Mutation | c.98N>A | p.Arg33His | p.R33H | Q15907 | protein_coding | deleterious_low_confidence(0.02) | possibly_damaging(0.559) | TCGA-AP-A1DV-01 | Endometrium | uterine corpus endometrioid carcinoma | Female | <65 | I/II | Unknown | Unknown | SD | |
| RAB11B | SNV | Missense_Mutation | rs747366868 | c.418C>T | p.Arg140Cys | p.R140C | Q15907 | protein_coding | deleterious_low_confidence(0.02) | benign(0.02) | TCGA-B5-A3FC-01 | Endometrium | uterine corpus endometrioid carcinoma | Female | <65 | I/II | Unknown | Unknown | SD |
| RAB11B | SNV | Missense_Mutation | rs377033835 | c.611C>T | p.Thr204Met | p.T204M | Q15907 | protein_coding | tolerated_low_confidence(0.08) | benign(0.018) | TCGA-EO-A22U-01 | Endometrium | uterine corpus endometrioid carcinoma | Female | >=65 | I/II | Unknown | Unknown | SD |
| RAB11B | SNV | Missense_Mutation | novel | c.435N>T | p.Lys145Asn | p.K145N | Q15907 | protein_coding | tolerated_low_confidence(0.06) | benign(0.03) | TCGA-EO-A3B0-01 | Endometrium | uterine corpus endometrioid carcinoma | Female | <65 | III/IV | Unknown | Unknown | SD |
| Page: 1 2 |
Top |
Related drugs of malignant transformation related genes |
| Identification of chemicals and drugs interact with genes involved in malignant transfromation |
| (DGIdb 4.0) |
| Entrez ID | Symbol | Category | Interaction Types | Drug Claim Name | Drug Name | PMIDs |
| Page: 1 |

Copyright 2023-Present -The University of Texas Health Science Center at Houston |