Schematic overview of the cellular and molecular mechanisms involved in the cancer progression, including the proposed cellular and molecular mechanisms in cancer cells trajectory. AT1: alveolar type 1 cells; AT2: alveolar type 2 cells; AAH: atypical adenomatous hyperplasia; AIS: adenocarcinoma in situ; MIA: minimally invasive adenocarcinoma; IA: invasive adenocarcinoma; EMT: epithelial-mesenchymal transition

Home

Download

Statistics

Help

Contact

Center for Computational Systems Medicine
leaf

Gene summary

leaf

Malignant transformation analysis

leaf

Malignant transformation related pathway analysis

leaf

Cell-cell communication analysis

leaf

Single-cell gene regulatory network inference analysis

leaf

Somatic mutation of malignant transformation related genes

leaf

Related drugs of malignant transformation related genes

Gene: PTK7

Gene summary for PTK7

check button Gene summary.

Gene informationSpeciesHuman
Gene symbol

PTK7

Gene ID

5754

Gene nameprotein tyrosine kinase 7 (inactive)
Gene AliasCCK-4
Cytomap6p21.1
Gene Typeprotein-coding
GO ID

GO:0001568

UniProtAcc

Q13308


Top

Malignant transformation analysis

check button Identification of the aberrant gene expression in precancerous and cancerous lesions by comparing the gene expression of stem-like cells in diseased tissues with normal stem cells
check button Malignant transformation involving gene list.
Entrez IDSymbolReplicatesSpeciesOrganTissueAdj P-valueLog2FCMalignancy
5754PTK7HTA11_866_3004761011HumanColorectumAD1.95e-125.01e-010.096
5754PTK7HTA11_10711_2000001011HumanColorectumAD3.46e-106.96e-010.0338
5754PTK7HTA11_7696_3000711011HumanColorectumAD1.70e-084.01e-010.0674
5754PTK7HTA11_6818_2000001011HumanColorectumAD9.87e-033.85e-010.0112
5754PTK7HTA11_99999970781_79442HumanColorectumMSS2.30e-195.07e-010.294
5754PTK7HTA11_99999965104_69814HumanColorectumMSS2.24e-054.49e-010.281
5754PTK7HTA11_99999971662_82457HumanColorectumMSS6.66e-146.28e-010.3859
5754PTK7HTA11_99999973899_84307HumanColorectumMSS4.77e-138.53e-010.2585
5754PTK7HTA11_99999974143_84620HumanColorectumMSS7.98e-421.06e+000.3005
5754PTK7A001-C-119HumanColorectumFAP1.22e-045.10e-01-0.1557
5754PTK7A002-C-021HumanColorectumFAP1.89e-084.21e-010.1171
5754PTK7CRC-1-8810HumanColorectumCRC1.98e-187.38e-010.6257
5754PTK7CRC-3-11773HumanColorectumCRC2.12e-064.57e-010.2564
5754PTK7LZE2THumanEsophagusESCC1.19e-091.22e+000.082
5754PTK7LZE4THumanEsophagusESCC7.51e-051.34e-010.0811
5754PTK7LZE24THumanEsophagusESCC1.24e-071.29e-010.0596
5754PTK7P2T-EHumanEsophagusESCC4.73e-569.05e-010.1177
5754PTK7P4T-EHumanEsophagusESCC6.75e-326.55e-010.1323
5754PTK7P5T-EHumanEsophagusESCC6.87e-255.13e-010.1327
5754PTK7P8T-EHumanEsophagusESCC2.65e-132.29e-010.0889
Page: 1 2 3 4 5 6 

check button Transcriptomic changes along malignancy continuum.
TissueExpression DynamicsAbbreviation
Colorectum (GSE201348)The image shows the transcriptomic changes along malignancy continuum.log2FC in expression of this searched gene in stem-like cells from each diseased tissue sample relative to stem-like cells in normal samples in each tissue plotted against the malignancy continuum. Samples are colored based on if they are from different disease stage.FAP: Familial adenomatous polyposis
CRC: Colorectal cancer
Colorectum (HTA11)The image shows the transcriptomic changes along malignancy continuum.log2FC in expression of this searched gene in stem-like cells from each diseased tissue sample relative to stem-like cells in normal samples in each tissue plotted against the malignancy continuum. Samples are colored based on if they are from different disease stage.AD: Adenomas
SER: Sessile serrated lesions
MSI-H: Microsatellite-high colorectal cancer
MSS: Microsatellite stable colorectal cancer
EsophagusThe image shows the transcriptomic changes along malignancy continuum.log2FC in expression of this searched gene in stem-like cells from each diseased tissue sample relative to stem-like cells in normal samples in each tissue plotted against the malignancy continuum. Samples are colored based on if they are from different disease stage.
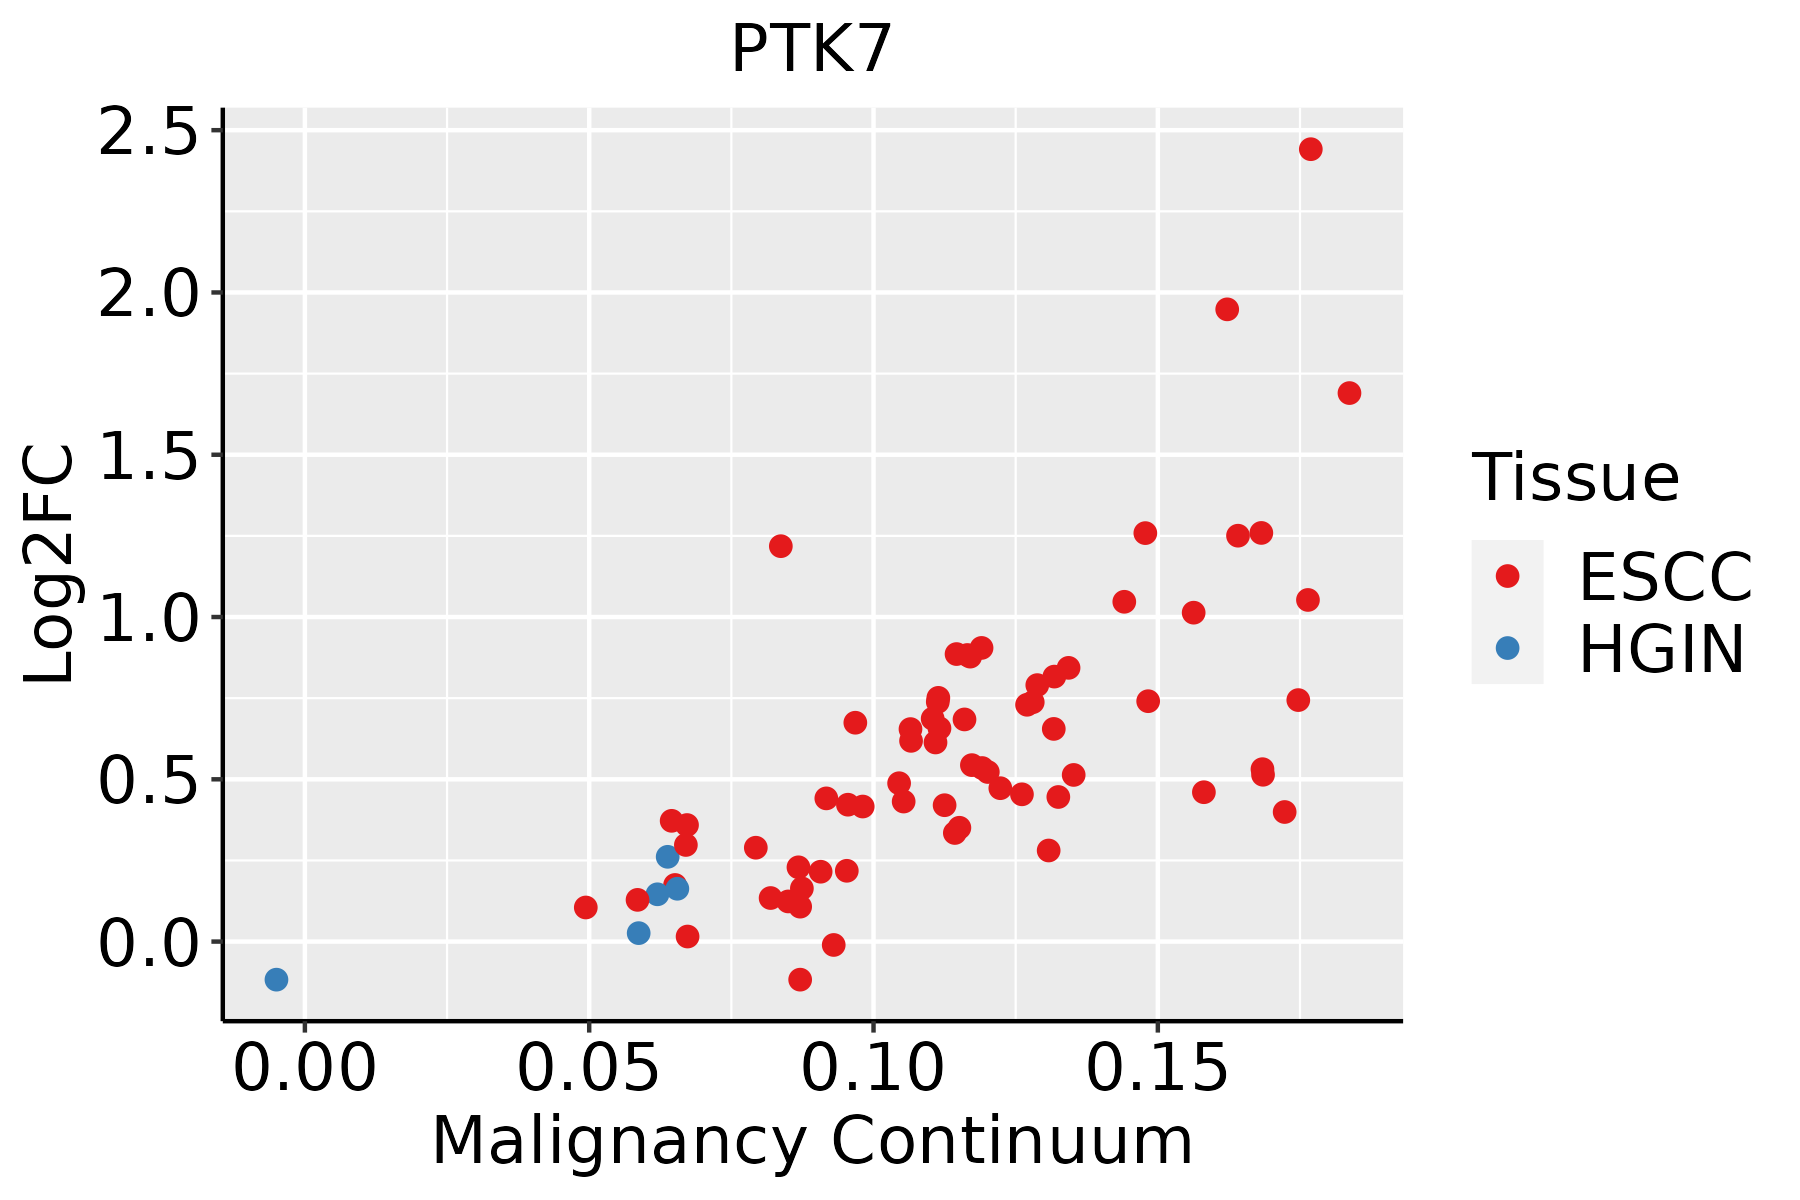
ESCC: Esophageal squamous cell carcinoma
HGIN: High-grade intraepithelial neoplasias
LGIN: Low-grade intraepithelial neoplasias
LungThe image shows the transcriptomic changes along malignancy continuum.log2FC in expression of this searched gene in stem-like cells from each diseased tissue sample relative to stem-like cells in normal samples in each tissue plotted against the malignancy continuum. Samples are colored based on if they are from different disease stage.AAH: Atypical adenomatous hyperplasia
AIS: Adenocarcinoma in situ
IAC: Invasive lung adenocarcinoma
MIA: Minimally invasive adenocarcinoma
Oral CavityThe image shows the transcriptomic changes along malignancy continuum.log2FC in expression of this searched gene in stem-like cells from each diseased tissue sample relative to stem-like cells in normal samples in each tissue plotted against the malignancy continuum. Samples are colored based on if they are from different disease stage.
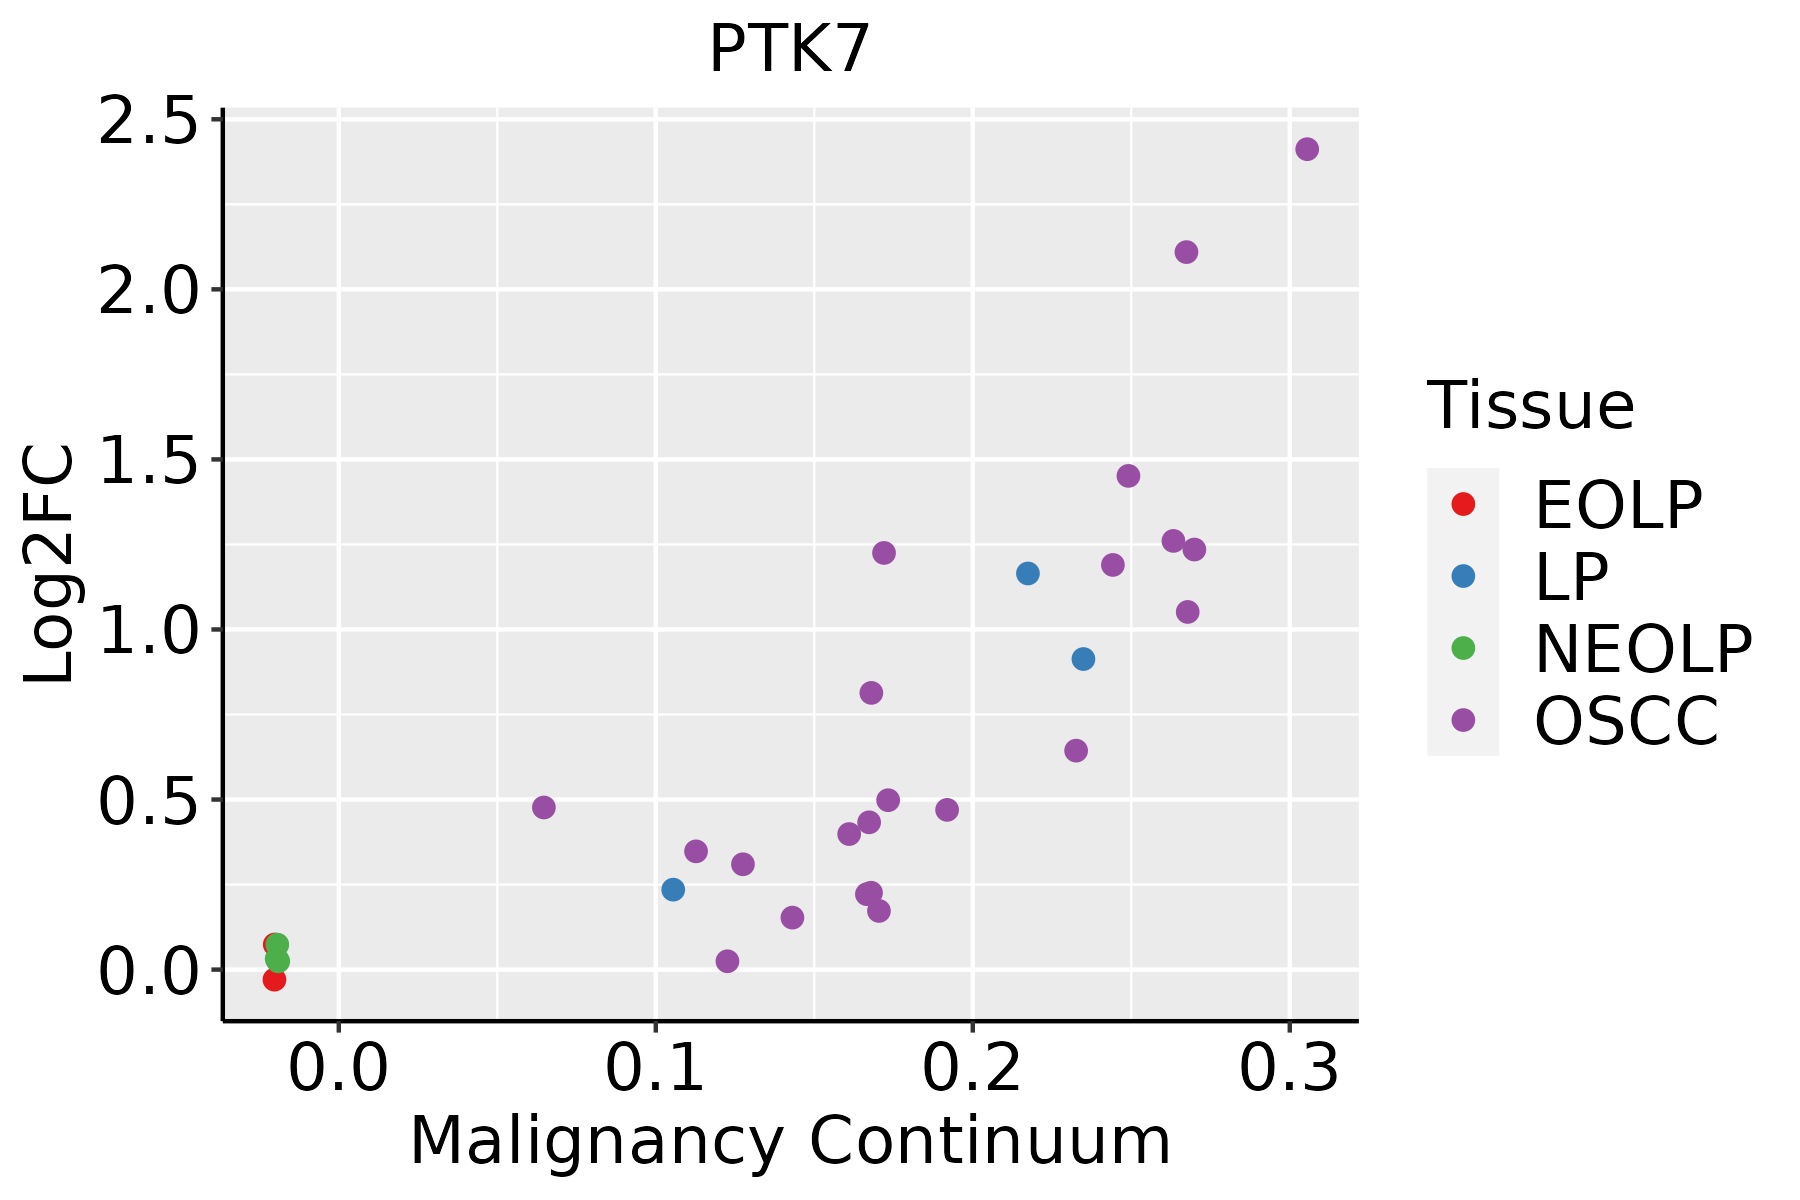
EOLP: Erosive Oral lichen planus
LP: leukoplakia
NEOLP: Non-erosive oral lichen planus
OSCC: Oral squamous cell carcinoma
SkinThe image shows the transcriptomic changes along malignancy continuum.log2FC in expression of this searched gene in stem-like cells from each diseased tissue sample relative to stem-like cells in normal samples in each tissue plotted against the malignancy continuum. Samples are colored based on if they are from different disease stage.
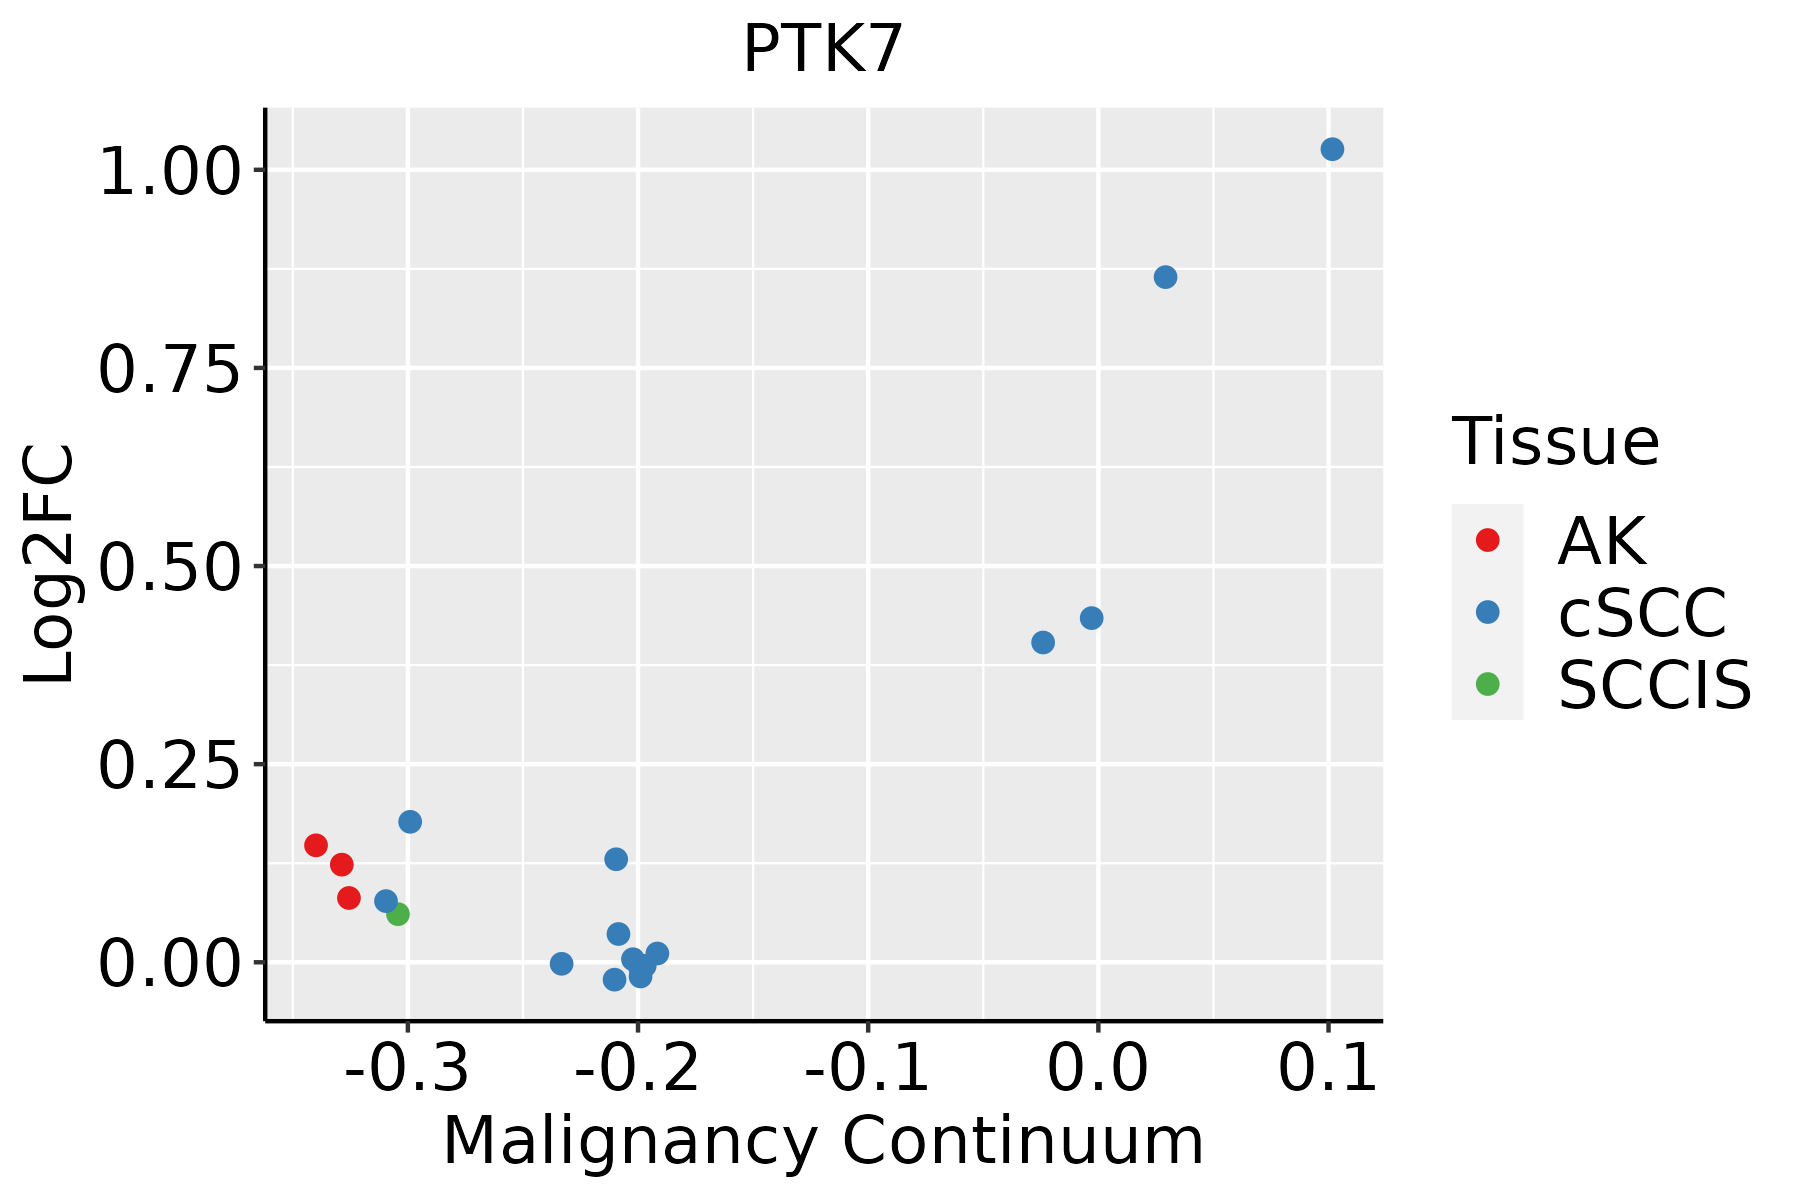
AK: Actinic keratosis
cSCC: Cutaneous squamous cell carcinoma
SCCIS:squamous cell carcinoma in situ
ThyroidThe image shows the transcriptomic changes along malignancy continuum.log2FC in expression of this searched gene in stem-like cells from each diseased tissue sample relative to stem-like cells in normal samples in each tissue plotted against the malignancy continuum. Samples are colored based on if they are from different disease stage.
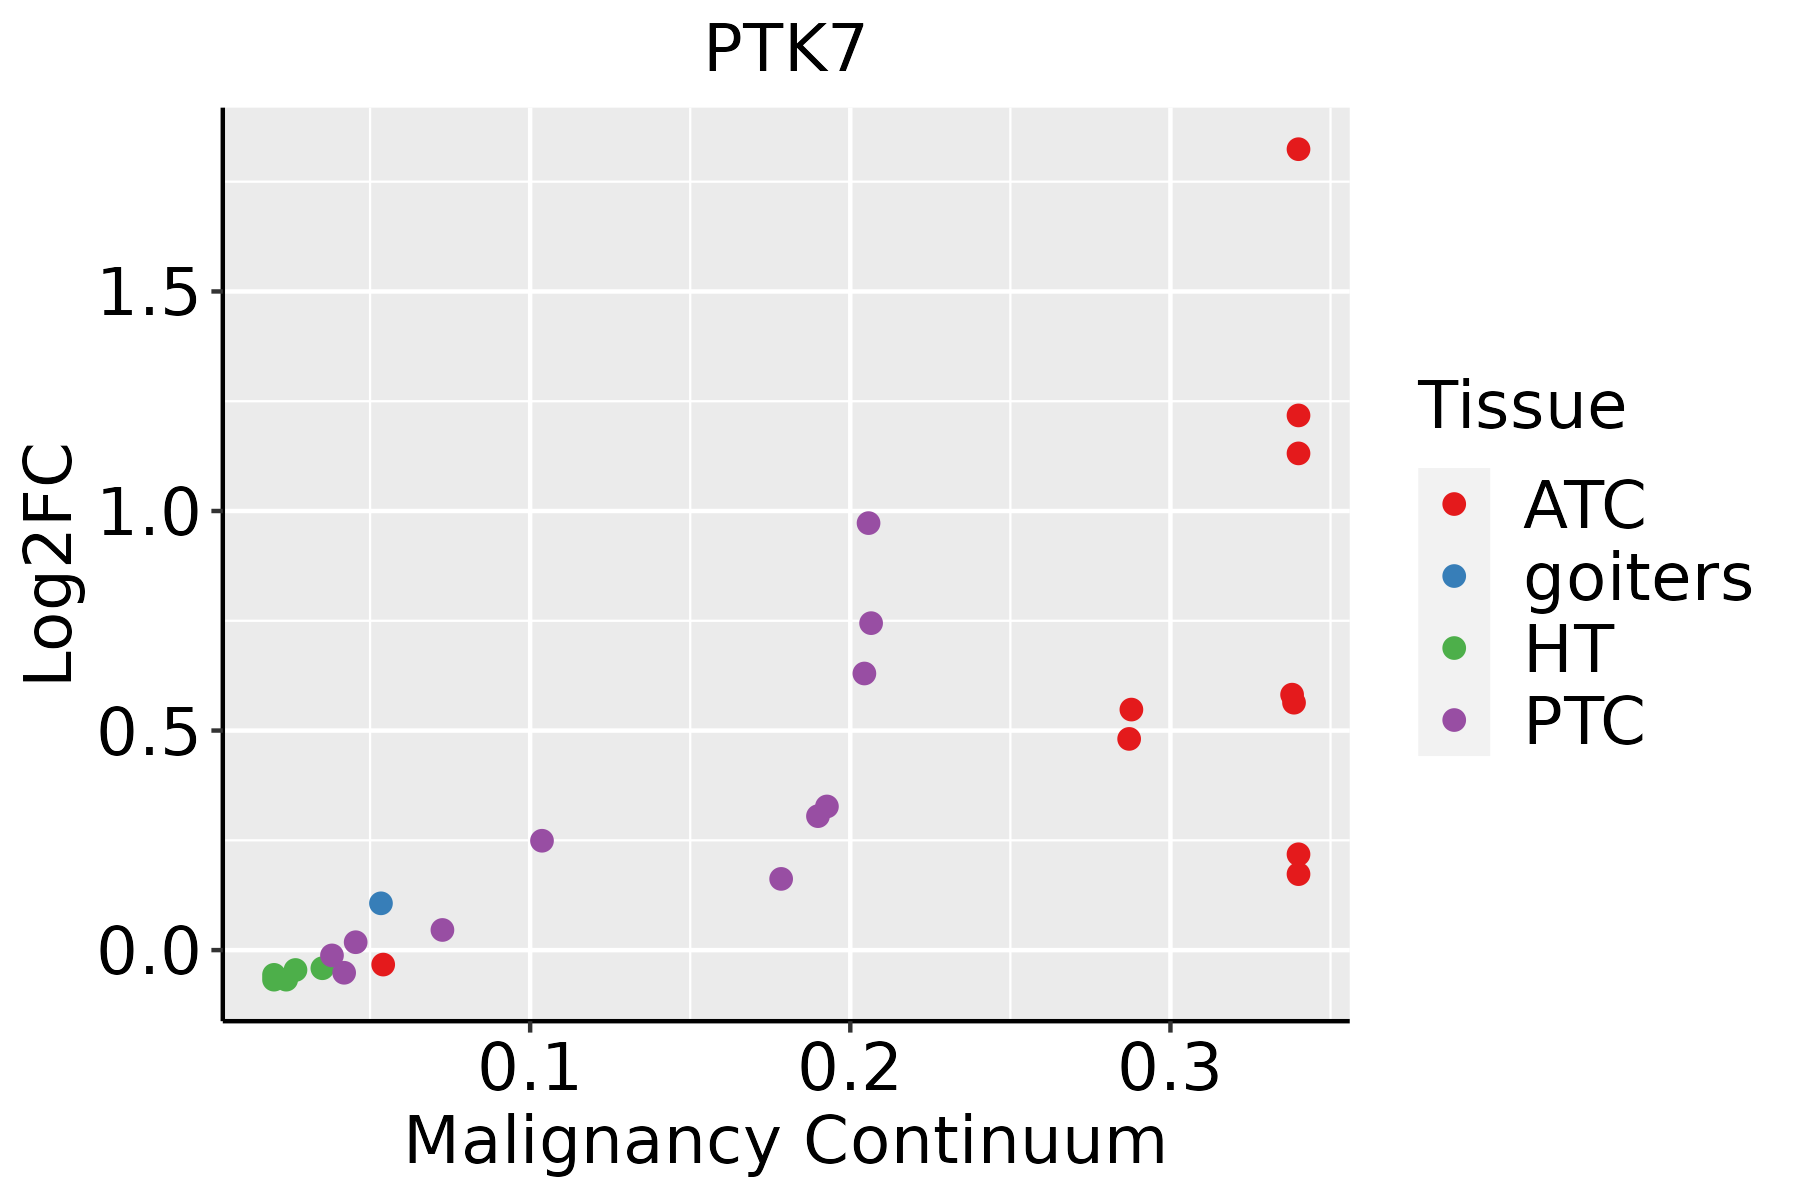
ATC: Anaplastic thyroid cancer
HT: Hashimoto's thyroiditis
PTC: Papillary thyroid cancer
∗log2FC in expression of this searched gene in stem-like cells from each diseased tissue sample relative to stem-like cells in normal samples in each tissue plotted against the malignancy continuum. Samples are colored based on if they are from different disease stage.

Top

Malignant transformation related pathway analysis

check buttonFind out the enriched GO biological processes and KEGG pathways involved in transition from healthy to precancer to cancer
check button Figure of enriched GO biological processes.
TissueDisease StageEnriched GO biological Processes
ColorectumADGO analysis - Figure of enriched GO biological processes: Top 15 enriched GO BP terms are showed in the bar plot of each disease state in each tissue. Each row represents a significant GO biological process which is colored according to the -log10(p.adjust).
ColorectumSERGO analysis - Figure of enriched GO biological processes: Top 15 enriched GO BP terms are showed in the bar plot of each disease state in each tissue. Each row represents a significant GO biological process which is colored according to the -log10(p.adjust).
ColorectumMSSGO analysis - Figure of enriched GO biological processes: Top 15 enriched GO BP terms are showed in the bar plot of each disease state in each tissue. Each row represents a significant GO biological process which is colored according to the -log10(p.adjust).
ColorectumMSI-HGO analysis - Figure of enriched GO biological processes: Top 15 enriched GO BP terms are showed in the bar plot of each disease state in each tissue. Each row represents a significant GO biological process which is colored according to the -log10(p.adjust).
ColorectumFAPGO analysis - Figure of enriched GO biological processes: Top 15 enriched GO BP terms are showed in the bar plot of each disease state in each tissue. Each row represents a significant GO biological process which is colored according to the -log10(p.adjust).
∗Top 15 enriched GO BP terms are showed in the bar plot of each disease state in each tissue. Each row represents a significant GO biological process which is colored according to the -log10(p.adjust).
Page: 1 2 3 4 5 6 7 8 9 

check button Enriched GO biological processes.
GO IDTissueDisease StageDescriptionGene RatioBg Ratiopvaluep.adjustCount
GO:00303249EsophagusESCClung development109/8552177/187231.40e-051.27e-04109
GO:00017387EsophagusESCCmorphogenesis of a polarized epithelium63/855294/187232.34e-052.00e-0463
GO:009026316EsophagusESCCpositive regulation of canonical Wnt signaling pathway69/8552106/187234.22e-053.39e-0469
GO:003017716EsophagusESCCpositive regulation of Wnt signaling pathway87/8552140/187236.18e-054.73e-0487
GO:009016216EsophagusESCCestablishment of epithelial cell polarity25/855231/187237.13e-055.38e-0425
GO:00308595EsophagusESCCpolarized epithelial cell differentiation20/855224/187231.69e-041.11e-0320
GO:00611625EsophagusESCCestablishment of monopolar cell polarity20/855224/187231.69e-041.11e-0320
GO:001097516EsophagusESCCregulation of neuron projection development240/8552445/187232.48e-041.53e-03240
GO:00613394EsophagusESCCestablishment or maintenance of monopolar cell polarity20/855225/187234.81e-042.69e-0320
GO:00600714EsophagusESCCWnt signaling pathway, planar cell polarity pathway36/855252/187235.05e-042.79e-0336
GO:00350893EsophagusESCCestablishment of apical/basal cell polarity18/855222/187235.69e-043.10e-0318
GO:00485687EsophagusESCCembryonic organ development228/8552427/187237.28e-043.79e-03228
GO:006056010EsophagusESCCdevelopmental growth involved in morphogenesis131/8552234/187239.28e-044.73e-03131
GO:00901753EsophagusESCCregulation of establishment of planar polarity37/855256/187231.65e-037.65e-0337
GO:0045198EsophagusESCCestablishment of epithelial cell apical/basal polarity14/855217/187232.22e-039.78e-0314
GO:00017361EsophagusESCCestablishment of planar polarity45/855272/187232.97e-031.24e-0245
GO:00071641EsophagusESCCestablishment of tissue polarity45/855272/187232.97e-031.24e-0245
GO:00355671EsophagusESCCnon-canonical Wnt signaling pathway45/855272/187232.97e-031.24e-0245
GO:00604856EsophagusESCCmesenchyme development156/8552291/187233.76e-031.53e-02156
GO:00325261EsophagusESCCresponse to retinoic acid63/8552107/187234.05e-031.62e-0263
Page: 1 2 3 4 5 6 7 8 9 10 11 12 13 14 15 16 17 18 19 20 21 22 

check button Enriched KEGG pathways.
Pathway IDTissueDisease StageDescriptionGene RatioBg Ratiopvaluep.adjustqvalueCount
Page: 1 

Top

Cell-cell communication analysis

check buttonIdentification of potential cell-cell interactions between two cell types and their ligand-receptor pairs for different disease states
LigandReceptorLRpairPathwayTissueDisease Stage
Page: 1 

Top

Single-cell gene regulatory network inference analysis

check buttonFind out the significant the regulons (TFs) and the target genes of each regulon across cell types for different disease states
TFCell TypeTissueDisease StageTarget GeneRSSRegulon Activity
∗The dot plots of a searched regulon are shown for all cell subpopulations in each disease state of each tissue based on the regulon specific score inferred using pySCENIC and by calculating the average expression.
Page: 1 

Top

Somatic mutation of malignant transformation related genes

check buttonAnnotation of somatic variants for genes involved in malignant transformation
Hugo SymbolVariant ClassVariant ClassificationdbSNP RSHGVScHGVSpHGVSp ShortSWISSPROTBIOTYPESIFTPolyPhenTumor Sample BarcodeTissueHistologySexAgeStageTherapy TypesDrugsOutcome
PTK7SNVMissense_Mutationc.1028C>Ap.Ala343Aspp.A343DQ13308protein_codingdeleterious(0.01)possibly_damaging(0.471)TCGA-A2-A0D2-01Breastbreast invasive carcinomaFemale<65I/IIChemotherapyadriamycinSD
PTK7SNVMissense_Mutationnovelc.2262N>Ap.Met754Ilep.M754IQ13308protein_codingdeleterious(0.04)benign(0.067)TCGA-A7-A6VX-01Breastbreast invasive carcinomaFemale>=65I/IIChemotherapydocetaxelCR
PTK7SNVMissense_Mutationc.2124G>Tp.Lys708Asnp.K708NQ13308protein_codingdeleterious(0.04)benign(0.082)TCGA-A8-A0A9-01Breastbreast invasive carcinomaFemale>=65I/IIHormone TherapyanastrozoleSD
PTK7SNVMissense_Mutationrs374956441c.493C>Tp.Arg165Trpp.R165WQ13308protein_codingdeleterious(0)probably_damaging(0.983)TCGA-AC-A23H-01Breastbreast invasive carcinomaFemale>=65I/IIUnknownUnknownPD
PTK7SNVMissense_Mutationnovelc.2578N>Cp.Lys860Glnp.K860QQ13308protein_codingdeleterious(0)possibly_damaging(0.734)TCGA-B6-A0IN-01Breastbreast invasive carcinomaFemale<65I/IIUnknownUnknownPD
PTK7SNVMissense_Mutationc.2317G>Ap.Glu773Lysp.E773KQ13308protein_codingdeleterious(0.03)benign(0.119)TCGA-D8-A1JN-01Breastbreast invasive carcinomaFemale>=65III/IVHormone TherapyanastrozolumSD
PTK7SNVMissense_Mutationnovelc.1769N>Tp.Ala590Valp.A590VQ13308protein_codingdeleterious(0.01)possibly_damaging(0.475)TCGA-E9-A228-01Breastbreast invasive carcinomaFemale<65I/IIChemotherapydoxorubicinSD
PTK7SNVMissense_Mutationrs767634504c.581N>Tp.Thr194Metp.T194MQ13308protein_codingdeleterious(0.03)benign(0.104)TCGA-S3-AA14-01Breastbreast invasive carcinomaFemale<65I/IIChemotherapyadriamycinCR
PTK7insertionIn_Frame_Insnovelc.2208_2209insGATCTGGGCCCAAACAGAGTCCGGTTTGGCAGACGTGGAATGTCAp.Lys736_Arg737insAspLeuGlyProAsnArgValArgPheGlyArgArgGlyMetSerp.K736_R737insDLGPNRVRFGRRGMSQ13308protein_codingTCGA-AO-A0J9-01Breastbreast invasive carcinomaFemale<65III/IVChemotherapycyclophosphamidePD
PTK7insertionFrame_Shift_Insnovelc.2577_2578insCTTCCp.Lys860LeufsTer4p.K860Lfs*4Q13308protein_codingTCGA-B6-A0IN-01Breastbreast invasive carcinomaFemale<65I/IIUnknownUnknownPD
Page: 1 2 3 4 5 6 7 8 9 10 11 12 

Top

Related drugs of malignant transformation related genes

check buttonIdentification of chemicals and drugs interact with genes involved in malignant transfromation
(DGIdb 4.0)
Entrez IDSymbolCategoryInteraction TypesDrug Claim NameDrug NamePMIDs
5754PTK7DRUGGABLE GENOME, KINASE, TYROSINE KINASE, CLINICALLY ACTIONABLEPF-06647020COFETUZUMAB PELIDOTIN
Page: 1