| Tissue | Expression Dynamics | Abbreviation |
| Colorectum (GSE201348) |  | FAP: Familial adenomatous polyposis |
| CRC: Colorectal cancer |
| Colorectum (HTA11) |  | AD: Adenomas |
| SER: Sessile serrated lesions |
| MSI-H: Microsatellite-high colorectal cancer |
| MSS: Microsatellite stable colorectal cancer |
| Liver | 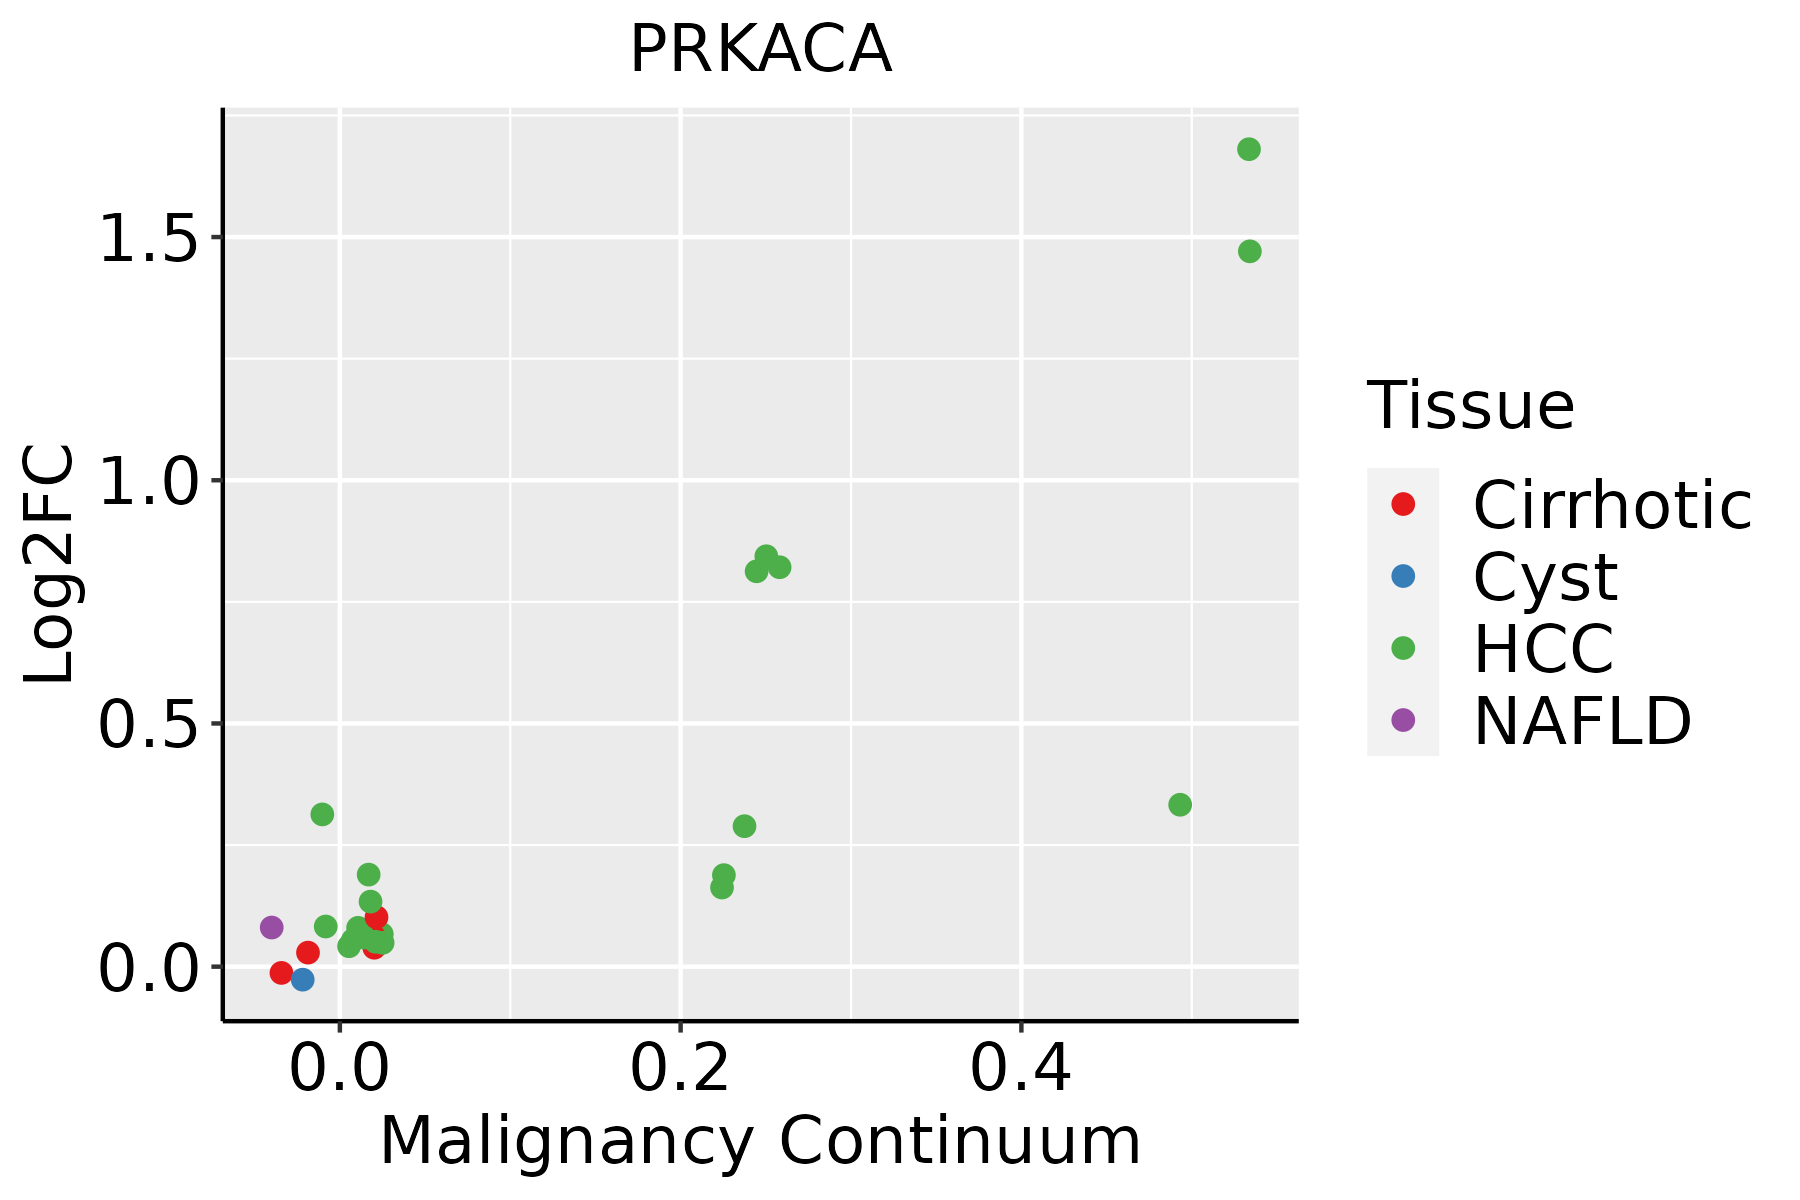 | HCC: Hepatocellular carcinoma |
| NAFLD: Non-alcoholic fatty liver disease |
| Oral Cavity |  | EOLP: Erosive Oral lichen planus |
| LP: leukoplakia |
| NEOLP: Non-erosive oral lichen planus |
| OSCC: Oral squamous cell carcinoma |
| Thyroid | 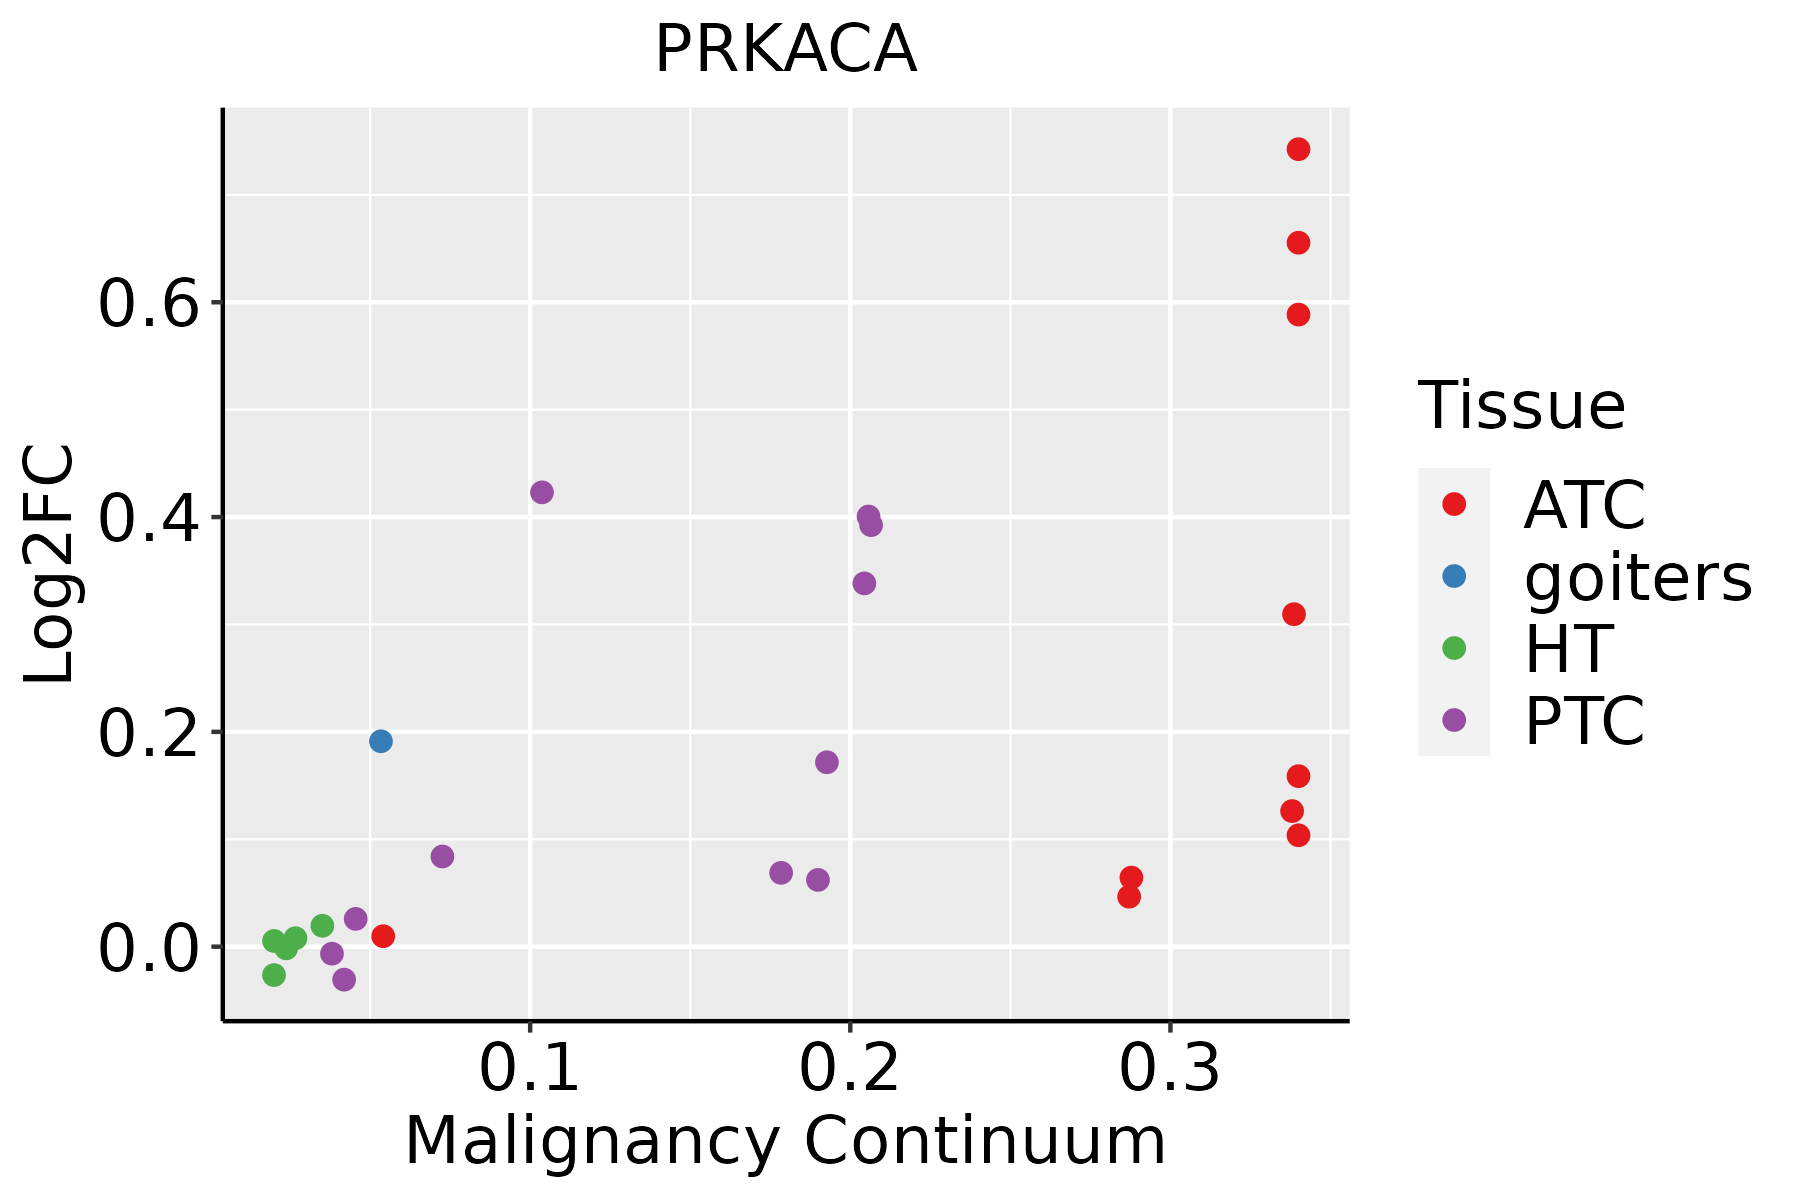 | ATC: Anaplastic thyroid cancer |
| HT: Hashimoto's thyroiditis |
| PTC: Papillary thyroid cancer |
| GO ID | Tissue | Disease Stage | Description | Gene Ratio | Bg Ratio | pvalue | p.adjust | Count |
| GO:00713312 | Colorectum | MSS | cellular response to hexose stimulus | 49/3467 | 153/18723 | 4.01e-05 | 7.61e-04 | 49 |
| GO:00713262 | Colorectum | MSS | cellular response to monosaccharide stimulus | 49/3467 | 154/18723 | 4.84e-05 | 8.80e-04 | 49 |
| GO:00605621 | Colorectum | MSS | epithelial tube morphogenesis | 88/3467 | 325/18723 | 8.45e-05 | 1.37e-03 | 88 |
| GO:00508782 | Colorectum | MSS | regulation of body fluid levels | 99/3467 | 379/18723 | 1.40e-04 | 2.07e-03 | 99 |
| GO:00162412 | Colorectum | MSS | regulation of macroautophagy | 44/3467 | 141/18723 | 1.88e-04 | 2.64e-03 | 44 |
| GO:00432972 | Colorectum | MSS | apical junction assembly | 28/3467 | 78/18723 | 2.12e-04 | 2.95e-03 | 28 |
| GO:00140201 | Colorectum | MSS | primary neural tube formation | 32/3467 | 94/18723 | 2.42e-04 | 3.30e-03 | 32 |
| GO:00018412 | Colorectum | MSS | neural tube formation | 34/3467 | 102/18723 | 2.48e-04 | 3.37e-03 | 34 |
| GO:00468272 | Colorectum | MSS | positive regulation of protein export from nucleus | 10/3467 | 17/18723 | 2.54e-04 | 3.42e-03 | 10 |
| GO:00016492 | Colorectum | MSS | osteoblast differentiation | 64/3467 | 229/18723 | 2.91e-04 | 3.83e-03 | 64 |
| GO:00467772 | Colorectum | MSS | protein autophosphorylation | 63/3467 | 227/18723 | 3.96e-04 | 4.91e-03 | 63 |
| GO:00351481 | Colorectum | MSS | tube formation | 44/3467 | 148/18723 | 6.06e-04 | 6.68e-03 | 44 |
| GO:00094092 | Colorectum | MSS | response to cold | 19/3467 | 49/18723 | 7.20e-04 | 7.70e-03 | 19 |
| GO:01201932 | Colorectum | MSS | tight junction organization | 27/3467 | 80/18723 | 8.31e-04 | 8.68e-03 | 27 |
| GO:00066112 | Colorectum | MSS | protein export from nucleus | 21/3467 | 57/18723 | 8.53e-04 | 8.75e-03 | 21 |
| GO:00181052 | Colorectum | MSS | peptidyl-serine phosphorylation | 81/3467 | 315/18723 | 8.92e-04 | 9.12e-03 | 81 |
| GO:00018381 | Colorectum | MSS | embryonic epithelial tube formation | 37/3467 | 121/18723 | 8.95e-04 | 9.13e-03 | 37 |
| GO:0086065 | Colorectum | MSS | cell communication involved in cardiac conduction | 21/3467 | 58/18723 | 1.11e-03 | 1.09e-02 | 21 |
| GO:01201922 | Colorectum | MSS | tight junction assembly | 25/3467 | 74/18723 | 1.25e-03 | 1.20e-02 | 25 |
| GO:00468252 | Colorectum | MSS | regulation of protein export from nucleus | 13/3467 | 30/18723 | 1.49e-03 | 1.38e-02 | 13 |
| Pathway ID | Tissue | Disease Stage | Description | Gene Ratio | Bg Ratio | pvalue | p.adjust | qvalue | Count |
| hsa05012 | Colorectum | AD | Parkinson disease | 147/2092 | 266/8465 | 2.53e-27 | 8.48e-25 | 5.41e-25 | 147 |
| hsa04714 | Colorectum | AD | Thermogenesis | 120/2092 | 232/8465 | 2.76e-19 | 1.16e-17 | 7.37e-18 | 120 |
| hsa05020 | Colorectum | AD | Prion disease | 133/2092 | 273/8465 | 2.47e-18 | 8.29e-17 | 5.29e-17 | 133 |
| hsa04530 | Colorectum | AD | Tight junction | 76/2092 | 169/8465 | 5.49e-09 | 9.69e-08 | 6.18e-08 | 76 |
| hsa05110 | Colorectum | AD | Vibrio cholerae infection | 29/2092 | 50/8465 | 5.10e-07 | 7.12e-06 | 4.54e-06 | 29 |
| hsa04919 | Colorectum | AD | Thyroid hormone signaling pathway | 51/2092 | 121/8465 | 1.71e-05 | 1.73e-04 | 1.10e-04 | 51 |
| hsa04723 | Colorectum | AD | Retrograde endocannabinoid signaling | 59/2092 | 148/8465 | 2.94e-05 | 2.73e-04 | 1.74e-04 | 59 |
| hsa04961 | Colorectum | AD | Endocrine and other factor-regulated calcium reabsorption | 24/2092 | 53/8465 | 8.49e-04 | 5.93e-03 | 3.78e-03 | 24 |
| hsa04213 | Colorectum | AD | Longevity regulating pathway - multiple species | 27/2092 | 62/8465 | 8.72e-04 | 5.96e-03 | 3.80e-03 | 27 |
| hsa04922 | Colorectum | AD | Glucagon signaling pathway | 41/2092 | 107/8465 | 1.18e-03 | 7.75e-03 | 4.94e-03 | 41 |
| hsa05205 | Colorectum | AD | Proteoglycans in cancer | 70/2092 | 205/8465 | 1.37e-03 | 8.46e-03 | 5.39e-03 | 70 |
| hsa05163 | Colorectum | AD | Human cytomegalovirus infection | 75/2092 | 225/8465 | 2.00e-03 | 1.10e-02 | 7.01e-03 | 75 |
| hsa04912 | Colorectum | AD | GnRH signaling pathway | 35/2092 | 93/8465 | 3.69e-03 | 1.90e-02 | 1.21e-02 | 35 |
| hsa04140 | Colorectum | AD | Autophagy - animal | 49/2092 | 141/8465 | 4.58e-03 | 2.20e-02 | 1.40e-02 | 49 |
| hsa05166 | Colorectum | AD | Human T-cell leukemia virus 1 infection | 72/2092 | 222/8465 | 5.24e-03 | 2.44e-02 | 1.55e-02 | 72 |
| hsa04962 | Colorectum | AD | Vasopressin-regulated water reabsorption | 19/2092 | 44/8465 | 5.48e-03 | 2.48e-02 | 1.58e-02 | 19 |
| hsa04728 | Colorectum | AD | Dopaminergic synapse | 46/2092 | 132/8465 | 5.55e-03 | 2.48e-02 | 1.58e-02 | 46 |
| hsa04211 | Colorectum | AD | Longevity regulating pathway | 33/2092 | 89/8465 | 6.15e-03 | 2.68e-02 | 1.71e-02 | 33 |
| hsa04971 | Colorectum | AD | Gastric acid secretion | 29/2092 | 76/8465 | 6.25e-03 | 2.68e-02 | 1.71e-02 | 29 |
| hsa04928 | Colorectum | AD | Parathyroid hormone synthesis, secretion and action | 38/2092 | 106/8465 | 6.60e-03 | 2.77e-02 | 1.76e-02 | 38 |
| Hugo Symbol | Variant Class | Variant Classification | dbSNP RS | HGVSc | HGVSp | HGVSp Short | SWISSPROT | BIOTYPE | SIFT | PolyPhen | Tumor Sample Barcode | Tissue | Histology | Sex | Age | Stage | Therapy Types | Drugs | Outcome |
| PRKACA | SNV | Missense_Mutation | | c.382N>C | p.Glu128Gln | p.E128Q | P17612 | protein_coding | deleterious(0) | probably_damaging(0.989) | TCGA-A8-A07J-01 | Breast | breast invasive carcinoma | Female | <65 | I/II | Chemotherapy | 5-fluorouracil | CR |
| PRKACA | SNV | Missense_Mutation | | c.656N>T | p.Ala219Val | p.A219V | P17612 | protein_coding | deleterious(0) | probably_damaging(0.962) | TCGA-BH-A0HF-01 | Breast | breast invasive carcinoma | Female | >=65 | I/II | Hormone Therapy | arimidex | SD |
| PRKACA | SNV | Missense_Mutation | | c.248T>C | p.Leu83Pro | p.L83P | P17612 | protein_coding | deleterious(0) | probably_damaging(0.925) | TCGA-E2-A15L-01 | Breast | breast invasive carcinoma | Female | >=65 | I/II | Hormone Therapy | arimidex | SD |
| PRKACA | SNV | Missense_Mutation | | c.589N>A | p.Trp197Arg | p.W197R | P17612 | protein_coding | deleterious(0) | probably_damaging(0.91) | TCGA-E2-A1IU-01 | Breast | breast invasive carcinoma | Female | <65 | I/II | Hormone Therapy | arimidex | SD |
| PRKACA | SNV | Missense_Mutation | | c.376N>A | p.Gly126Ser | p.G126S | P17612 | protein_coding | deleterious(0) | probably_damaging(1) | TCGA-GM-A2DO-01 | Breast | breast invasive carcinoma | Female | <65 | I/II | Hormone Therapy | tamoxiphen | CR |
| PRKACA | deletion | Frame_Shift_Del | novel | c.871delN | p.Asp291IlefsTer99 | p.D291Ifs*99 | P17612 | protein_coding | | | TCGA-D8-A27V-01 | Breast | breast invasive carcinoma | Female | <65 | I/II | Hormone Therapy | tamoxiphen | SD |
| PRKACA | SNV | Missense_Mutation | | c.710C>T | p.Pro237Leu | p.P237L | P17612 | protein_coding | deleterious(0) | probably_damaging(0.99) | TCGA-C5-A7CH-01 | Cervix | cervical & endocervical cancer | Female | <65 | I/II | Unspecific | | SD |
| PRKACA | SNV | Missense_Mutation | | c.450G>T | p.Gln150His | p.Q150H | P17612 | protein_coding | deleterious(0) | probably_damaging(0.999) | TCGA-Q1-A73O-01 | Cervix | cervical & endocervical cancer | Female | <65 | I/II | Chemotherapy | cisplatin | CR |
| PRKACA | SNV | Missense_Mutation | | c.700N>A | p.Ala234Thr | p.A234T | P17612 | protein_coding | deleterious(0.04) | possibly_damaging(0.567) | TCGA-CK-5913-01 | Colorectum | colon adenocarcinoma | Female | <65 | I/II | Unknown | Unknown | SD |
| PRKACA | SNV | Missense_Mutation | | c.442N>A | p.Ala148Thr | p.A148T | P17612 | protein_coding | deleterious(0.02) | probably_damaging(0.951) | TCGA-AJ-A23O-01 | Endometrium | uterine corpus endometrioid carcinoma | Female | >=65 | I/II | Unknown | Unknown | SD |
| Entrez ID | Symbol | Category | Interaction Types | Drug Claim Name | Drug Name | PMIDs |
| 5566 | PRKACA | SERINE THREONINE KINASE, TUMOR SUPPRESSOR, DRUGGABLE GENOME, KINASE, ENZYME, CLINICALLY ACTIONABLE | | ALISERTIB | ALISERTIB | |
| 5566 | PRKACA | SERINE THREONINE KINASE, TUMOR SUPPRESSOR, DRUGGABLE GENOME, KINASE, ENZYME, CLINICALLY ACTIONABLE | | TCMDC-125758 | CHEMBL546797 | |
| 5566 | PRKACA | SERINE THREONINE KINASE, TUMOR SUPPRESSOR, DRUGGABLE GENOME, KINASE, ENZYME, CLINICALLY ACTIONABLE | | CYC-116 | CYC-116 | |
| 5566 | PRKACA | SERINE THREONINE KINASE, TUMOR SUPPRESSOR, DRUGGABLE GENOME, KINASE, ENZYME, CLINICALLY ACTIONABLE | | AG-1879 | CHEMBL406845 | |
| 5566 | PRKACA | SERINE THREONINE KINASE, TUMOR SUPPRESSOR, DRUGGABLE GENOME, KINASE, ENZYME, CLINICALLY ACTIONABLE | | CENISERTIB | CENISERTIB | |
| 5566 | PRKACA | SERINE THREONINE KINASE, TUMOR SUPPRESSOR, DRUGGABLE GENOME, KINASE, ENZYME, CLINICALLY ACTIONABLE | | GO-6976 | GO-6976 | |
| 5566 | PRKACA | SERINE THREONINE KINASE, TUMOR SUPPRESSOR, DRUGGABLE GENOME, KINASE, ENZYME, CLINICALLY ACTIONABLE | inhibitor | CHEMBL494089 | GSK-690693 | |
| 5566 | PRKACA | SERINE THREONINE KINASE, TUMOR SUPPRESSOR, DRUGGABLE GENOME, KINASE, ENZYME, CLINICALLY ACTIONABLE | | PD-0166285 | PD-0166285 | |
| 5566 | PRKACA | SERINE THREONINE KINASE, TUMOR SUPPRESSOR, DRUGGABLE GENOME, KINASE, ENZYME, CLINICALLY ACTIONABLE | inhibitor | 178102606 | CHEMBL104264 | |
| 5566 | PRKACA | SERINE THREONINE KINASE, TUMOR SUPPRESSOR, DRUGGABLE GENOME, KINASE, ENZYME, CLINICALLY ACTIONABLE | | FASUDIL | FASUDIL | |


