| Tissue | Expression Dynamics | Abbreviation |
| Colorectum (GSE201348) |  | FAP: Familial adenomatous polyposis |
| CRC: Colorectal cancer |
| Colorectum (HTA11) |  | AD: Adenomas |
| SER: Sessile serrated lesions |
| MSI-H: Microsatellite-high colorectal cancer |
| MSS: Microsatellite stable colorectal cancer |
| Esophagus |  | ESCC: Esophageal squamous cell carcinoma |
| HGIN: High-grade intraepithelial neoplasias |
| LGIN: Low-grade intraepithelial neoplasias |
| Liver |  | HCC: Hepatocellular carcinoma |
| NAFLD: Non-alcoholic fatty liver disease |
| Lung | 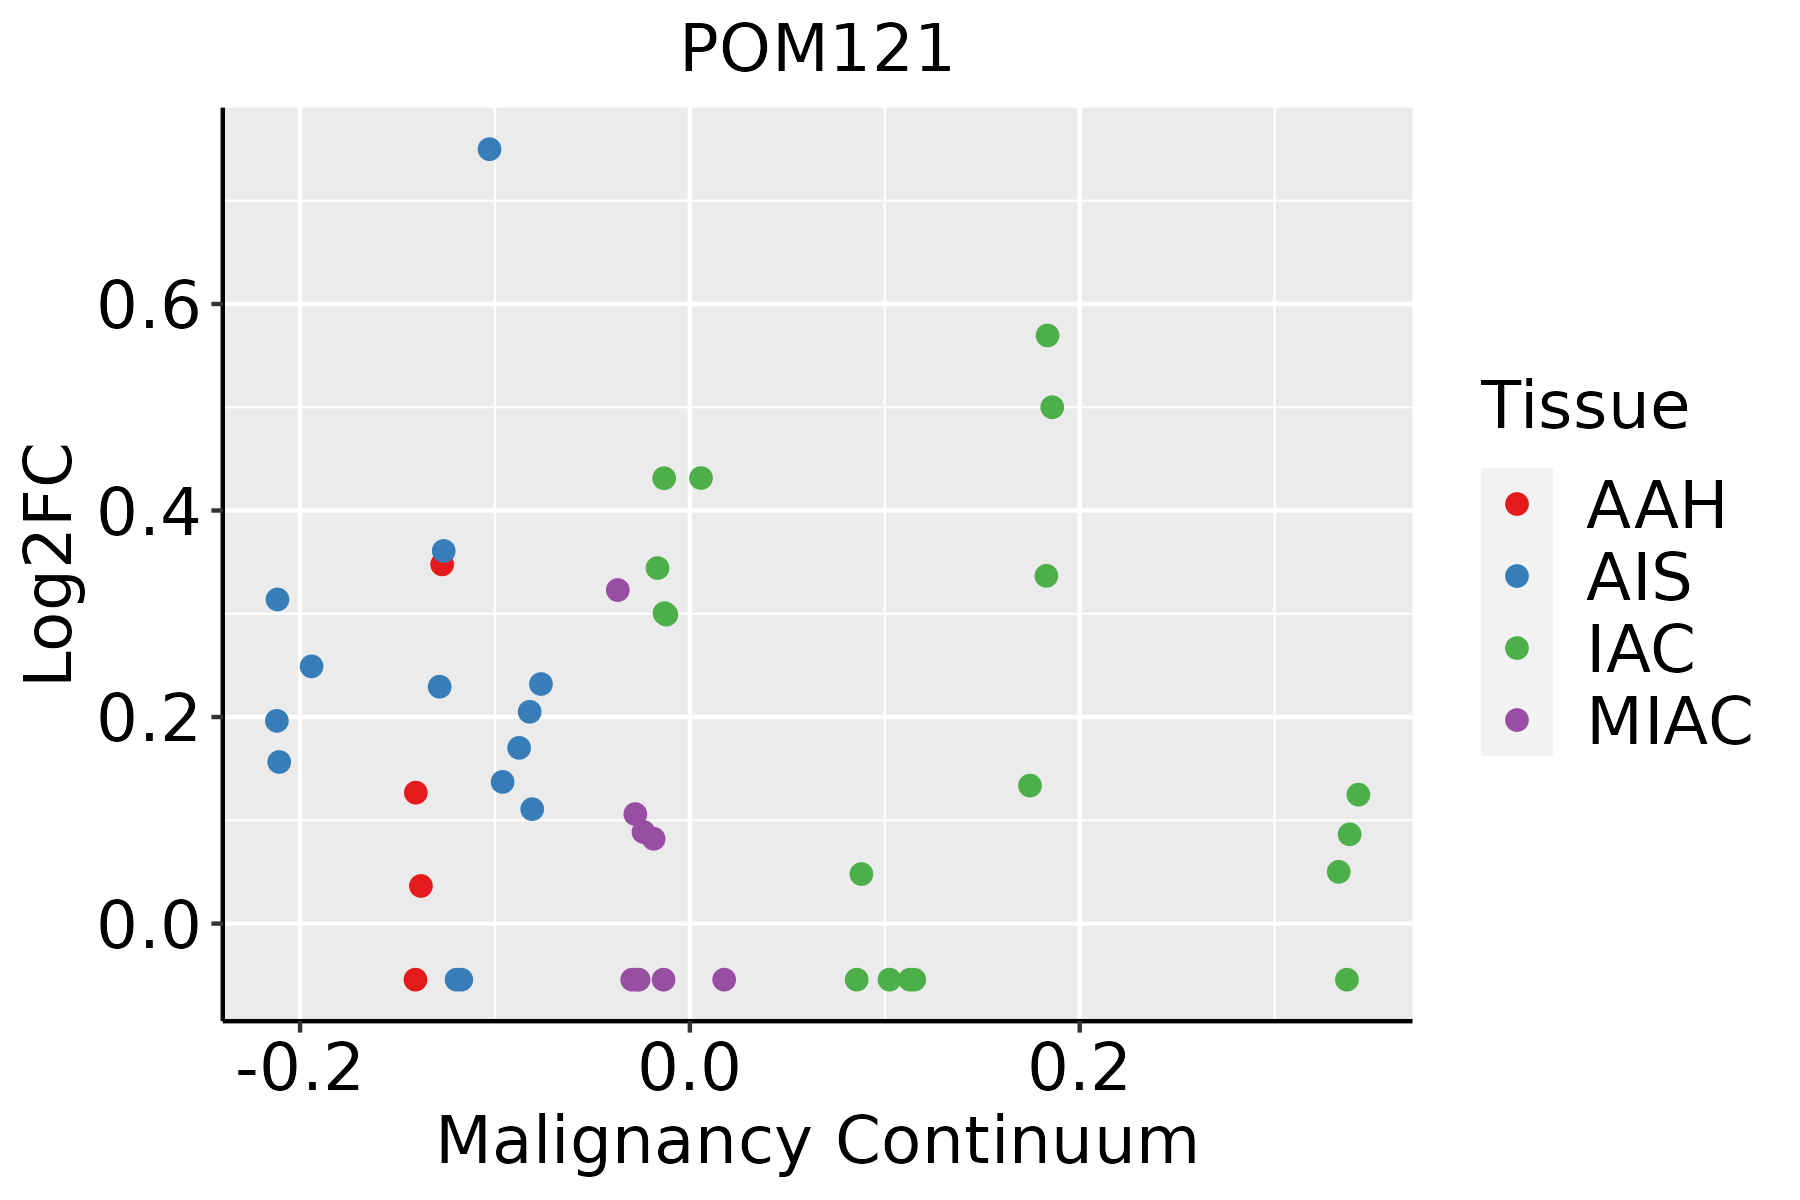 | AAH: Atypical adenomatous hyperplasia |
| AIS: Adenocarcinoma in situ |
| IAC: Invasive lung adenocarcinoma |
| MIA: Minimally invasive adenocarcinoma |
| Thyroid | 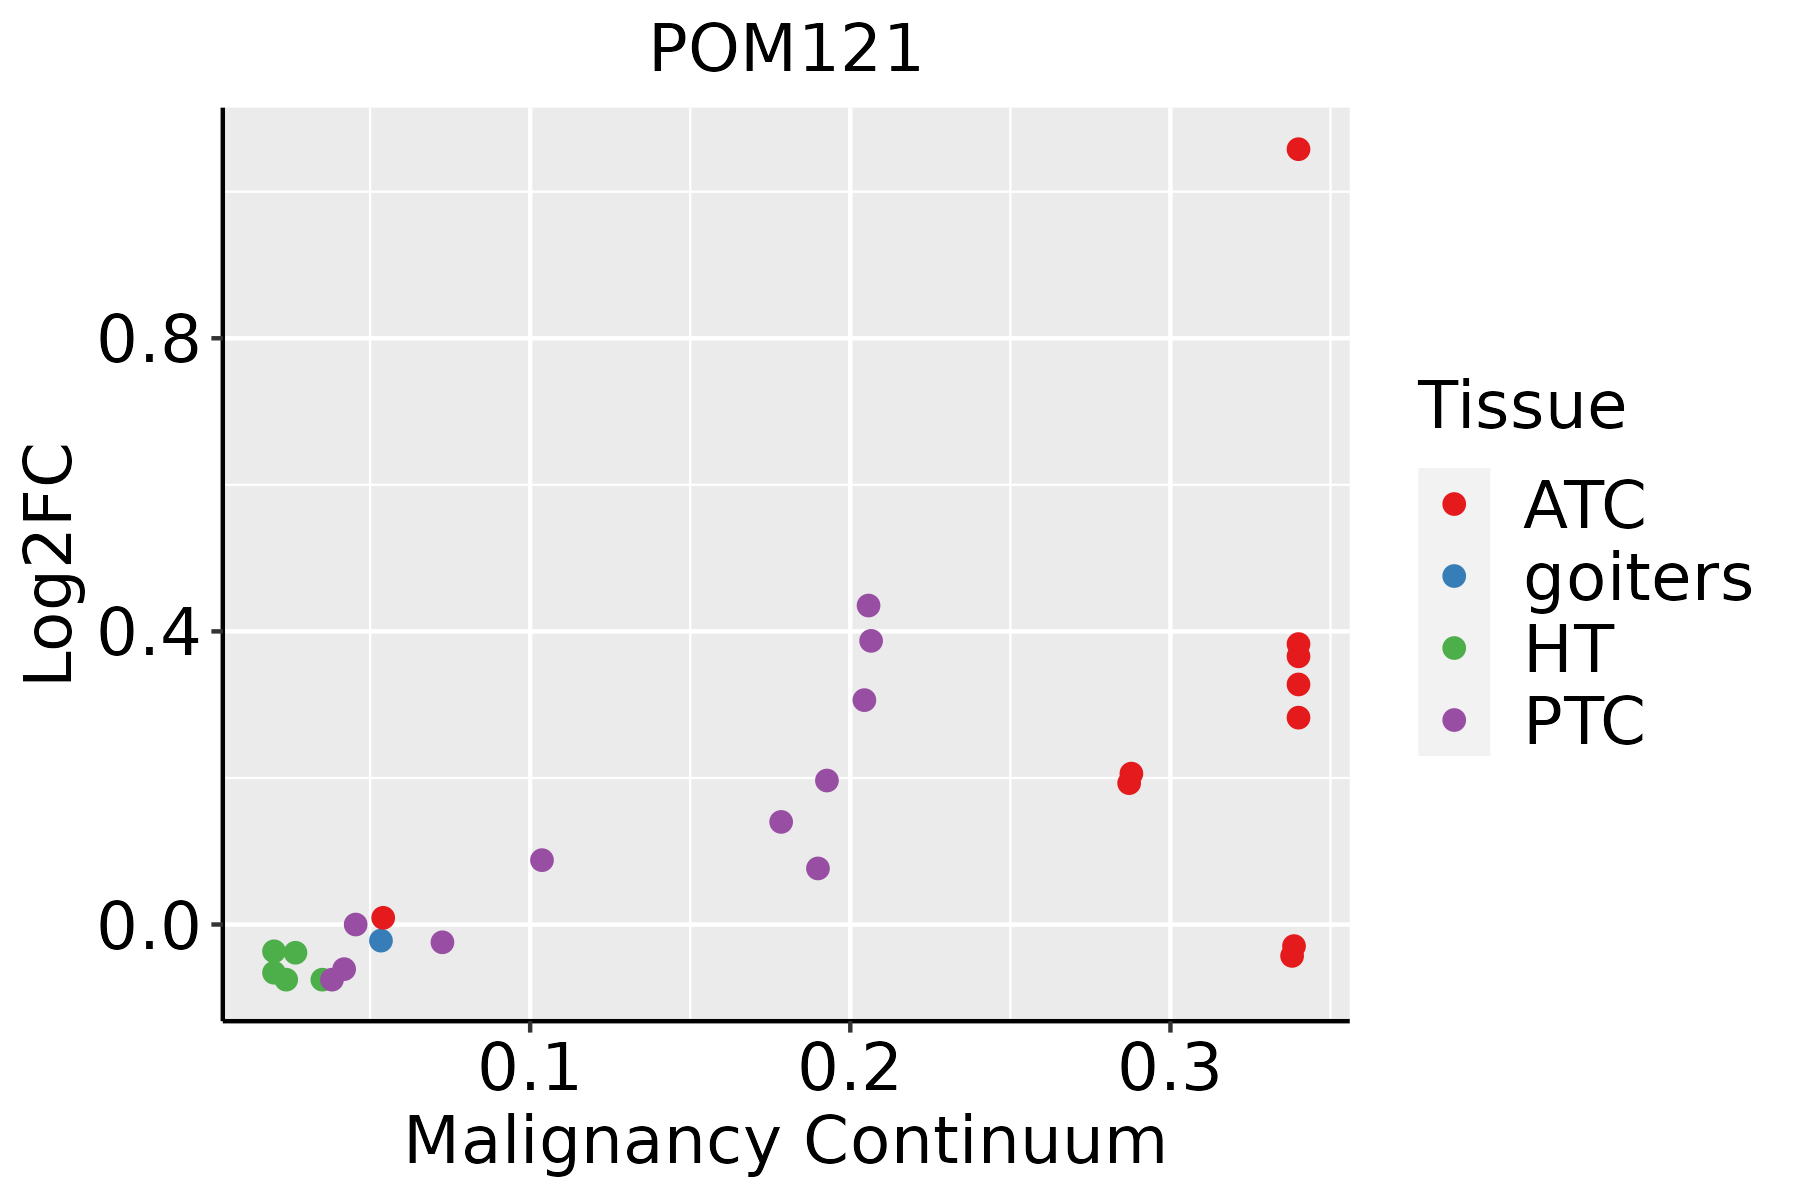 | ATC: Anaplastic thyroid cancer |
| HT: Hashimoto's thyroiditis |
| PTC: Papillary thyroid cancer |
| GO ID | Tissue | Disease Stage | Description | Gene Ratio | Bg Ratio | pvalue | p.adjust | Count |
| GO:0072594112 | Thyroid | PTC | establishment of protein localization to organelle | 244/5968 | 422/18723 | 1.18e-28 | 4.97e-26 | 244 |
| GO:0006913112 | Thyroid | PTC | nucleocytoplasmic transport | 181/5968 | 301/18723 | 2.93e-24 | 7.69e-22 | 181 |
| GO:0051169112 | Thyroid | PTC | nuclear transport | 181/5968 | 301/18723 | 2.93e-24 | 7.69e-22 | 181 |
| GO:0006403112 | Thyroid | PTC | RNA localization | 130/5968 | 201/18723 | 9.23e-22 | 1.94e-19 | 130 |
| GO:0034504111 | Thyroid | PTC | protein localization to nucleus | 170/5968 | 290/18723 | 3.34e-21 | 6.38e-19 | 170 |
| GO:0051168112 | Thyroid | PTC | nuclear export | 102/5968 | 154/18723 | 1.78e-18 | 2.01e-16 | 102 |
| GO:0051236110 | Thyroid | PTC | establishment of RNA localization | 100/5968 | 166/18723 | 4.26e-14 | 2.58e-12 | 100 |
| GO:0050657110 | Thyroid | PTC | nucleic acid transport | 98/5968 | 163/18723 | 9.08e-14 | 4.90e-12 | 98 |
| GO:0050658110 | Thyroid | PTC | RNA transport | 98/5968 | 163/18723 | 9.08e-14 | 4.90e-12 | 98 |
| GO:0015931110 | Thyroid | PTC | nucleobase-containing compound transport | 120/5968 | 222/18723 | 5.45e-12 | 2.35e-10 | 120 |
| GO:005102817 | Thyroid | PTC | mRNA transport | 78/5968 | 130/18723 | 3.44e-11 | 1.26e-09 | 78 |
| GO:0017038111 | Thyroid | PTC | protein import | 109/5968 | 206/18723 | 2.74e-10 | 8.96e-09 | 109 |
| GO:005117017 | Thyroid | PTC | import into nucleus | 85/5968 | 159/18723 | 1.30e-08 | 3.08e-07 | 85 |
| GO:000660616 | Thyroid | PTC | protein import into nucleus | 82/5968 | 155/18723 | 4.32e-08 | 9.27e-07 | 82 |
| GO:00064058 | Thyroid | PTC | RNA export from nucleus | 50/5968 | 84/18723 | 1.59e-07 | 3.03e-06 | 50 |
| GO:007259429 | Thyroid | ATC | establishment of protein localization to organelle | 247/6293 | 422/18723 | 2.88e-26 | 1.40e-23 | 247 |
| GO:003450423 | Thyroid | ATC | protein localization to nucleus | 175/6293 | 290/18723 | 6.23e-21 | 1.23e-18 | 175 |
| GO:000691326 | Thyroid | ATC | nucleocytoplasmic transport | 180/6293 | 301/18723 | 6.97e-21 | 1.30e-18 | 180 |
| GO:005116926 | Thyroid | ATC | nuclear transport | 180/6293 | 301/18723 | 6.97e-21 | 1.30e-18 | 180 |
| GO:000640326 | Thyroid | ATC | RNA localization | 132/6293 | 201/18723 | 1.13e-20 | 1.93e-18 | 132 |
| Pathway ID | Tissue | Disease Stage | Description | Gene Ratio | Bg Ratio | pvalue | p.adjust | qvalue | Count |
| hsa05014 | Colorectum | AD | Amyotrophic lateral sclerosis | 164/2092 | 364/8465 | 4.28e-18 | 1.27e-16 | 8.09e-17 | 164 |
| hsa050141 | Colorectum | AD | Amyotrophic lateral sclerosis | 164/2092 | 364/8465 | 4.28e-18 | 1.27e-16 | 8.09e-17 | 164 |
| hsa050144 | Colorectum | MSS | Amyotrophic lateral sclerosis | 156/1875 | 364/8465 | 1.43e-19 | 4.62e-18 | 2.83e-18 | 156 |
| hsa050145 | Colorectum | MSS | Amyotrophic lateral sclerosis | 156/1875 | 364/8465 | 1.43e-19 | 4.62e-18 | 2.83e-18 | 156 |
| hsa050148 | Colorectum | FAP | Amyotrophic lateral sclerosis | 91/1404 | 364/8465 | 1.84e-05 | 2.36e-04 | 1.44e-04 | 91 |
| hsa050149 | Colorectum | FAP | Amyotrophic lateral sclerosis | 91/1404 | 364/8465 | 1.84e-05 | 2.36e-04 | 1.44e-04 | 91 |
| hsa05014210 | Esophagus | ESCC | Amyotrophic lateral sclerosis | 266/4205 | 364/8465 | 1.31e-20 | 2.20e-18 | 1.13e-18 | 266 |
| hsa0301321 | Esophagus | ESCC | Nucleocytoplasmic transport | 89/4205 | 108/8465 | 1.20e-12 | 2.37e-11 | 1.21e-11 | 89 |
| hsa0501438 | Esophagus | ESCC | Amyotrophic lateral sclerosis | 266/4205 | 364/8465 | 1.31e-20 | 2.20e-18 | 1.13e-18 | 266 |
| hsa0301331 | Esophagus | ESCC | Nucleocytoplasmic transport | 89/4205 | 108/8465 | 1.20e-12 | 2.37e-11 | 1.21e-11 | 89 |
| hsa0501414 | Liver | Cirrhotic | Amyotrophic lateral sclerosis | 187/2530 | 364/8465 | 1.56e-18 | 6.50e-17 | 4.01e-17 | 187 |
| hsa0501415 | Liver | Cirrhotic | Amyotrophic lateral sclerosis | 187/2530 | 364/8465 | 1.56e-18 | 6.50e-17 | 4.01e-17 | 187 |
| hsa0501422 | Liver | HCC | Amyotrophic lateral sclerosis | 252/4020 | 364/8465 | 8.85e-18 | 7.41e-16 | 4.12e-16 | 252 |
| hsa03013 | Liver | HCC | Nucleocytoplasmic transport | 81/4020 | 108/8465 | 4.28e-09 | 6.83e-08 | 3.80e-08 | 81 |
| hsa0501432 | Liver | HCC | Amyotrophic lateral sclerosis | 252/4020 | 364/8465 | 8.85e-18 | 7.41e-16 | 4.12e-16 | 252 |
| hsa030131 | Liver | HCC | Nucleocytoplasmic transport | 81/4020 | 108/8465 | 4.28e-09 | 6.83e-08 | 3.80e-08 | 81 |
| Hugo Symbol | Variant Class | Variant Classification | dbSNP RS | HGVSc | HGVSp | HGVSp Short | SWISSPROT | BIOTYPE | SIFT | PolyPhen | Tumor Sample Barcode | Tissue | Histology | Sex | Age | Stage | Therapy Types | Drugs | Outcome |
| POM121 | SNV | Missense_Mutation | | c.409N>A | p.Ala137Thr | p.A137T | Q96HA1 | protein_coding | tolerated(1) | benign(0) | TCGA-AN-A0AK-01 | Breast | breast invasive carcinoma | Female | >=65 | I/II | Unknown | Unknown | SD |
| POM121 | SNV | Missense_Mutation | | c.159G>C | p.Glu53Asp | p.E53D | Q96HA1 | protein_coding | tolerated(0.08) | possibly_damaging(0.795) | TCGA-BH-A0DZ-01 | Breast | breast invasive carcinoma | Female | <65 | I/II | Chemotherapy | docetaxel | SD |
| POM121 | SNV | Missense_Mutation | | c.2713N>A | p.Glu905Lys | p.E905K | Q96HA1 | protein_coding | tolerated(0.05) | benign(0.219) | TCGA-E2-A10C-01 | Breast | breast invasive carcinoma | Female | <65 | I/II | Chemotherapy | cytoxan | SD |
| POM121 | SNV | Missense_Mutation | | c.2977N>A | p.Ser993Thr | p.S993T | Q96HA1 | protein_coding | tolerated_low_confidence(0.67) | benign(0.034) | TCGA-E9-A1ND-01 | Breast | breast invasive carcinoma | Female | >=65 | I/II | Hormone Therapy | aromasin | SD |
| POM121 | SNV | Missense_Mutation | novel | c.349G>A | p.Asp117Asn | p.D117N | Q96HA1 | protein_coding | deleterious(0.01) | possibly_damaging(0.691) | TCGA-PE-A5DE-01 | Breast | breast invasive carcinoma | Female | <65 | I/II | Chemotherapy | taxotere | CR |
| POM121 | SNV | Missense_Mutation | novel | c.2656N>T | p.Ala886Ser | p.A886S | Q96HA1 | protein_coding | tolerated(0.48) | benign(0.009) | TCGA-PL-A8LZ-01 | Breast | breast invasive carcinoma | Female | <65 | III/IV | Chemotherapy | paclitaxel | SD |
| POM121 | insertion | Nonsense_Mutation | novel | c.151_152insACTACCAGACTTTTTAAACAGCTTTATTAAGATATAAT | p.Leu51HisfsTer6 | p.L51Hfs*6 | Q96HA1 | protein_coding | | | TCGA-AO-A0J9-01 | Breast | breast invasive carcinoma | Female | <65 | III/IV | Chemotherapy | cyclophosphamide | PD |
| POM121 | SNV | Missense_Mutation | | c.2836T>G | p.Phe946Val | p.F946V | Q96HA1 | protein_coding | deleterious(0.01) | probably_damaging(0.994) | TCGA-FU-A3HZ-01 | Cervix | cervical & endocervical cancer | Female | <65 | I/II | Chemotherapy | cisplatin | CR |
| POM121 | SNV | Missense_Mutation | novel | c.351N>G | p.Asp117Glu | p.D117E | Q96HA1 | protein_coding | tolerated(0.19) | benign(0.039) | TCGA-AA-3818-01 | Colorectum | colon adenocarcinoma | Female | >=65 | I/II | Unknown | Unknown | PD |
| POM121 | SNV | Missense_Mutation | novel | c.1700N>T | p.Ser567Leu | p.S567L | Q96HA1 | protein_coding | tolerated(0.71) | benign(0.003) | TCGA-AA-A00N-01 | Colorectum | colon adenocarcinoma | Male | >=65 | I/II | Unknown | Unknown | PD |


