Schematic overview of the cellular and molecular mechanisms involved in the cancer progression, including the proposed cellular and molecular mechanisms in cancer cells trajectory. AT1: alveolar type 1 cells; AT2: alveolar type 2 cells; AAH: atypical adenomatous hyperplasia; AIS: adenocarcinoma in situ; MIA: minimally invasive adenocarcinoma; IA: invasive adenocarcinoma; EMT: epithelial-mesenchymal transition

Home

Download

Statistics

Help

Contact

Center for Computational Systems Medicine
leaf

Gene summary

leaf

Malignant transformation analysis

leaf

Malignant transformation related pathway analysis

leaf

Cell-cell communication analysis

leaf

Single-cell gene regulatory network inference analysis

leaf

Somatic mutation of malignant transformation related genes

leaf

Related drugs of malignant transformation related genes

Gene: NUTF2

Gene summary for NUTF2

check button Gene summary.

Gene informationSpeciesHuman
Gene symbol

NUTF2

Gene ID

10204

Gene namenuclear transport factor 2
Gene AliasNTF-2
Cytomap16q22.1
Gene Typeprotein-coding
GO ID

GO:0001816

UniProtAcc

A0A024R6Y2


Top

Malignant transformation analysis

check button Identification of the aberrant gene expression in precancerous and cancerous lesions by comparing the gene expression of stem-like cells in diseased tissues with normal stem cells
check button Malignant transformation involving gene list.
Entrez IDSymbolReplicatesSpeciesOrganTissueAdj P-valueLog2FCMalignancy
10204NUTF2HTA11_2487_2000001011HumanColorectumSER8.78e-072.78e-01-0.1808
10204NUTF2HTA11_1938_2000001011HumanColorectumAD7.33e-094.82e-01-0.0811
10204NUTF2HTA11_78_2000001011HumanColorectumAD7.10e-042.58e-01-0.1088
10204NUTF2HTA11_347_2000001011HumanColorectumAD8.66e-123.65e-01-0.1954
10204NUTF2HTA11_411_2000001011HumanColorectumSER5.52e-077.20e-01-0.2602
10204NUTF2HTA11_696_2000001011HumanColorectumAD8.02e-042.83e-01-0.1464
10204NUTF2HTA11_866_2000001011HumanColorectumAD1.61e-052.54e-01-0.1001
10204NUTF2HTA11_1391_2000001011HumanColorectumAD2.86e-083.99e-01-0.059
10204NUTF2HTA11_866_3004761011HumanColorectumAD1.69e-134.69e-010.096
10204NUTF2HTA11_10623_2000001011HumanColorectumAD1.52e-022.81e-01-0.0177
10204NUTF2HTA11_10711_2000001011HumanColorectumAD3.87e-022.31e-010.0338
10204NUTF2HTA11_7696_3000711011HumanColorectumAD3.31e-042.22e-010.0674
10204NUTF2HTA11_6818_2000001021HumanColorectumAD2.49e-053.85e-010.0588
10204NUTF2HTA11_99999970781_79442HumanColorectumMSS1.19e-113.63e-010.294
10204NUTF2HTA11_99999965062_69753HumanColorectumMSI-H2.21e-058.72e-010.3487
10204NUTF2HTA11_99999965104_69814HumanColorectumMSS6.41e-146.50e-010.281
10204NUTF2HTA11_99999971662_82457HumanColorectumMSS5.52e-237.05e-010.3859
10204NUTF2HTA11_99999973899_84307HumanColorectumMSS1.42e-043.45e-010.2585
10204NUTF2HTA11_99999974143_84620HumanColorectumMSS5.05e-062.86e-010.3005
10204NUTF2LZE2DHumanEsophagusHGIN5.37e-042.02e-010.0642
Page: 1 2 3 4 5 6 7 8 

check button Transcriptomic changes along malignancy continuum.
TissueExpression DynamicsAbbreviation
Colorectum (GSE201348)The image shows the transcriptomic changes along malignancy continuum.log2FC in expression of this searched gene in stem-like cells from each diseased tissue sample relative to stem-like cells in normal samples in each tissue plotted against the malignancy continuum. Samples are colored based on if they are from different disease stage.FAP: Familial adenomatous polyposis
CRC: Colorectal cancer
Colorectum (HTA11)The image shows the transcriptomic changes along malignancy continuum.log2FC in expression of this searched gene in stem-like cells from each diseased tissue sample relative to stem-like cells in normal samples in each tissue plotted against the malignancy continuum. Samples are colored based on if they are from different disease stage.AD: Adenomas
SER: Sessile serrated lesions
MSI-H: Microsatellite-high colorectal cancer
MSS: Microsatellite stable colorectal cancer
EsophagusThe image shows the transcriptomic changes along malignancy continuum.log2FC in expression of this searched gene in stem-like cells from each diseased tissue sample relative to stem-like cells in normal samples in each tissue plotted against the malignancy continuum. Samples are colored based on if they are from different disease stage.ESCC: Esophageal squamous cell carcinoma
HGIN: High-grade intraepithelial neoplasias
LGIN: Low-grade intraepithelial neoplasias
LiverThe image shows the transcriptomic changes along malignancy continuum.log2FC in expression of this searched gene in stem-like cells from each diseased tissue sample relative to stem-like cells in normal samples in each tissue plotted against the malignancy continuum. Samples are colored based on if they are from different disease stage.
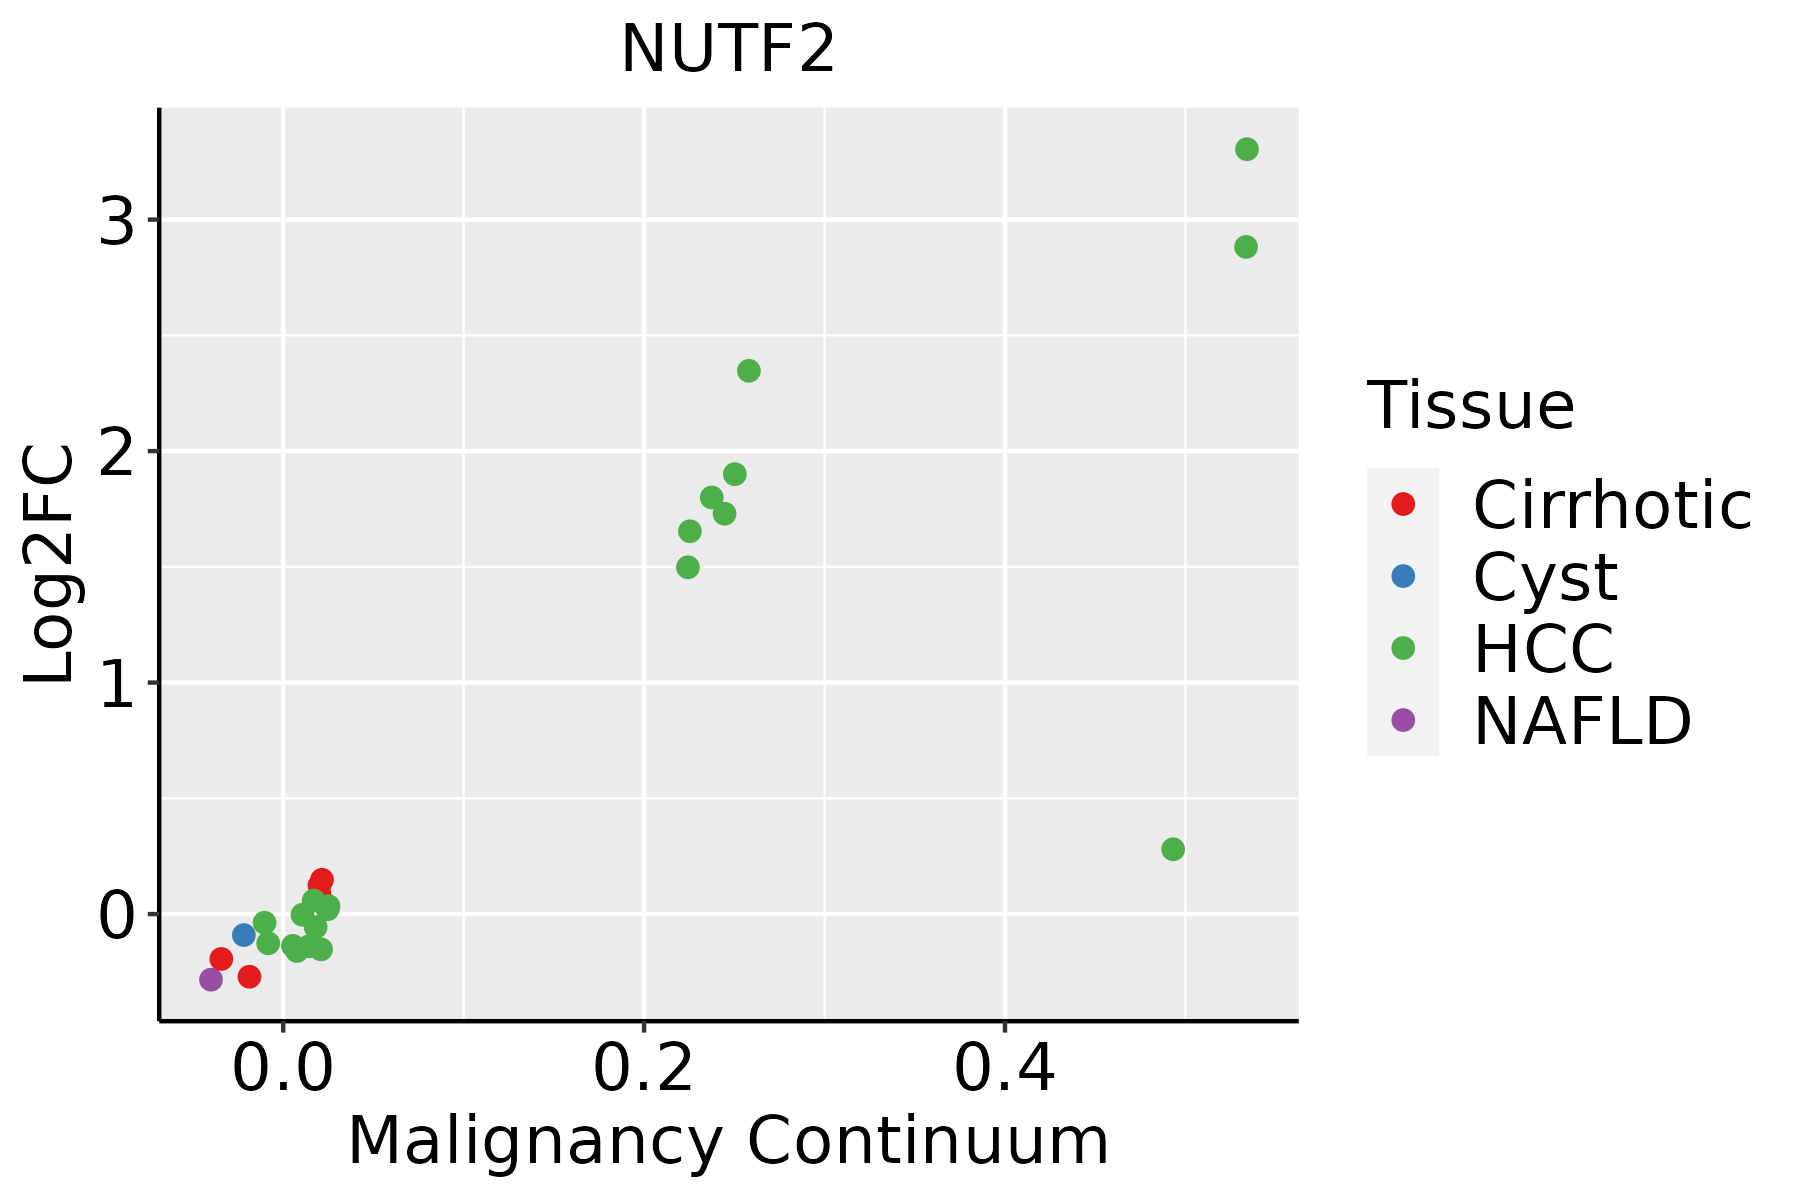
HCC: Hepatocellular carcinoma
NAFLD: Non-alcoholic fatty liver disease
Oral CavityThe image shows the transcriptomic changes along malignancy continuum.log2FC in expression of this searched gene in stem-like cells from each diseased tissue sample relative to stem-like cells in normal samples in each tissue plotted against the malignancy continuum. Samples are colored based on if they are from different disease stage.
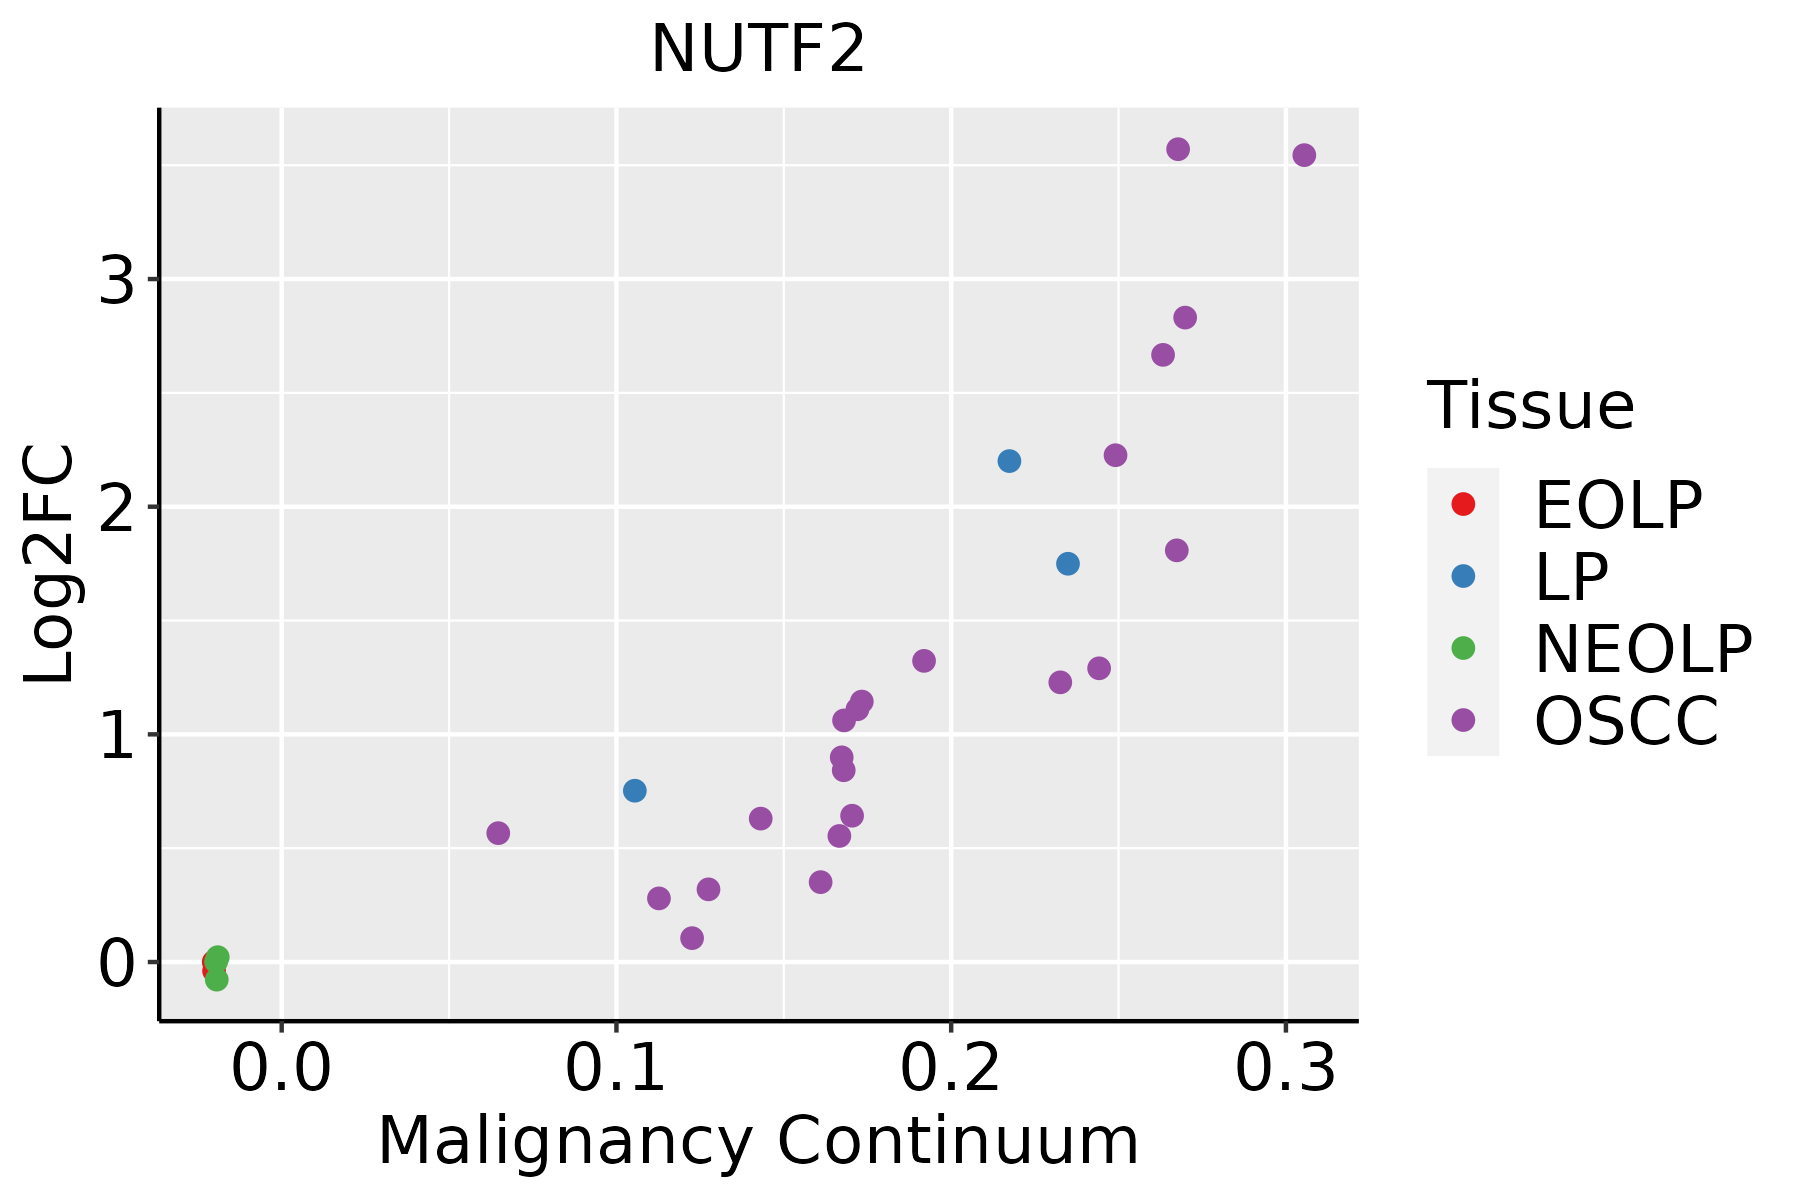
EOLP: Erosive Oral lichen planus
LP: leukoplakia
NEOLP: Non-erosive oral lichen planus
OSCC: Oral squamous cell carcinoma
ProstateThe image shows the transcriptomic changes along malignancy continuum.log2FC in expression of this searched gene in stem-like cells from each diseased tissue sample relative to stem-like cells in normal samples in each tissue plotted against the malignancy continuum. Samples are colored based on if they are from different disease stage.
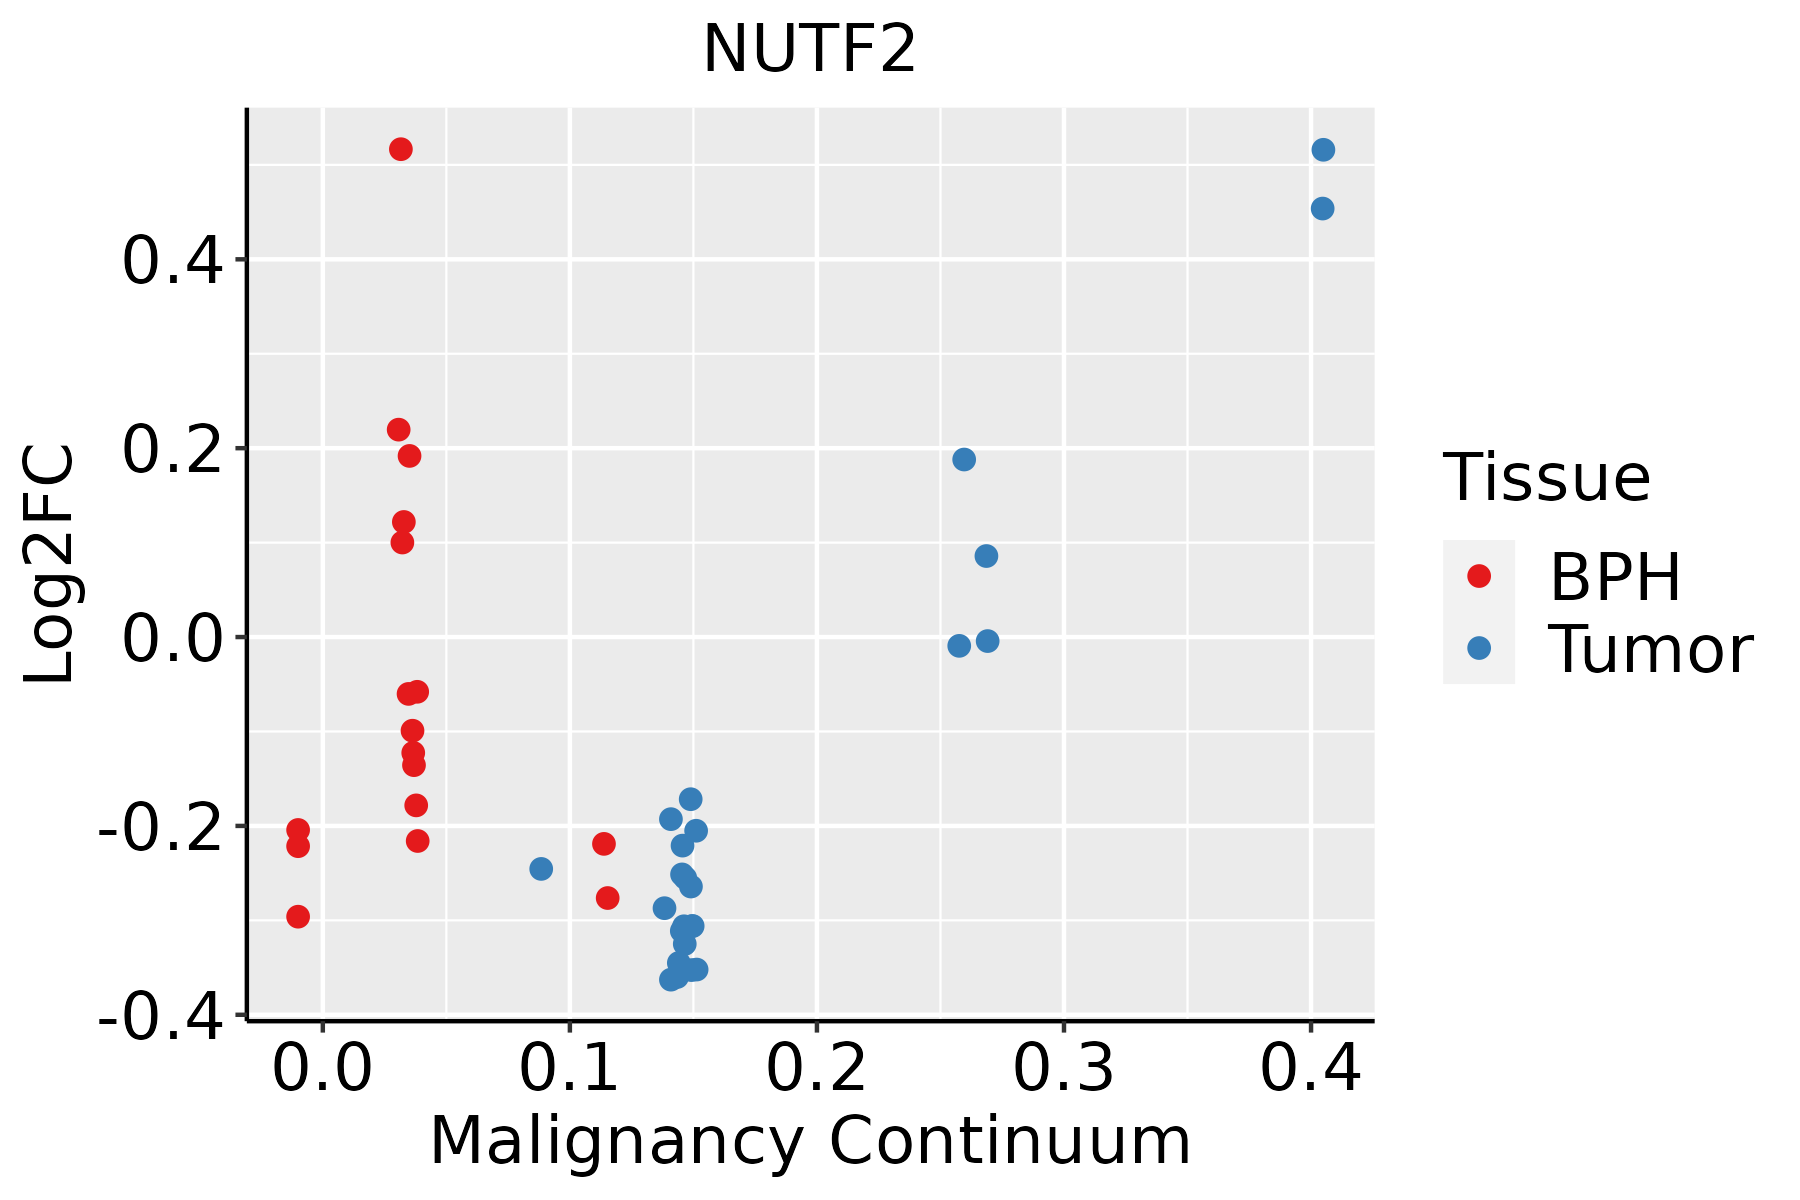
BPH: Benign Prostatic Hyperplasia
SkinThe image shows the transcriptomic changes along malignancy continuum.log2FC in expression of this searched gene in stem-like cells from each diseased tissue sample relative to stem-like cells in normal samples in each tissue plotted against the malignancy continuum. Samples are colored based on if they are from different disease stage.AK: Actinic keratosis
cSCC: Cutaneous squamous cell carcinoma
SCCIS:squamous cell carcinoma in situ
ThyroidThe image shows the transcriptomic changes along malignancy continuum.log2FC in expression of this searched gene in stem-like cells from each diseased tissue sample relative to stem-like cells in normal samples in each tissue plotted against the malignancy continuum. Samples are colored based on if they are from different disease stage.
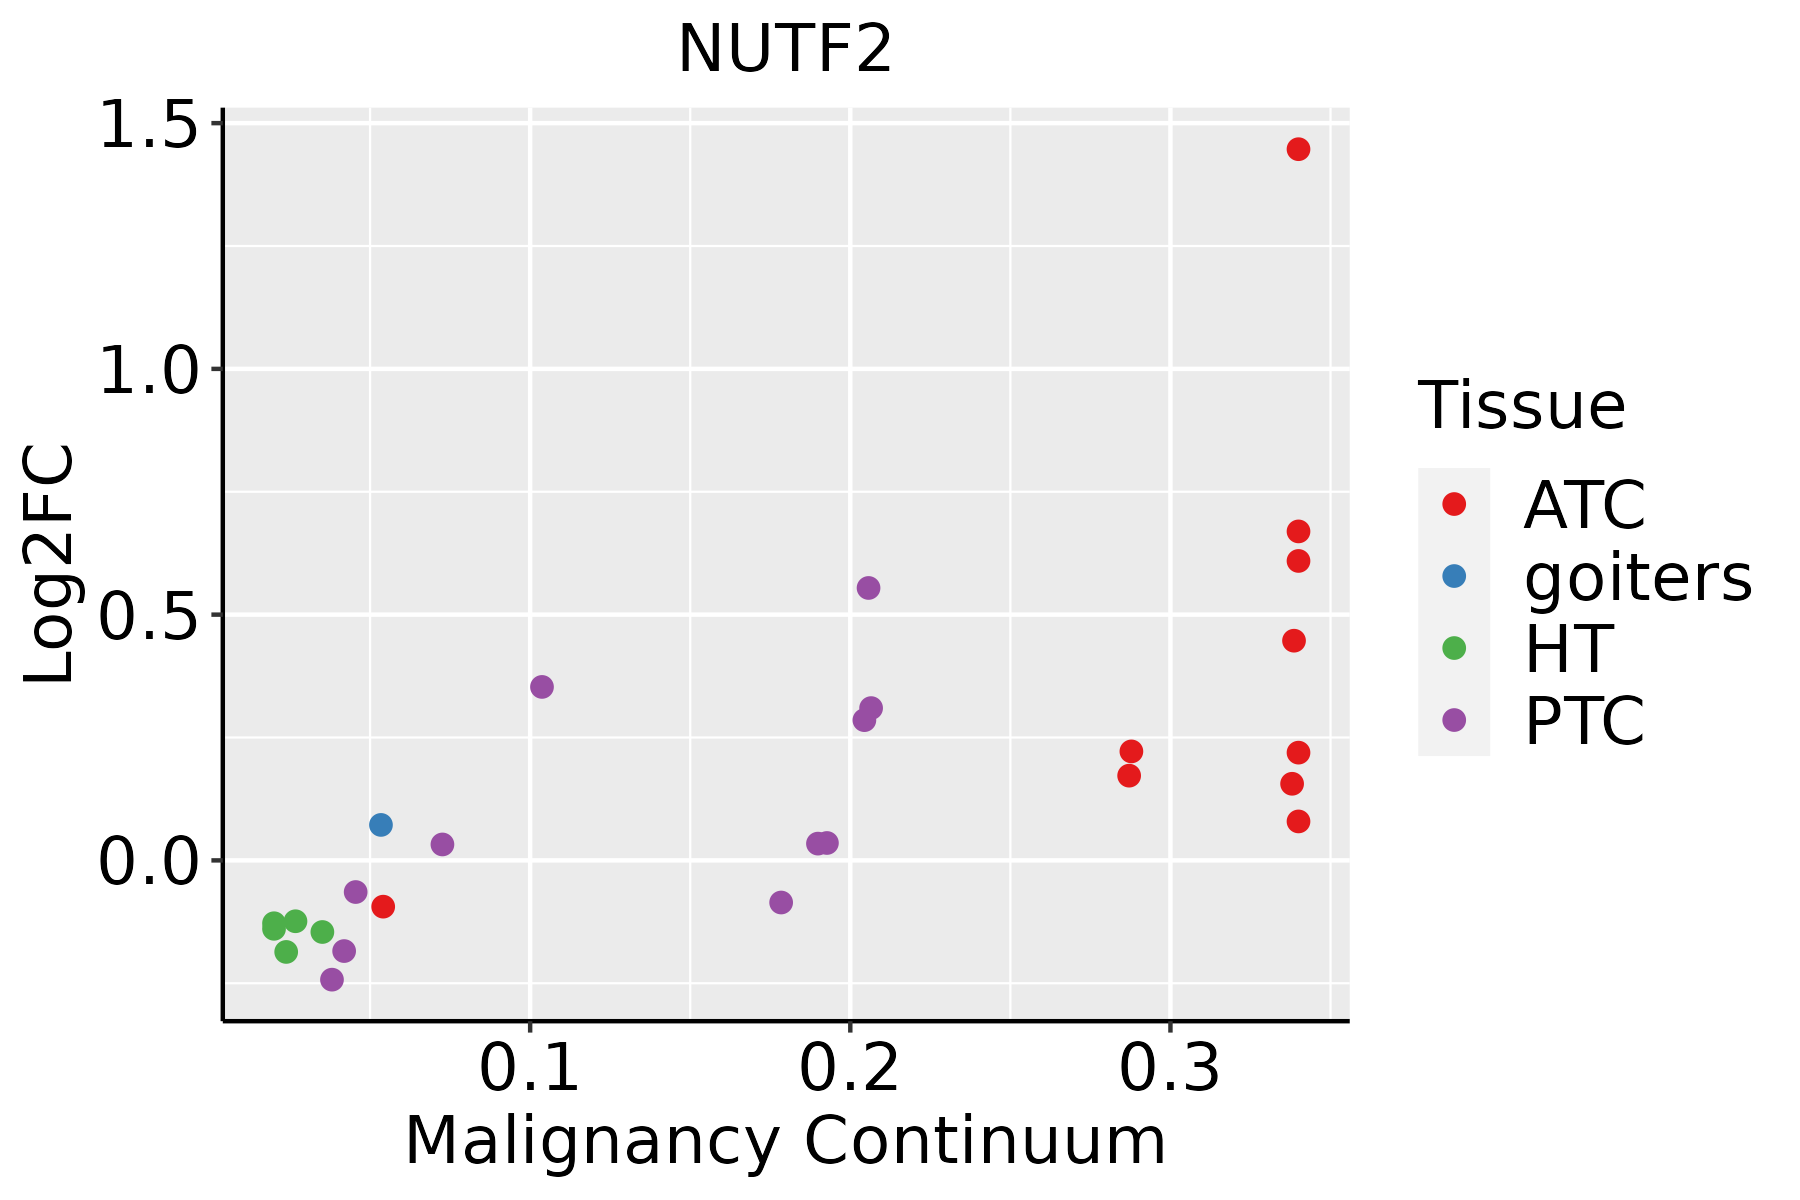
ATC: Anaplastic thyroid cancer
HT: Hashimoto's thyroiditis
PTC: Papillary thyroid cancer
∗log2FC in expression of this searched gene in stem-like cells from each diseased tissue sample relative to stem-like cells in normal samples in each tissue plotted against the malignancy continuum. Samples are colored based on if they are from different disease stage.

Top

Malignant transformation related pathway analysis

check buttonFind out the enriched GO biological processes and KEGG pathways involved in transition from healthy to precancer to cancer
check button Figure of enriched GO biological processes.
TissueDisease StageEnriched GO biological Processes
ColorectumADGO analysis - Figure of enriched GO biological processes: Top 15 enriched GO BP terms are showed in the bar plot of each disease state in each tissue. Each row represents a significant GO biological process which is colored according to the -log10(p.adjust).
ColorectumSERGO analysis - Figure of enriched GO biological processes: Top 15 enriched GO BP terms are showed in the bar plot of each disease state in each tissue. Each row represents a significant GO biological process which is colored according to the -log10(p.adjust).
ColorectumMSSGO analysis - Figure of enriched GO biological processes: Top 15 enriched GO BP terms are showed in the bar plot of each disease state in each tissue. Each row represents a significant GO biological process which is colored according to the -log10(p.adjust).
ColorectumMSI-HGO analysis - Figure of enriched GO biological processes: Top 15 enriched GO BP terms are showed in the bar plot of each disease state in each tissue. Each row represents a significant GO biological process which is colored according to the -log10(p.adjust).
ColorectumFAPGO analysis - Figure of enriched GO biological processes: Top 15 enriched GO BP terms are showed in the bar plot of each disease state in each tissue. Each row represents a significant GO biological process which is colored according to the -log10(p.adjust).
∗Top 15 enriched GO BP terms are showed in the bar plot of each disease state in each tissue. Each row represents a significant GO biological process which is colored according to the -log10(p.adjust).
Page: 1 2 3 4 5 6 7 8 9 

check button Enriched GO biological processes.
GO IDTissueDisease StageDescriptionGene RatioBg Ratiopvaluep.adjustCount
GO:1904951111EsophagusESCCpositive regulation of establishment of protein localization216/8552319/187231.01e-156.86e-14216
GO:0046822110EsophagusESCCregulation of nucleocytoplasmic transport88/8552106/187231.88e-151.19e-1388
GO:009031617EsophagusESCCpositive regulation of intracellular protein transport122/8552160/187232.45e-151.49e-13122
GO:001703818EsophagusESCCprotein import149/8552206/187235.90e-153.31e-13149
GO:0051222111EsophagusESCCpositive regulation of protein transport204/8552303/187231.56e-148.38e-13204
GO:190018018EsophagusESCCregulation of protein localization to nucleus102/8552136/187232.84e-121.13e-10102
GO:190018217EsophagusESCCpositive regulation of protein localization to nucleus70/855287/187232.63e-118.99e-1070
GO:004682417EsophagusESCCpositive regulation of nucleocytoplasmic transport52/855262/187235.40e-101.38e-0852
GO:005117014EsophagusESCCimport into nucleus111/8552159/187235.69e-101.44e-08111
GO:000660613EsophagusESCCprotein import into nucleus108/8552155/187231.16e-092.77e-08108
GO:000661117EsophagusESCCprotein export from nucleus48/855257/187231.92e-094.39e-0848
GO:190458914EsophagusESCCregulation of protein import49/855263/187231.91e-072.97e-0649
GO:190459116EsophagusESCCpositive regulation of protein import36/855243/187232.90e-074.20e-0636
GO:004230614EsophagusESCCregulation of protein import into nucleus46/855260/187239.55e-071.21e-0546
GO:004230715EsophagusESCCpositive regulation of protein import into nucleus34/855241/187239.84e-071.24e-0534
GO:007259412LiverCirrhoticestablishment of protein localization to organelle189/4634422/187231.01e-192.45e-17189
GO:003238611LiverCirrhoticregulation of intracellular transport147/4634337/187231.84e-141.72e-12147
GO:003315711LiverCirrhoticregulation of intracellular protein transport108/4634229/187231.23e-131.04e-11108
GO:190382912LiverCirrhoticpositive regulation of cellular protein localization123/4634276/187234.06e-133.22e-11123
GO:190495112LiverCirrhoticpositive regulation of establishment of protein localization135/4634319/187233.20e-122.28e-10135
Page: 1 2 3 4 5 6 7 8 9 10 11 12 13 14 15 16 17 18 19 20 21 22 23 

check button Enriched KEGG pathways.
Pathway IDTissueDisease StageDescriptionGene RatioBg Ratiopvaluep.adjustqvalueCount
Page: 1 

Top

Cell-cell communication analysis

check buttonIdentification of potential cell-cell interactions between two cell types and their ligand-receptor pairs for different disease states
LigandReceptorLRpairPathwayTissueDisease Stage
Page: 1 

Top

Single-cell gene regulatory network inference analysis

check buttonFind out the significant the regulons (TFs) and the target genes of each regulon across cell types for different disease states
TFCell TypeTissueDisease StageTarget GeneRSSRegulon Activity
∗The dot plots of a searched regulon are shown for all cell subpopulations in each disease state of each tissue based on the regulon specific score inferred using pySCENIC and by calculating the average expression.
Page: 1 

Top

Somatic mutation of malignant transformation related genes

check buttonAnnotation of somatic variants for genes involved in malignant transformation
Hugo SymbolVariant ClassVariant ClassificationdbSNP RSHGVScHGVSpHGVSp ShortSWISSPROTBIOTYPESIFTPolyPhenTumor Sample BarcodeTissueHistologySexAgeStageTherapy TypesDrugsOutcome
NUTF2SNVMissense_Mutationc.209C>Tp.Ala70Valp.A70VP61970protein_codingtolerated(0.26)benign(0.048)TCGA-AR-A1AV-01Breastbreast invasive carcinomaMale>=65I/IIChemotherapycytoxanSD
NUTF2insertionIn_Frame_Insnovelc.172-1_172insGTGCGATTTCGGCTCGCTACAAACCGCCGCCTCCTGGGTTCAp.Ser57_Ser58insValArgPheArgLeuAlaThrAsnArgArgLeuLeuGlySerp.S57_S58insVRFRLATNRRLLGSP61970protein_codingTCGA-A8-A08H-01Breastbreast invasive carcinomaFemale>=65I/IIUnknownUnknownSD
NUTF2deletionFrame_Shift_Delnovelc.267delTp.Lys90ArgfsTer16p.K90Rfs*16P61970protein_codingTCGA-D8-A27V-01Breastbreast invasive carcinomaFemale<65I/IIHormone TherapytamoxiphenSD
NUTF2SNVMissense_Mutationc.110C>Tp.Ser37Leup.S37LP61970protein_codingdeleterious(0)probably_damaging(0.941)TCGA-C5-A1M6-01Cervixcervical & endocervical cancerFemale<65I/IIChemotherapycisplatinPD
NUTF2SNVMissense_Mutationnovelc.27N>Cp.Gln9Hisp.Q9HP61970protein_codingtolerated(0.15)benign(0.003)TCGA-IR-A3LI-01Cervixcervical & endocervical cancerFemale<65I/IIChemotherapycisplatinCR
NUTF2SNVMissense_Mutationnovelc.119N>Tp.Thr40Metp.T40MP61970protein_codingdeleterious(0.03)possibly_damaging(0.596)TCGA-A5-A0G2-01Endometriumuterine corpus endometrioid carcinomaFemale<65III/IVUnknownUnknownSD
NUTF2SNVMissense_Mutationc.209C>Tp.Ala70Valp.A70VP61970protein_codingtolerated(0.26)benign(0.048)TCGA-AJ-A3EL-01Endometriumuterine corpus endometrioid carcinomaFemale<65I/IIUnknownUnknownSD
NUTF2SNVMissense_Mutationrs780123868c.107C>Tp.Ala36Valp.A36VP61970protein_codingtolerated(0.3)benign(0.007)TCGA-D1-A103-01Endometriumuterine corpus endometrioid carcinomaFemale>=65I/IIUnknownUnknownSD
NUTF2SNVMissense_Mutationnovelc.73N>Tp.Asp25Tyrp.D25YP61970protein_codingdeleterious(0)probably_damaging(0.975)TCGA-EO-A22U-01Endometriumuterine corpus endometrioid carcinomaFemale>=65I/IIUnknownUnknownSD
NUTF2SNVMissense_Mutationnovelc.263A>Tp.Gln88Leup.Q88LP61970protein_codingdeleterious(0)probably_damaging(0.993)TCGA-DD-AACZ-01Liverliver hepatocellular carcinomaFemale<65I/IIUnknownUnknownPD
Page: 1 2 

Top

Related drugs of malignant transformation related genes

check buttonIdentification of chemicals and drugs interact with genes involved in malignant transfromation
(DGIdb 4.0)
Entrez IDSymbolCategoryInteraction TypesDrug Claim NameDrug NamePMIDs
Page: 1