
|
|||||
|
 | |
| |
| |
| |
| |
| |
|
Gene: NOC2L |
Gene summary for NOC2L |
| Gene information | Species | Human | Gene symbol | NOC2L | Gene ID | 26155 |
| Gene name | NOC2 like nucleolar associated transcriptional repressor | |
| Gene Alias | NET15 | |
| Cytomap | 1p36.33 | |
| Gene Type | protein-coding | GO ID | GO:0000122 | UniProtAcc | Q9Y3T9 |
Top |
Malignant transformation analysis |
| Identification of the aberrant gene expression in precancerous and cancerous lesions by comparing the gene expression of stem-like cells in diseased tissues with normal stem cells |
| Entrez ID | Symbol | Replicates | Species | Organ | Tissue | Adj P-value | Log2FC | Malignancy |
| 26155 | NOC2L | LZE2T | Human | Esophagus | ESCC | 2.84e-03 | 5.15e-01 | 0.082 |
| 26155 | NOC2L | LZE4T | Human | Esophagus | ESCC | 2.36e-17 | 3.69e-01 | 0.0811 |
| 26155 | NOC2L | LZE7T | Human | Esophagus | ESCC | 3.51e-12 | 7.08e-01 | 0.0667 |
| 26155 | NOC2L | LZE8T | Human | Esophagus | ESCC | 1.18e-04 | 3.15e-01 | 0.067 |
| 26155 | NOC2L | LZE20T | Human | Esophagus | ESCC | 1.25e-07 | 2.62e-01 | 0.0662 |
| 26155 | NOC2L | LZE22T | Human | Esophagus | ESCC | 1.18e-07 | 5.58e-01 | 0.068 |
| 26155 | NOC2L | LZE24T | Human | Esophagus | ESCC | 1.38e-21 | 6.60e-01 | 0.0596 |
| 26155 | NOC2L | P1T-E | Human | Esophagus | ESCC | 5.85e-13 | 6.13e-01 | 0.0875 |
| 26155 | NOC2L | P2T-E | Human | Esophagus | ESCC | 5.52e-39 | 7.13e-01 | 0.1177 |
| 26155 | NOC2L | P4T-E | Human | Esophagus | ESCC | 1.14e-39 | 1.09e+00 | 0.1323 |
| 26155 | NOC2L | P5T-E | Human | Esophagus | ESCC | 2.65e-39 | 7.28e-01 | 0.1327 |
| 26155 | NOC2L | P8T-E | Human | Esophagus | ESCC | 7.74e-47 | 8.52e-01 | 0.0889 |
| 26155 | NOC2L | P9T-E | Human | Esophagus | ESCC | 9.52e-11 | 3.36e-01 | 0.1131 |
| 26155 | NOC2L | P10T-E | Human | Esophagus | ESCC | 5.00e-58 | 9.58e-01 | 0.116 |
| 26155 | NOC2L | P11T-E | Human | Esophagus | ESCC | 4.68e-09 | 6.50e-01 | 0.1426 |
| 26155 | NOC2L | P12T-E | Human | Esophagus | ESCC | 2.40e-27 | 5.49e-01 | 0.1122 |
| 26155 | NOC2L | P15T-E | Human | Esophagus | ESCC | 1.12e-34 | 8.76e-01 | 0.1149 |
| 26155 | NOC2L | P16T-E | Human | Esophagus | ESCC | 6.32e-40 | 5.68e-01 | 0.1153 |
| 26155 | NOC2L | P17T-E | Human | Esophagus | ESCC | 1.25e-13 | 8.99e-01 | 0.1278 |
| 26155 | NOC2L | P19T-E | Human | Esophagus | ESCC | 2.35e-08 | 8.63e-01 | 0.1662 |
| Page: 1 2 3 4 5 6 |
| Tissue | Expression Dynamics | Abbreviation |
| Esophagus | 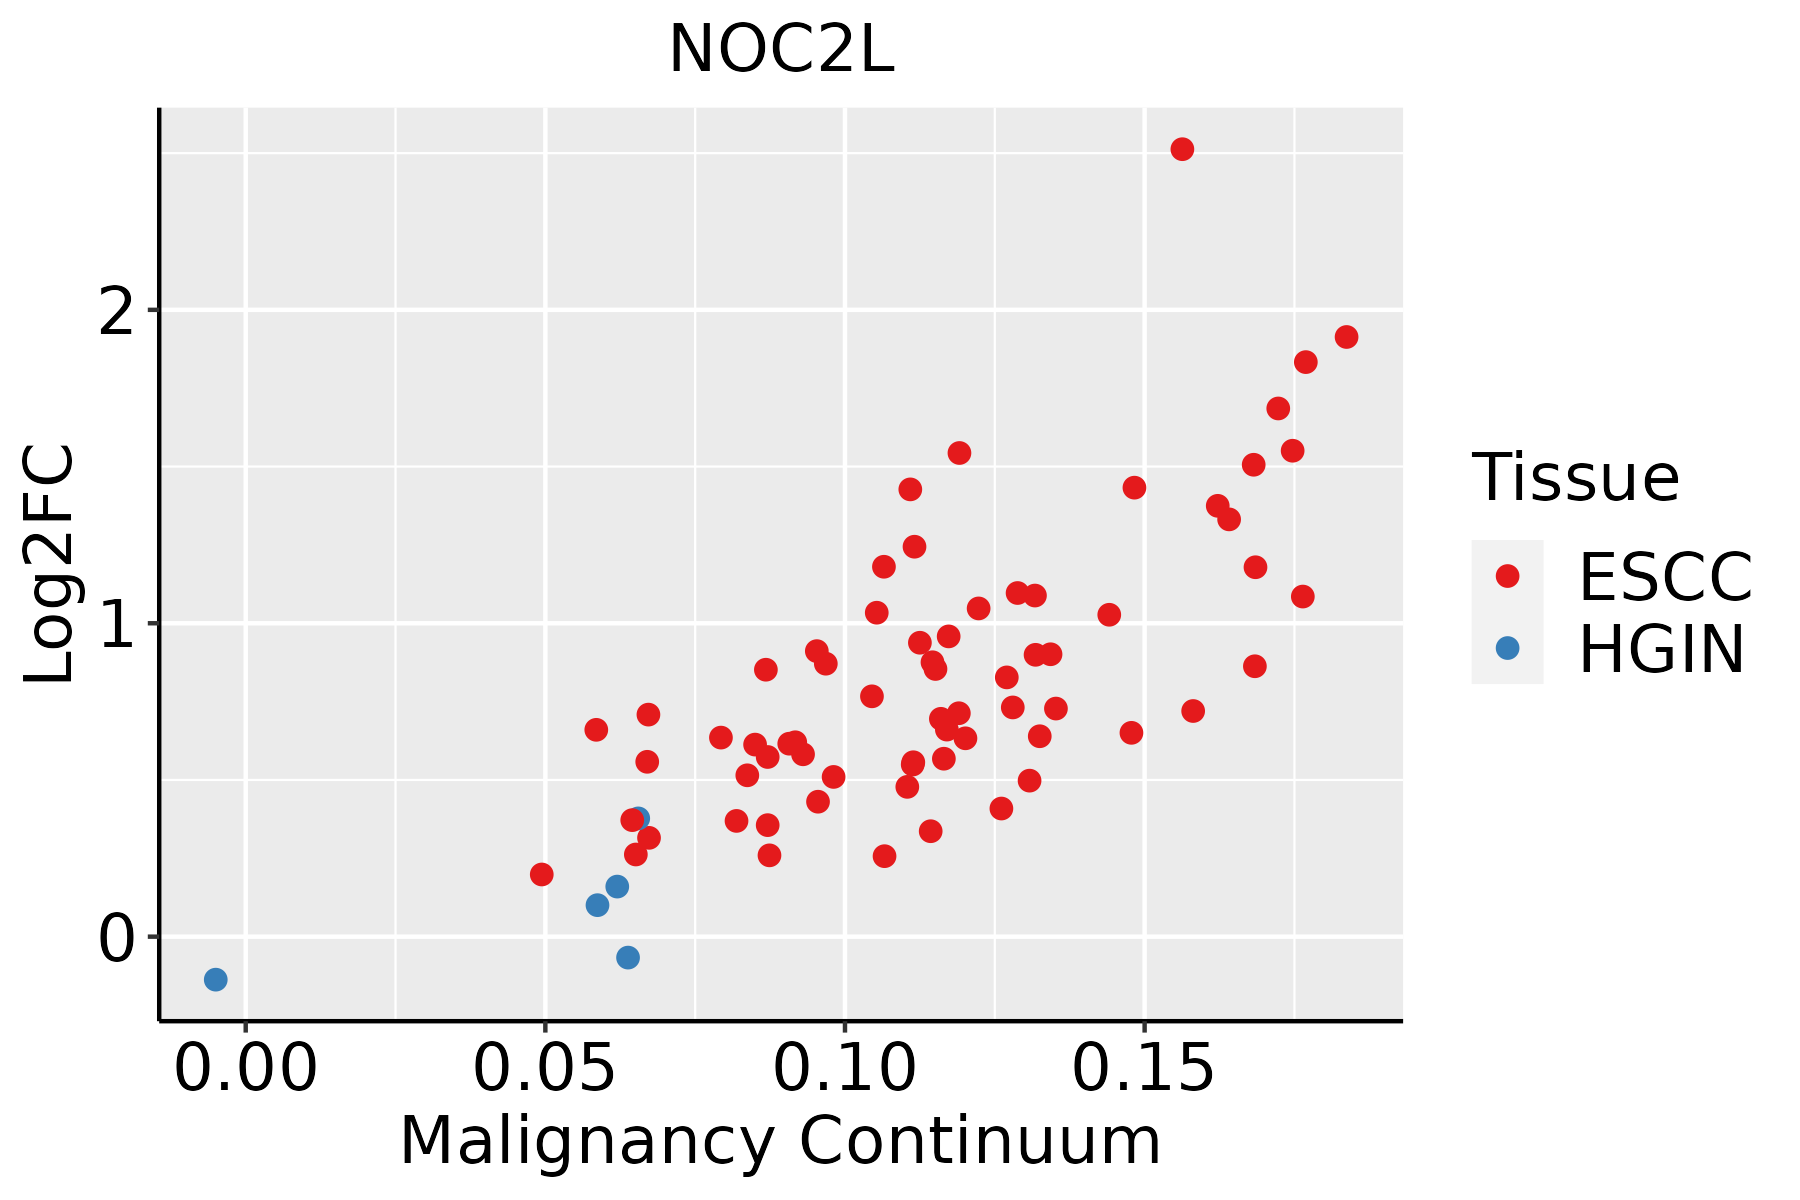 | ESCC: Esophageal squamous cell carcinoma |
| HGIN: High-grade intraepithelial neoplasias | ||
| LGIN: Low-grade intraepithelial neoplasias | ||
| Liver | 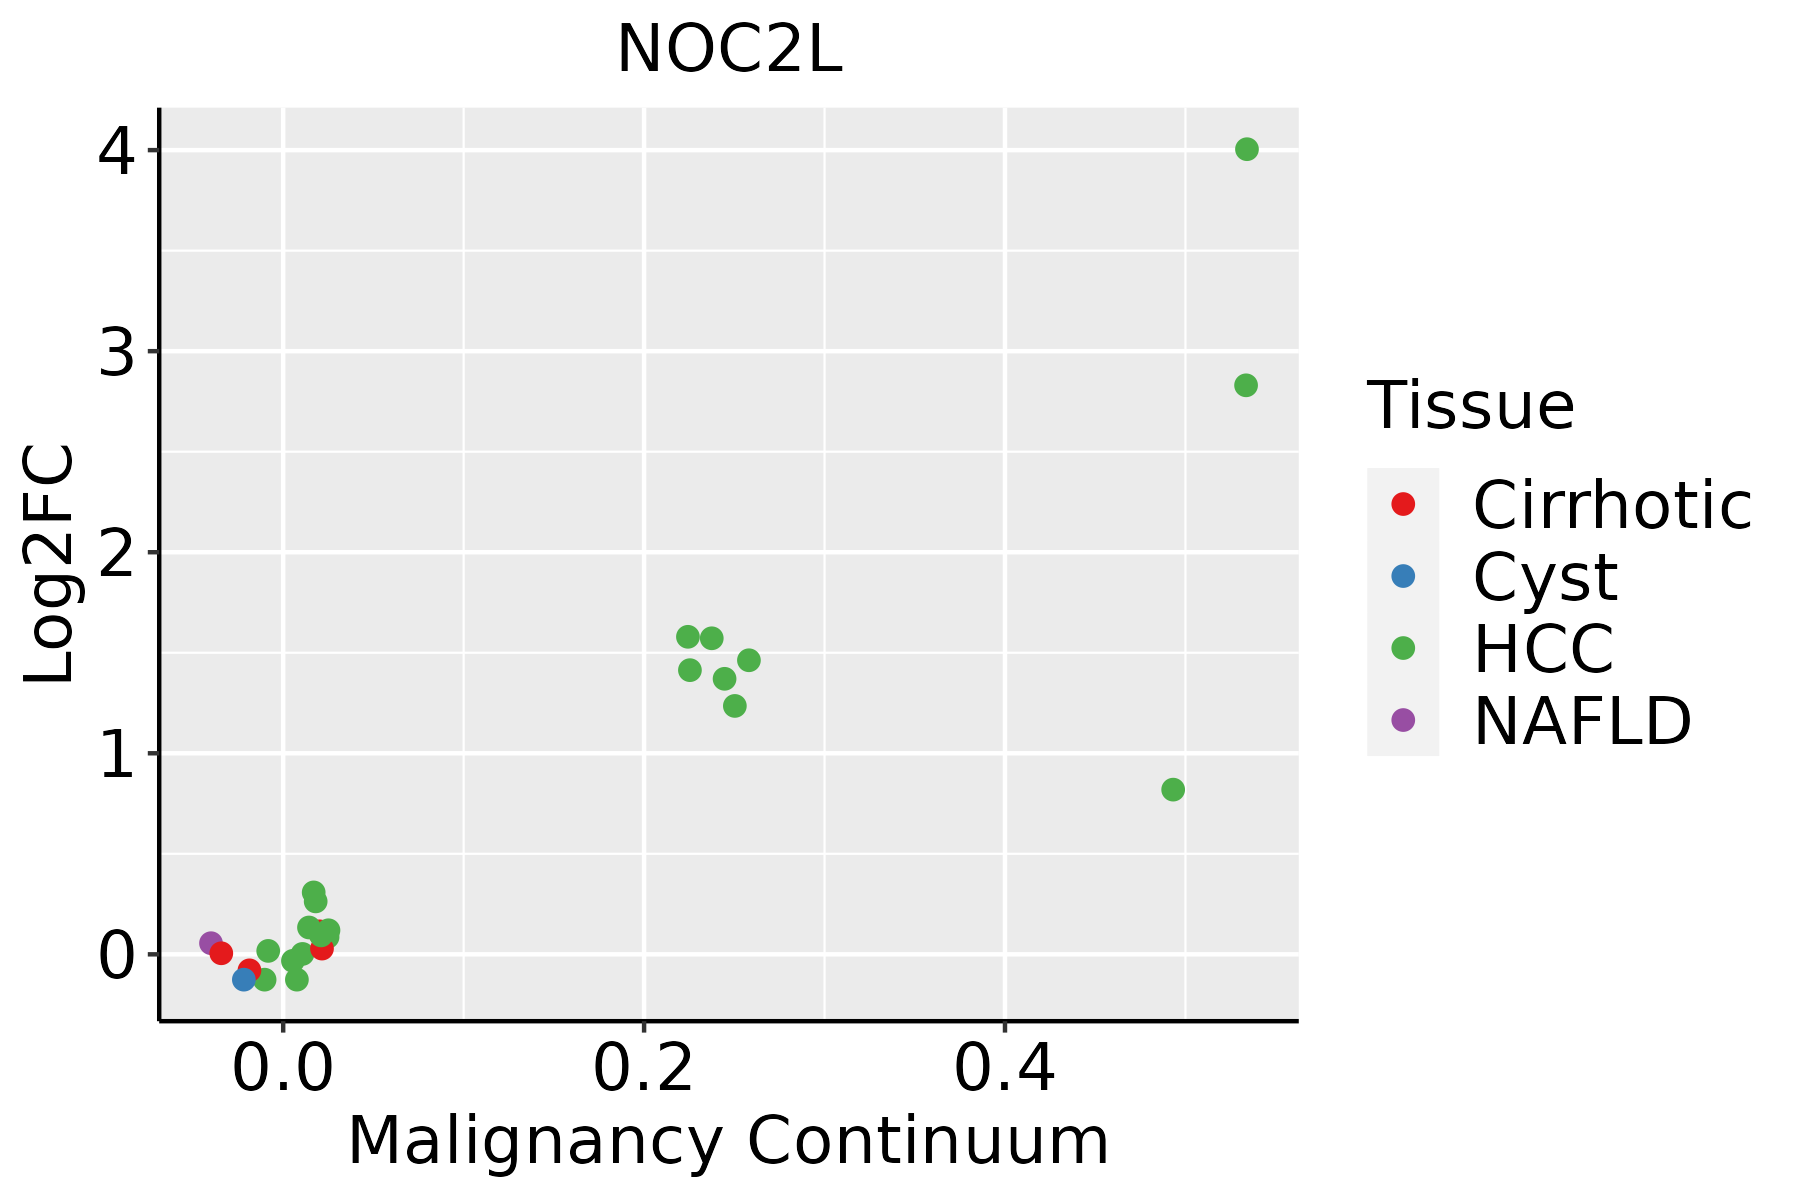 | HCC: Hepatocellular carcinoma |
| NAFLD: Non-alcoholic fatty liver disease | ||
| Oral Cavity | 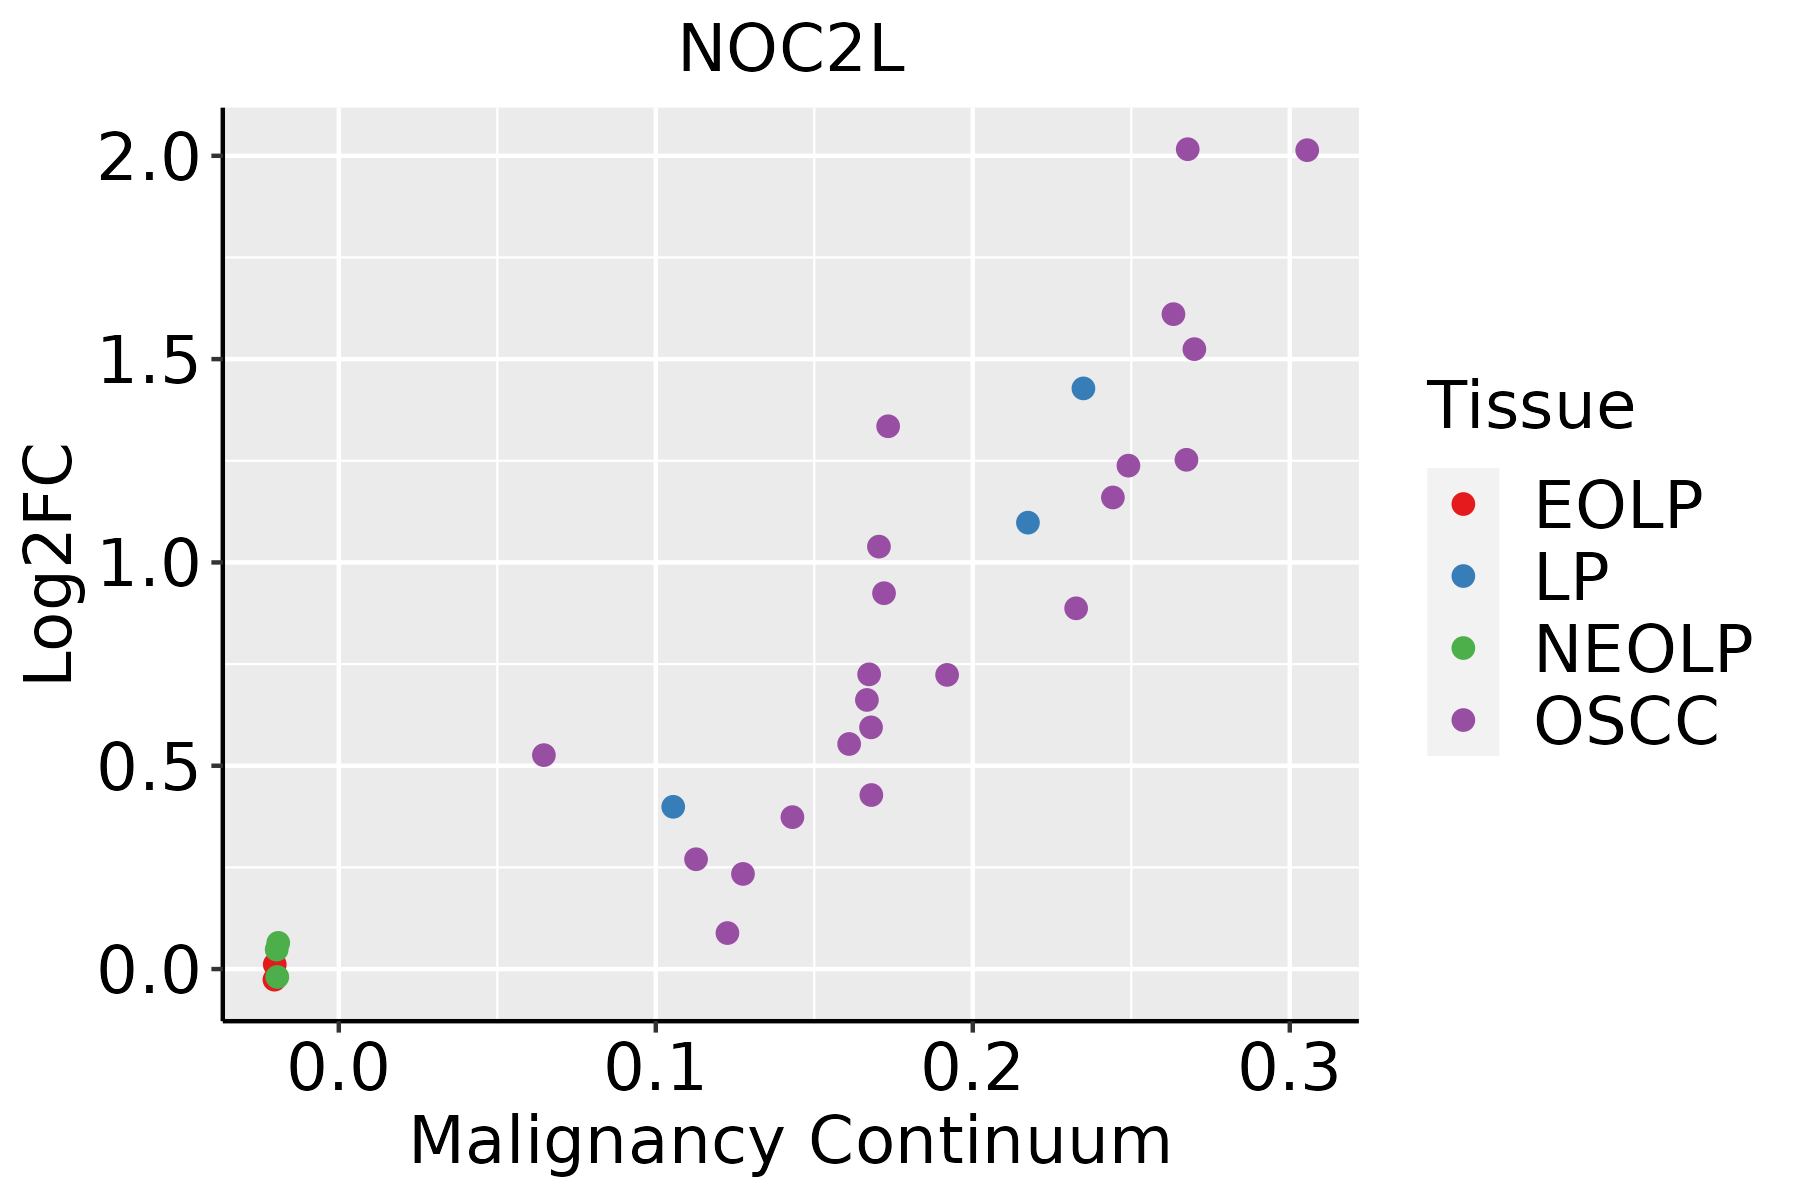 | EOLP: Erosive Oral lichen planus |
| LP: leukoplakia | ||
| NEOLP: Non-erosive oral lichen planus | ||
| OSCC: Oral squamous cell carcinoma | ||
| Skin | 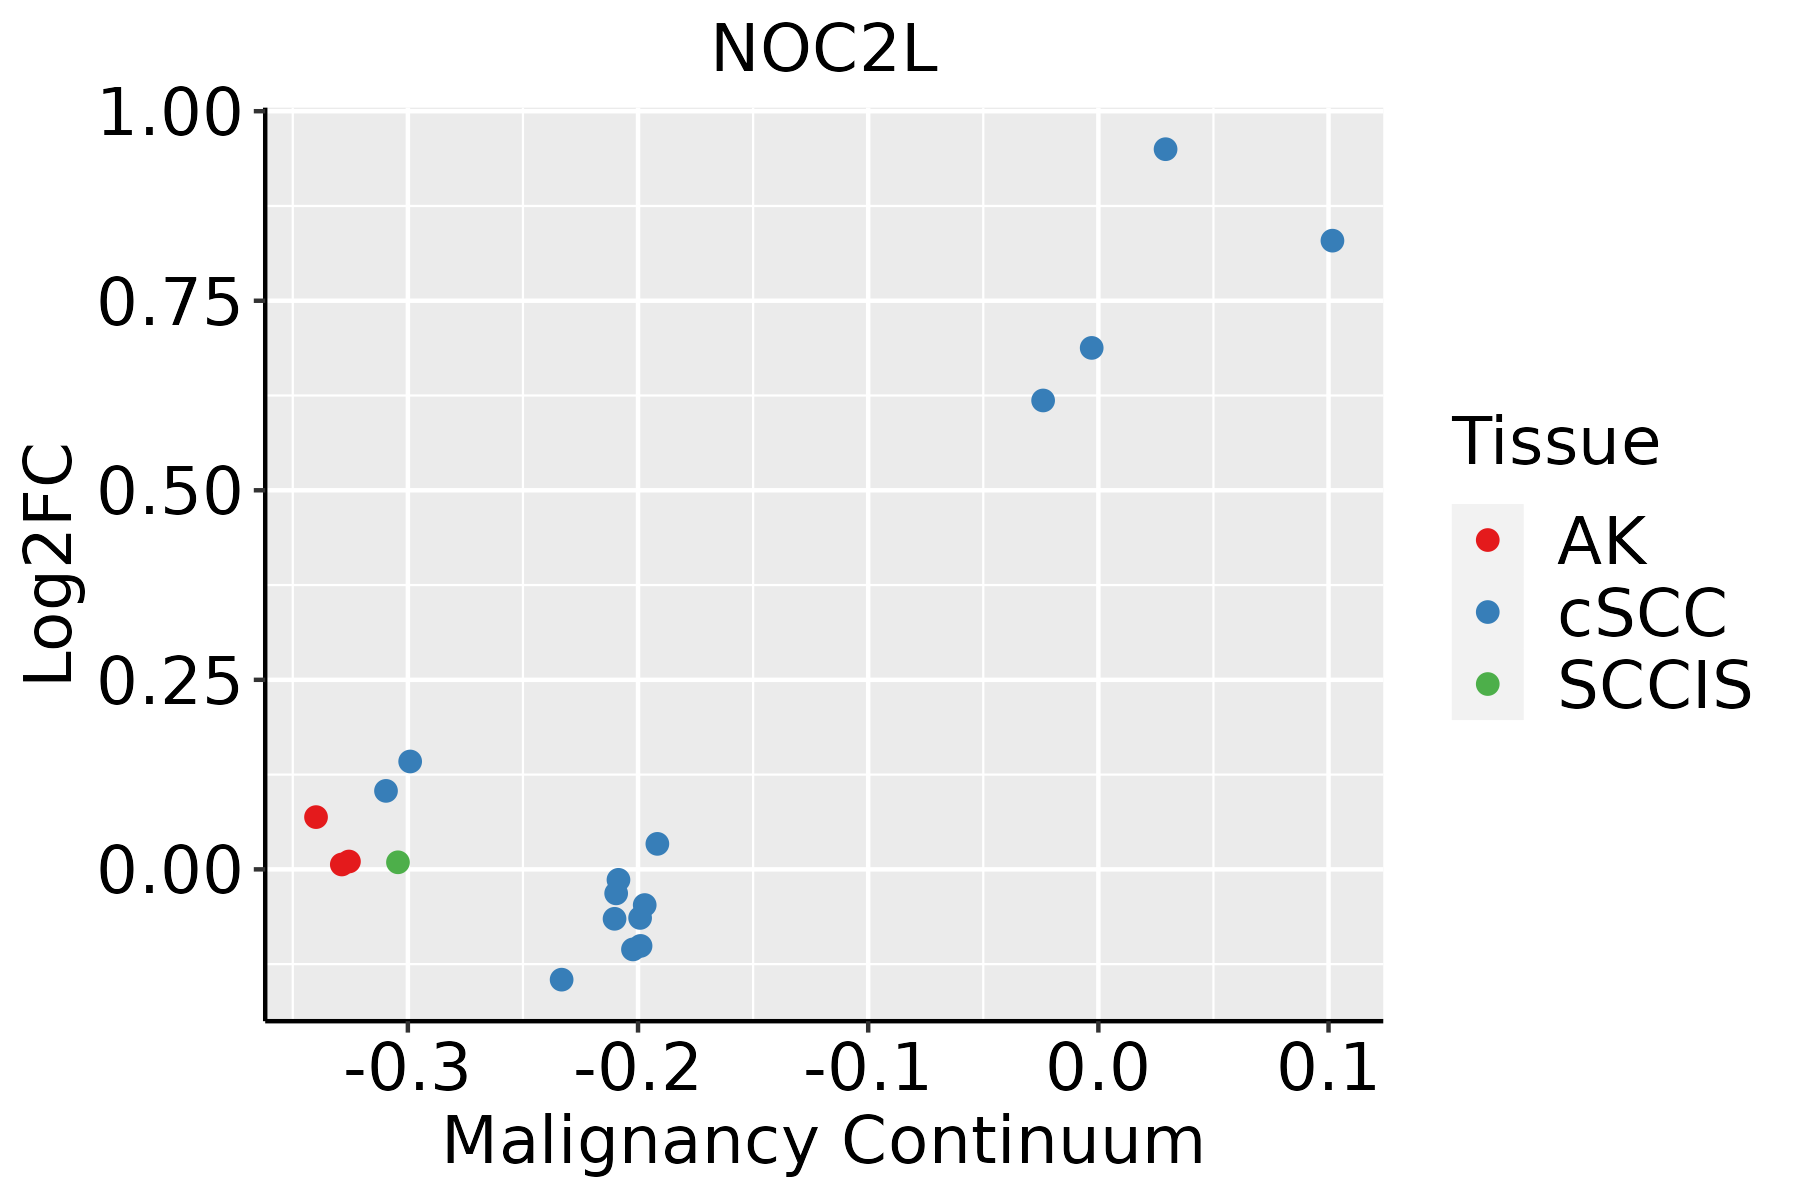 | AK: Actinic keratosis |
| cSCC: Cutaneous squamous cell carcinoma | ||
| SCCIS:squamous cell carcinoma in situ | ||
| Thyroid | 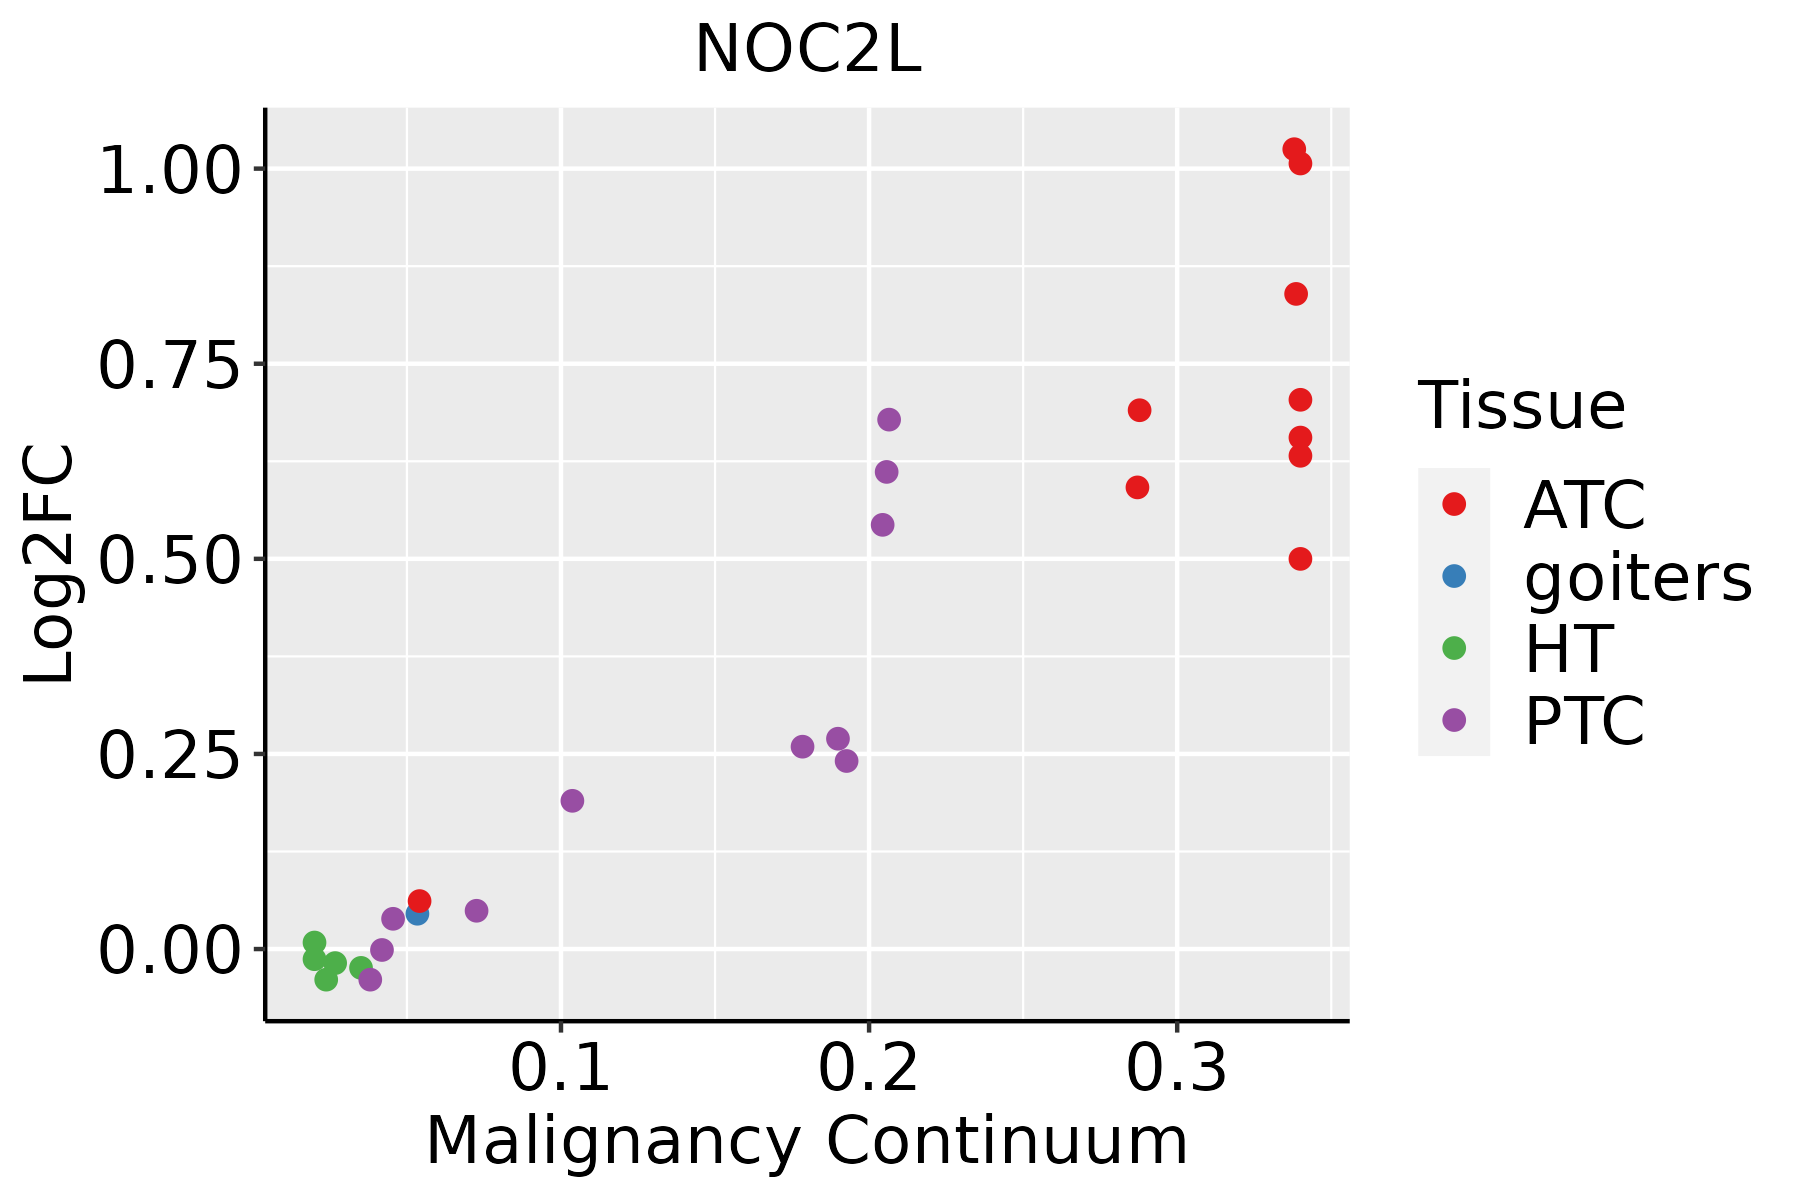 | ATC: Anaplastic thyroid cancer |
| HT: Hashimoto's thyroiditis | ||
| PTC: Papillary thyroid cancer |
| ∗log2FC in expression of this searched gene in stem-like cells from each diseased tissue sample relative to stem-like cells in normal samples in each tissue plotted against the malignancy continuum. Samples are colored based on if they are from different disease stage. |
Top |
Malignant transformation related pathway analysis |
| Find out the enriched GO biological processes and KEGG pathways involved in transition from healthy to precancer to cancer |
| Tissue | Disease Stage | Enriched GO biological Processes |
| Colorectum | AD |  |
| Colorectum | SER |  |
| Colorectum | MSS |  |
| Colorectum | MSI-H |  |
| Colorectum | FAP |  |
| ∗Top 15 enriched GO BP terms are showed in the bar plot of each disease state in each tissue. Each row represents a significant GO biological process which is colored according to the -log10(p.adjust). |
| Page: 1 2 3 4 5 6 7 8 9 |
| GO ID | Tissue | Disease Stage | Description | Gene Ratio | Bg Ratio | pvalue | p.adjust | Count |
| GO:002261329 | Skin | cSCC | ribonucleoprotein complex biogenesis | 302/4864 | 463/18723 | 5.13e-72 | 3.22e-68 | 302 |
| GO:004225428 | Skin | cSCC | ribosome biogenesis | 206/4864 | 299/18723 | 3.33e-55 | 1.04e-51 | 206 |
| GO:009719329 | Skin | cSCC | intrinsic apoptotic signaling pathway | 150/4864 | 288/18723 | 1.76e-21 | 3.34e-19 | 150 |
| GO:004227328 | Skin | cSCC | ribosomal large subunit biogenesis | 57/4864 | 72/18723 | 4.90e-21 | 8.53e-19 | 57 |
| GO:200123329 | Skin | cSCC | regulation of apoptotic signaling pathway | 173/4864 | 356/18723 | 2.25e-20 | 3.44e-18 | 173 |
| GO:200124229 | Skin | cSCC | regulation of intrinsic apoptotic signaling pathway | 96/4864 | 164/18723 | 9.88e-19 | 1.32e-16 | 96 |
| GO:200123429 | Skin | cSCC | negative regulation of apoptotic signaling pathway | 101/4864 | 224/18723 | 4.17e-10 | 1.70e-08 | 101 |
| GO:001657024 | Skin | cSCC | histone modification | 179/4864 | 463/18723 | 9.65e-10 | 3.74e-08 | 179 |
| GO:007147824 | Skin | cSCC | cellular response to radiation | 86/4864 | 186/18723 | 1.81e-09 | 6.67e-08 | 86 |
| GO:007121425 | Skin | cSCC | cellular response to abiotic stimulus | 135/4864 | 331/18723 | 2.26e-09 | 8.11e-08 | 135 |
| GO:010400425 | Skin | cSCC | cellular response to environmental stimulus | 135/4864 | 331/18723 | 2.26e-09 | 8.11e-08 | 135 |
| GO:200124327 | Skin | cSCC | negative regulation of intrinsic apoptotic signaling pathway | 53/4864 | 98/18723 | 2.91e-09 | 1.02e-07 | 53 |
| GO:000941114 | Skin | cSCC | response to UV | 68/4864 | 149/18723 | 1.62e-07 | 3.62e-06 | 68 |
| GO:003464414 | Skin | cSCC | cellular response to UV | 46/4864 | 90/18723 | 2.95e-07 | 6.01e-06 | 46 |
| GO:003105615 | Skin | cSCC | regulation of histone modification | 68/4864 | 152/18723 | 4.07e-07 | 7.93e-06 | 68 |
| GO:000931424 | Skin | cSCC | response to radiation | 166/4864 | 456/18723 | 4.37e-07 | 8.41e-06 | 166 |
| GO:000647314 | Skin | cSCC | protein acetylation | 84/4864 | 201/18723 | 6.94e-07 | 1.29e-05 | 84 |
| GO:001839414 | Skin | cSCC | peptidyl-lysine acetylation | 72/4864 | 169/18723 | 1.81e-06 | 3.02e-05 | 72 |
| GO:001820515 | Skin | cSCC | peptidyl-lysine modification | 137/4864 | 376/18723 | 4.09e-06 | 6.09e-05 | 137 |
| GO:000632519 | Skin | cSCC | chromatin organization | 147/4864 | 409/18723 | 4.41e-06 | 6.52e-05 | 147 |
| Page: 1 2 3 4 5 6 7 8 9 10 11 12 13 |
| Pathway ID | Tissue | Disease Stage | Description | Gene Ratio | Bg Ratio | pvalue | p.adjust | qvalue | Count |
| Page: 1 |
Top |
Cell-cell communication analysis |
| Identification of potential cell-cell interactions between two cell types and their ligand-receptor pairs for different disease states |
| Ligand | Receptor | LRpair | Pathway | Tissue | Disease Stage |
| Page: 1 |
Top |
Single-cell gene regulatory network inference analysis |
| Find out the significant the regulons (TFs) and the target genes of each regulon across cell types for different disease states |
| TF | Cell Type | Tissue | Disease Stage | Target Gene | RSS | Regulon Activity |
| ∗The dot plots of a searched regulon are shown for all cell subpopulations in each disease state of each tissue based on the regulon specific score inferred using pySCENIC and by calculating the average expression. |
| Page: 1 |
Top |
Somatic mutation of malignant transformation related genes |
| Annotation of somatic variants for genes involved in malignant transformation |
| Hugo Symbol | Variant Class | Variant Classification | dbSNP RS | HGVSc | HGVSp | HGVSp Short | SWISSPROT | BIOTYPE | SIFT | PolyPhen | Tumor Sample Barcode | Tissue | Histology | Sex | Age | Stage | Therapy Types | Drugs | Outcome |
| NOC2L | SNV | Missense_Mutation | c.576N>T | p.Glu192Asp | p.E192D | Q9Y3T9 | protein_coding | tolerated(0.37) | benign(0.015) | TCGA-A8-A08H-01 | Breast | breast invasive carcinoma | Female | >=65 | I/II | Unknown | Unknown | SD | |
| NOC2L | SNV | Missense_Mutation | rs144525853 | c.469T>C | p.Trp157Arg | p.W157R | Q9Y3T9 | protein_coding | deleterious(0) | probably_damaging(0.99) | TCGA-GM-A2DM-01 | Breast | breast invasive carcinoma | Female | <65 | I/II | Chemotherapy | taxol | CR |
| NOC2L | SNV | Missense_Mutation | c.468A>T | p.Arg156Ser | p.R156S | Q9Y3T9 | protein_coding | tolerated(0.16) | benign(0.079) | TCGA-GM-A2DM-01 | Breast | breast invasive carcinoma | Female | <65 | I/II | Chemotherapy | taxol | CR | |
| NOC2L | insertion | Nonsense_Mutation | novel | c.52_53insTATGTTGGTGAGTTGTGCAAAAAT | p.Glu18delinsValCysTrpTerValValGlnLysTer | p.E18delinsVCW*VVQK* | Q9Y3T9 | protein_coding | TCGA-A8-A06P-01 | Breast | breast invasive carcinoma | Female | <65 | III/IV | Unspecific | SD | |||
| NOC2L | insertion | Frame_Shift_Ins | novel | c.535_536insGACACTTT | p.Ala179GlyfsTer110 | p.A179Gfs*110 | Q9Y3T9 | protein_coding | TCGA-A8-A07J-01 | Breast | breast invasive carcinoma | Female | <65 | I/II | Chemotherapy | 5-fluorouracil | CR | ||
| NOC2L | deletion | Frame_Shift_Del | novel | c.1438delC | p.Leu480TrpfsTer16 | p.L480Wfs*16 | Q9Y3T9 | protein_coding | TCGA-EW-A2FV-01 | Breast | breast invasive carcinoma | Female | <65 | III/IV | Chemotherapy | docetaxel | SD | ||
| NOC2L | SNV | Missense_Mutation | rs777608108 | c.1556G>A | p.Arg519Gln | p.R519Q | Q9Y3T9 | protein_coding | deleterious(0.02) | benign(0.058) | TCGA-2W-A8YY-01 | Cervix | cervical & endocervical cancer | Female | <65 | I/II | Chemotherapy | cisplatin | CR |
| NOC2L | SNV | Missense_Mutation | novel | c.133N>C | p.Glu45Gln | p.E45Q | Q9Y3T9 | protein_coding | tolerated(0.53) | benign(0.225) | TCGA-JW-A5VL-01 | Cervix | cervical & endocervical cancer | Female | <65 | I/II | Unknown | Unknown | SD |
| NOC2L | SNV | Missense_Mutation | rs112703241 | c.1378N>T | p.Arg460Cys | p.R460C | Q9Y3T9 | protein_coding | deleterious(0) | probably_damaging(1) | TCGA-A6-6653-01 | Colorectum | colon adenocarcinoma | Male | >=65 | I/II | Unknown | Unknown | SD |
| NOC2L | SNV | Missense_Mutation | rs773184606 | c.326N>T | p.Pro109Leu | p.P109L | Q9Y3T9 | protein_coding | tolerated(0.22) | benign(0.031) | TCGA-AY-4071-01 | Colorectum | colon adenocarcinoma | Female | <65 | I/II | Unknown | Unknown | SD |
| Page: 1 2 3 4 5 6 |
Top |
Related drugs of malignant transformation related genes |
| Identification of chemicals and drugs interact with genes involved in malignant transfromation |
| (DGIdb 4.0) |
| Entrez ID | Symbol | Category | Interaction Types | Drug Claim Name | Drug Name | PMIDs |
| Page: 1 |

Copyright 2023-Present -The University of Texas Health Science Center at Houston |