
|
|||||
|
 | |
| |
| |
| |
| |
| |
|
Gene: MSX1 |
Gene summary for MSX1 |
| Gene information | Species | Human | Gene symbol | MSX1 | Gene ID | 4487 |
| Gene name | msh homeobox 1 | |
| Gene Alias | ECTD3 | |
| Cytomap | 4p16.2 | |
| Gene Type | protein-coding | GO ID | GO:0000003 | UniProtAcc | P28360 |
Top |
Malignant transformation analysis |
| Identification of the aberrant gene expression in precancerous and cancerous lesions by comparing the gene expression of stem-like cells in diseased tissues with normal stem cells |
| Entrez ID | Symbol | Replicates | Species | Organ | Tissue | Adj P-value | Log2FC | Malignancy |
| 4487 | MSX1 | AEH-subject3 | Human | Endometrium | AEH | 1.20e-09 | 4.70e-01 | -0.2576 |
| 4487 | MSX1 | EEC-subject3 | Human | Endometrium | EEC | 5.34e-05 | -1.56e-01 | -0.2525 |
| 4487 | MSX1 | EEC-subject5 | Human | Endometrium | EEC | 8.71e-06 | 3.82e-01 | -0.249 |
| 4487 | MSX1 | GSM5276934 | Human | Endometrium | EEC | 3.70e-23 | -6.98e-01 | -0.0913 |
| 4487 | MSX1 | GSM5276935 | Human | Endometrium | EEC | 2.29e-47 | 8.68e-01 | -0.123 |
| 4487 | MSX1 | GSM6177620_NYU_UCEC1_lib1_lib1 | Human | Endometrium | EEC | 5.43e-19 | 3.70e-01 | -0.1869 |
| 4487 | MSX1 | GSM6177620_NYU_UCEC1_lib2_lib2 | Human | Endometrium | EEC | 1.83e-07 | 5.47e-02 | -0.1875 |
| 4487 | MSX1 | GSM6177620_NYU_UCEC1_lib3_lib3 | Human | Endometrium | EEC | 3.61e-18 | 2.96e-01 | -0.1883 |
| 4487 | MSX1 | GSM6177621_NYU_UCEC2_lib1_lib1 | Human | Endometrium | EEC | 7.32e-39 | 7.89e-01 | -0.1934 |
| 4487 | MSX1 | GSM6177622_NYU_UCEC3_lib1_lib1 | Human | Endometrium | EEC | 1.13e-14 | -3.61e-02 | -0.1917 |
| 4487 | MSX1 | GSM6177622_NYU_UCEC3_lib2_lib2 | Human | Endometrium | EEC | 7.91e-14 | -3.32e-02 | -0.1916 |
| 4487 | MSX1 | HCC2_Meng | Human | Liver | HCC | 4.33e-03 | 5.24e-02 | 0.0107 |
| 4487 | MSX1 | HCC1 | Human | Liver | HCC | 1.89e-02 | 1.26e+00 | 0.5336 |
| 4487 | MSX1 | HCC2 | Human | Liver | HCC | 5.93e-12 | 1.40e+00 | 0.5341 |
| 4487 | MSX1 | HCC5 | Human | Liver | HCC | 1.75e-08 | 3.33e-01 | 0.4932 |
| 4487 | MSX1 | S014 | Human | Liver | HCC | 5.98e-30 | 1.31e+00 | 0.2254 |
| 4487 | MSX1 | S015 | Human | Liver | HCC | 9.34e-34 | 1.42e+00 | 0.2375 |
| 4487 | MSX1 | S016 | Human | Liver | HCC | 1.48e-31 | 1.15e+00 | 0.2243 |
| 4487 | MSX1 | S027 | Human | Liver | HCC | 9.18e-07 | 3.32e-01 | 0.2446 |
| 4487 | MSX1 | S028 | Human | Liver | HCC | 8.36e-16 | 4.02e-01 | 0.2503 |
| Page: 1 2 |
| Tissue | Expression Dynamics | Abbreviation |
| Endometrium | 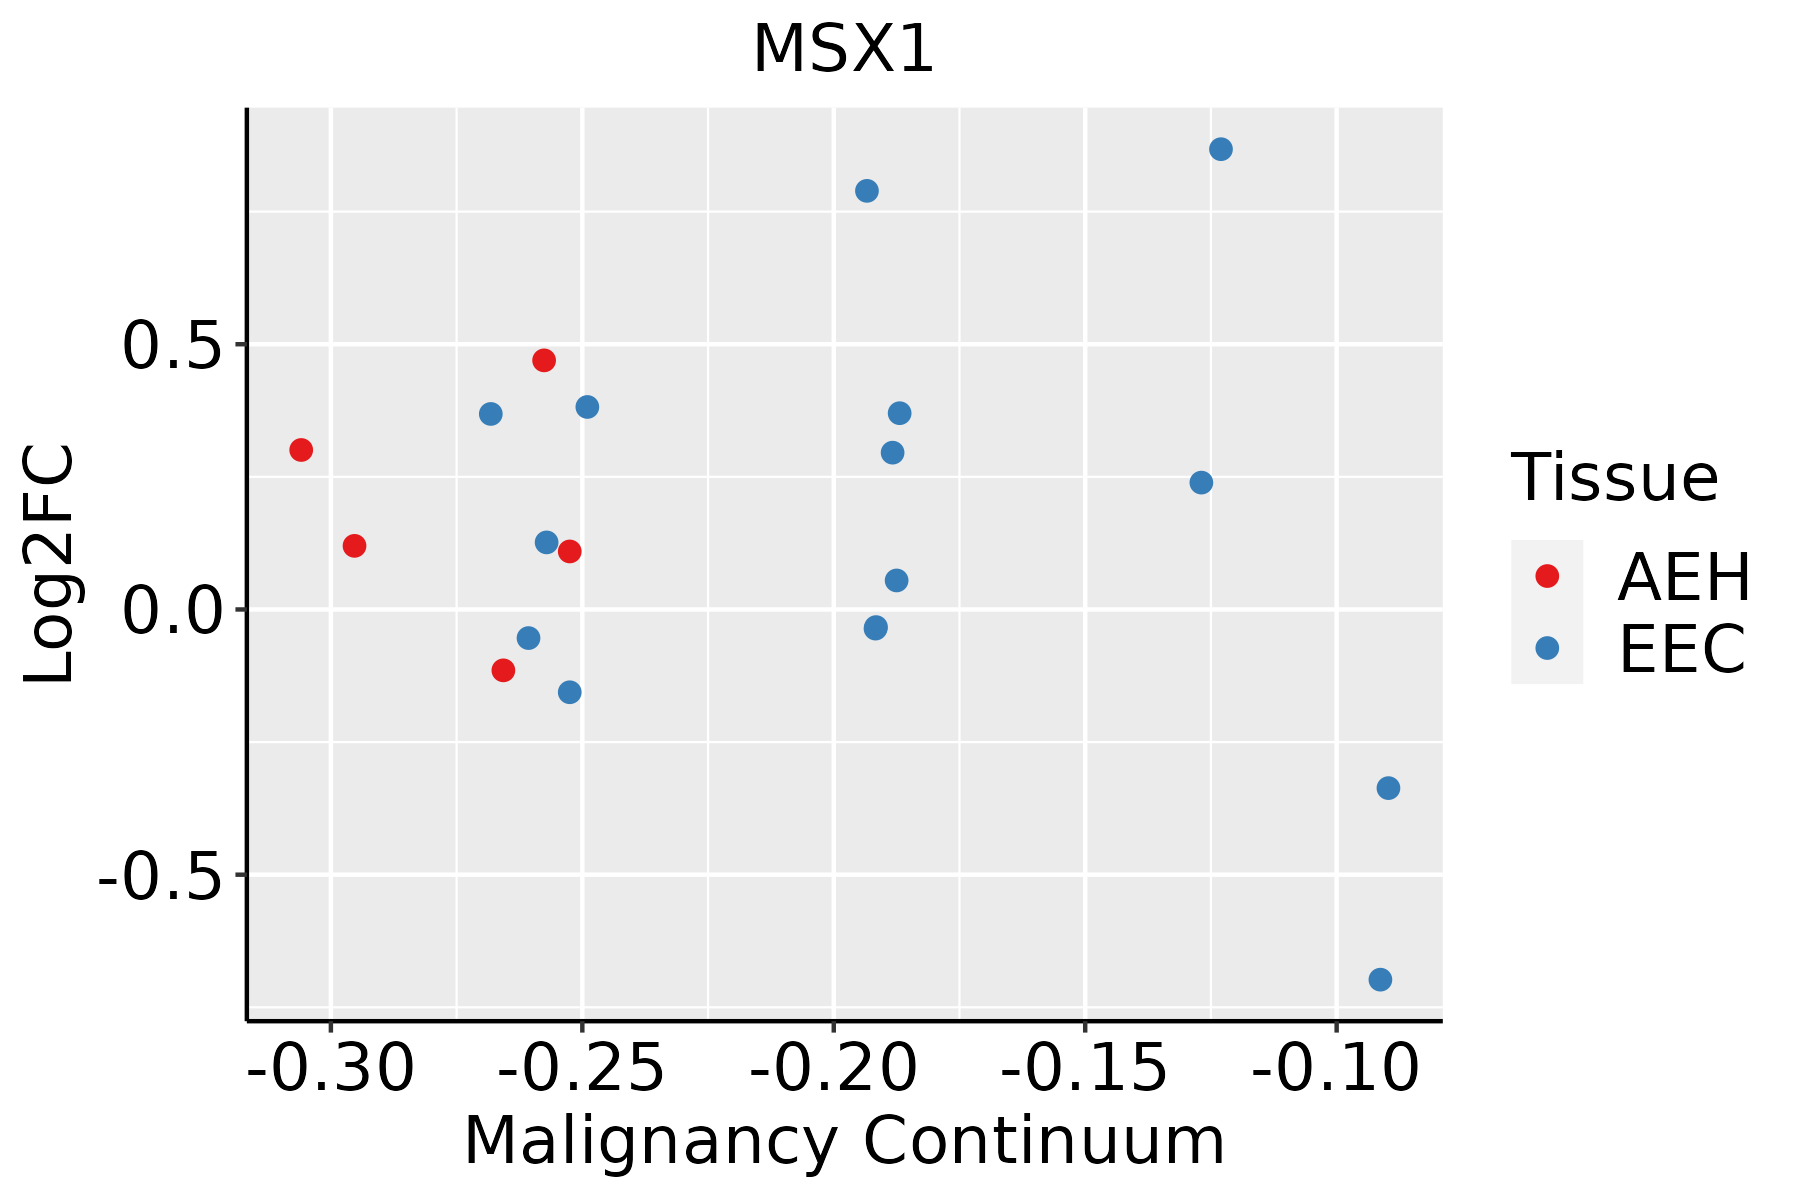 | AEH: Atypical endometrial hyperplasia |
| EEC: Endometrioid Cancer | ||
| Liver |  | HCC: Hepatocellular carcinoma |
| NAFLD: Non-alcoholic fatty liver disease | ||
| Thyroid | 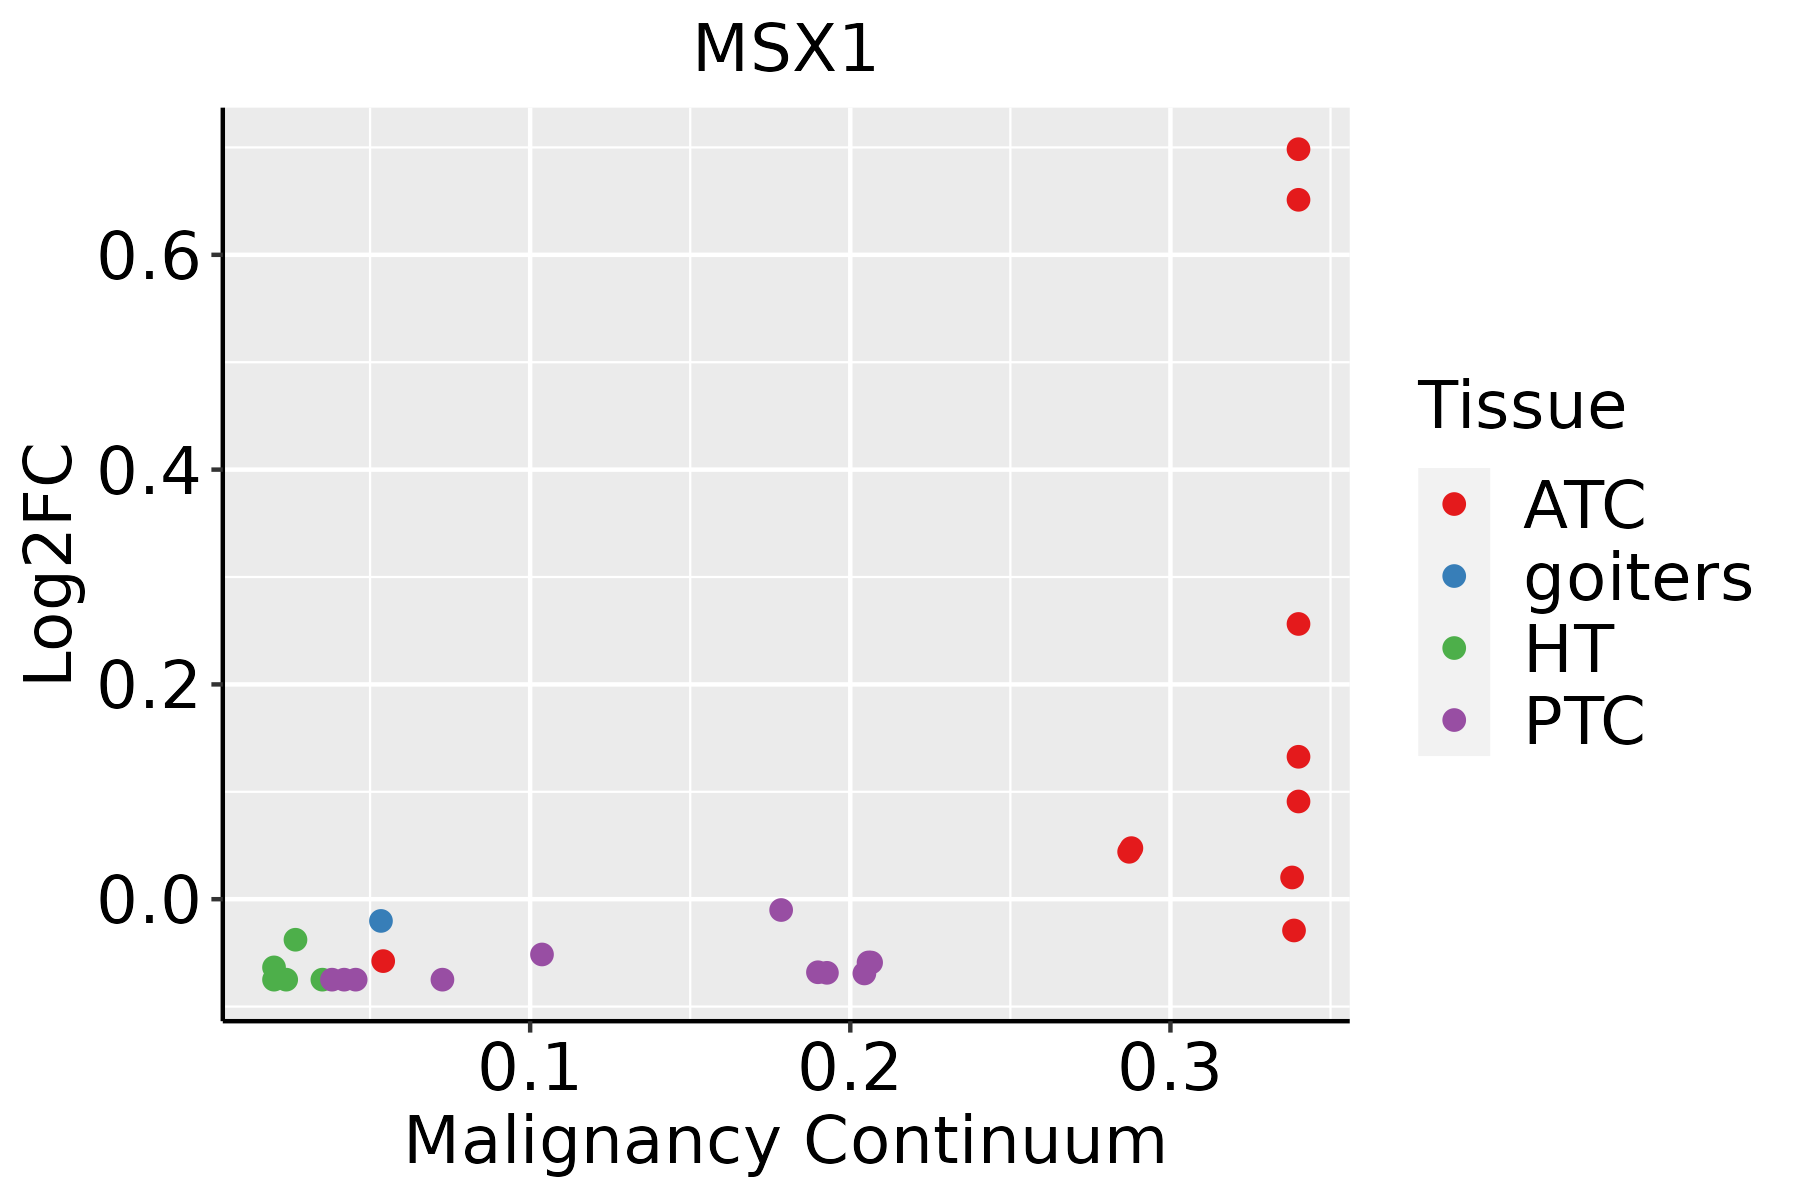 | ATC: Anaplastic thyroid cancer |
| HT: Hashimoto's thyroiditis | ||
| PTC: Papillary thyroid cancer |
| ∗log2FC in expression of this searched gene in stem-like cells from each diseased tissue sample relative to stem-like cells in normal samples in each tissue plotted against the malignancy continuum. Samples are colored based on if they are from different disease stage. |
Top |
Malignant transformation related pathway analysis |
| Find out the enriched GO biological processes and KEGG pathways involved in transition from healthy to precancer to cancer |
| Tissue | Disease Stage | Enriched GO biological Processes |
| Colorectum | AD |  |
| Colorectum | SER |  |
| Colorectum | MSS |  |
| Colorectum | MSI-H |  |
| Colorectum | FAP |  |
| ∗Top 15 enriched GO BP terms are showed in the bar plot of each disease state in each tissue. Each row represents a significant GO biological process which is colored according to the -log10(p.adjust). |
| Page: 1 2 3 4 5 6 7 8 9 |
| GO ID | Tissue | Disease Stage | Description | Gene Ratio | Bg Ratio | pvalue | p.adjust | Count |
| GO:000183722 | Thyroid | ATC | epithelial to mesenchymal transition | 87/6293 | 157/18723 | 1.50e-08 | 3.06e-07 | 87 |
| GO:200123528 | Thyroid | ATC | positive regulation of apoptotic signaling pathway | 73/6293 | 126/18723 | 1.74e-08 | 3.47e-07 | 73 |
| GO:007233233 | Thyroid | ATC | intrinsic apoptotic signaling pathway by p53 class mediator | 49/6293 | 76/18723 | 3.60e-08 | 6.67e-07 | 49 |
| GO:005178311 | Thyroid | ATC | regulation of nuclear division | 77/6293 | 139/18723 | 1.01e-07 | 1.70e-06 | 77 |
| GO:005110027 | Thyroid | ATC | negative regulation of binding | 86/6293 | 162/18723 | 2.41e-07 | 3.73e-06 | 86 |
| GO:004277016 | Thyroid | ATC | signal transduction in response to DNA damage | 90/6293 | 172/18723 | 3.01e-07 | 4.52e-06 | 90 |
| GO:190179834 | Thyroid | ATC | positive regulation of signal transduction by p53 class mediator | 21/6293 | 25/18723 | 3.02e-07 | 4.52e-06 | 21 |
| GO:003033033 | Thyroid | ATC | DNA damage response, signal transduction by p53 class mediator | 45/6293 | 72/18723 | 4.87e-07 | 7.03e-06 | 45 |
| GO:004876221 | Thyroid | ATC | mesenchymal cell differentiation | 116/6293 | 236/18723 | 5.08e-07 | 7.30e-06 | 116 |
| GO:009006817 | Thyroid | ATC | positive regulation of cell cycle process | 115/6293 | 236/18723 | 9.87e-07 | 1.29e-05 | 115 |
| GO:006034813 | Thyroid | ATC | bone development | 102/6293 | 205/18723 | 1.18e-06 | 1.52e-05 | 102 |
| GO:006053724 | Thyroid | ATC | muscle tissue development | 181/6293 | 403/18723 | 1.27e-06 | 1.62e-05 | 181 |
| GO:200102214 | Thyroid | ATC | positive regulation of response to DNA damage stimulus | 59/6293 | 105/18723 | 1.62e-06 | 1.97e-05 | 59 |
| GO:006048521 | Thyroid | ATC | mesenchyme development | 136/6293 | 291/18723 | 2.04e-06 | 2.43e-05 | 136 |
| GO:005110133 | Thyroid | ATC | regulation of DNA binding | 64/6293 | 118/18723 | 3.10e-06 | 3.54e-05 | 64 |
| GO:009028721 | Thyroid | ATC | regulation of cellular response to growth factor stimulus | 140/6293 | 304/18723 | 3.91e-06 | 4.33e-05 | 140 |
| GO:003090133 | Thyroid | ATC | midbrain development | 51/6293 | 90/18723 | 5.79e-06 | 6.13e-05 | 51 |
| GO:009009214 | Thyroid | ATC | regulation of transmembrane receptor protein serine/threonine kinase signaling pathway | 120/6293 | 256/18723 | 6.62e-06 | 6.85e-05 | 120 |
| GO:006032511 | Thyroid | ATC | face morphogenesis | 21/6293 | 28/18723 | 8.94e-06 | 8.95e-05 | 21 |
| GO:004351631 | Thyroid | ATC | regulation of DNA damage response, signal transduction by p53 class mediator | 24/6293 | 34/18723 | 1.15e-05 | 1.12e-04 | 24 |
| Page: 1 2 3 4 5 6 7 8 9 10 11 12 |
| Pathway ID | Tissue | Disease Stage | Description | Gene Ratio | Bg Ratio | pvalue | p.adjust | qvalue | Count |
| hsa0516626 | Endometrium | AEH | Human T-cell leukemia virus 1 infection | 50/1197 | 222/8465 | 4.30e-04 | 3.11e-03 | 2.27e-03 | 50 |
| hsa05166111 | Endometrium | AEH | Human T-cell leukemia virus 1 infection | 50/1197 | 222/8465 | 4.30e-04 | 3.11e-03 | 2.27e-03 | 50 |
| hsa0516627 | Endometrium | EEC | Human T-cell leukemia virus 1 infection | 52/1237 | 222/8465 | 2.73e-04 | 2.36e-03 | 1.76e-03 | 52 |
| hsa0516636 | Endometrium | EEC | Human T-cell leukemia virus 1 infection | 52/1237 | 222/8465 | 2.73e-04 | 2.36e-03 | 1.76e-03 | 52 |
| hsa0516622 | Liver | HCC | Human T-cell leukemia virus 1 infection | 139/4020 | 222/8465 | 3.17e-06 | 2.79e-05 | 1.55e-05 | 139 |
| hsa0516632 | Liver | HCC | Human T-cell leukemia virus 1 infection | 139/4020 | 222/8465 | 3.17e-06 | 2.79e-05 | 1.55e-05 | 139 |
| Page: 1 |
Top |
Cell-cell communication analysis |
| Identification of potential cell-cell interactions between two cell types and their ligand-receptor pairs for different disease states |
| Ligand | Receptor | LRpair | Pathway | Tissue | Disease Stage |
| Page: 1 |
Top |
Single-cell gene regulatory network inference analysis |
| Find out the significant the regulons (TFs) and the target genes of each regulon across cell types for different disease states |
| TF | Cell Type | Tissue | Disease Stage | Target Gene | RSS | Regulon Activity |
| MSX1 | DC | Cervix | ADJ | ADIRF,DCN,SPARCL1, etc. | 1.80e-01 |  |
| MSX1 | DC | Cervix | CC | ADIRF,DCN,SPARCL1, etc. | 1.03e-01 |  |
| MSX1 | M1MAC | Cervix | Healthy | ADIRF,DCN,SPARCL1, etc. | 3.13e-01 |  |
| MSX1 | DC | Cervix | Healthy | ADIRF,DCN,SPARCL1, etc. | 2.28e-02 | |
| MSX1 | PLA | Cervix | Healthy | ADIRF,DCN,SPARCL1, etc. | 6.32e-03 | |
| MSX1 | DC | Cervix | HSIL_HPV | ADIRF,DCN,SPARCL1, etc. | 4.71e-02 |  |
| MSX1 | DC | Cervix | N_HPV | ADIRF,DCN,SPARCL1, etc. | 2.74e-02 |  |
| MSX1 | STM | Endometrium | EEC | DLX5,MARCKSL1,SH3YL1, etc. | 5.00e-01 |  |
| MSX1 | CD8TEX | Endometrium | ADJ | CITED4,WFDC2,SOX17, etc. | 5.29e-02 |  |
| MSX1 | CD8TEXINT | Endometrium | AEH | CITED4,WFDC2,SOX17, etc. | 1.32e-01 |  |
| ∗The dot plots of a searched regulon are shown for all cell subpopulations in each disease state of each tissue based on the regulon specific score inferred using pySCENIC and by calculating the average expression. |
| Page: 1 2 |
Top |
Somatic mutation of malignant transformation related genes |
| Annotation of somatic variants for genes involved in malignant transformation |
| Hugo Symbol | Variant Class | Variant Classification | dbSNP RS | HGVSc | HGVSp | HGVSp Short | SWISSPROT | BIOTYPE | SIFT | PolyPhen | Tumor Sample Barcode | Tissue | Histology | Sex | Age | Stage | Therapy Types | Drugs | Outcome |
| MSX1 | SNV | Missense_Mutation | c.527N>A | p.Arg176Gln | p.R176Q | P28360 | protein_coding | deleterious(0) | probably_damaging(0.999) | TCGA-A7-A2KD-01 | Breast | breast invasive carcinoma | Female | <65 | III/IV | Chemotherapy | cytoxan | SD | |
| MSX1 | SNV | Missense_Mutation | c.566N>A | p.Arg189His | p.R189H | P28360 | protein_coding | deleterious(0) | probably_damaging(0.986) | TCGA-IR-A3LI-01 | Cervix | cervical & endocervical cancer | Female | <65 | I/II | Chemotherapy | cisplatin | CR | |
| MSX1 | SNV | Missense_Mutation | c.893G>A | p.Ser298Asn | p.S298N | P28360 | protein_coding | tolerated(0.06) | possibly_damaging(0.749) | TCGA-A6-5665-01 | Colorectum | colon adenocarcinoma | Female | >=65 | I/II | Unknown | Unknown | PD | |
| MSX1 | SNV | Missense_Mutation | novel | c.436N>G | p.Met146Val | p.M146V | P28360 | protein_coding | tolerated(0.55) | benign(0.047) | TCGA-AA-A010-01 | Colorectum | colon adenocarcinoma | Female | <65 | I/II | Chemotherapy | folinic | CR |
| MSX1 | SNV | Missense_Mutation | c.809C>T | p.Ser270Leu | p.S270L | P28360 | protein_coding | tolerated(0.07) | benign(0.445) | TCGA-AM-5821-01 | Colorectum | colon adenocarcinoma | Female | >=65 | I/II | Unknown | Unknown | SD | |
| MSX1 | SNV | Missense_Mutation | c.253G>A | p.Gly85Ser | p.G85S | P28360 | protein_coding | tolerated(0.36) | benign(0.029) | TCGA-AY-A69D-01 | Colorectum | colon adenocarcinoma | Female | <65 | I/II | Unknown | Unknown | SD | |
| MSX1 | SNV | Missense_Mutation | c.722N>A | p.Ala241Asp | p.A241D | P28360 | protein_coding | deleterious(0) | probably_damaging(0.974) | TCGA-G4-6302-01 | Colorectum | colon adenocarcinoma | Female | >=65 | I/II | Unknown | Unknown | SD | |
| MSX1 | SNV | Missense_Mutation | c.574N>T | p.Arg192Cys | p.R192C | P28360 | protein_coding | deleterious(0) | probably_damaging(0.999) | TCGA-WS-AB45-01 | Colorectum | colon adenocarcinoma | Female | <65 | I/II | Unknown | Unknown | SD | |
| MSX1 | SNV | Missense_Mutation | c.623C>T | p.Ser208Leu | p.S208L | P28360 | protein_coding | deleterious(0) | probably_damaging(0.992) | TCGA-A5-A0G9-01 | Endometrium | uterine corpus endometrioid carcinoma | Female | >=65 | I/II | Unknown | Unknown | SD | |
| MSX1 | SNV | Missense_Mutation | novel | c.589N>A | p.Leu197Met | p.L197M | P28360 | protein_coding | deleterious(0) | probably_damaging(1) | TCGA-A5-A1OF-01 | Endometrium | uterine corpus endometrioid carcinoma | Female | <65 | I/II | Unknown | Unknown | SD |
| Page: 1 2 3 |
Top |
Related drugs of malignant transformation related genes |
| Identification of chemicals and drugs interact with genes involved in malignant transfromation |
| (DGIdb 4.0) |
| Entrez ID | Symbol | Category | Interaction Types | Drug Claim Name | Drug Name | PMIDs |
| Page: 1 |

Copyright 2023-Present -The University of Texas Health Science Center at Houston |