
|
|||||
|
 | |
| |
| |
| |
| |
| |
|
Gene: LIF |
Gene summary for LIF |
| Gene information | Species | Human | Gene symbol | LIF | Gene ID | 3976 |
| Gene name | LIF interleukin 6 family cytokine | |
| Gene Alias | CDF | |
| Cytomap | 22q12.2 | |
| Gene Type | protein-coding | GO ID | GO:0000003 | UniProtAcc | P15018 |
Top |
Malignant transformation analysis |
| Identification of the aberrant gene expression in precancerous and cancerous lesions by comparing the gene expression of stem-like cells in diseased tissues with normal stem cells |
| Entrez ID | Symbol | Replicates | Species | Organ | Tissue | Adj P-value | Log2FC | Malignancy |
| 3976 | LIF | P21T-E | Human | Esophagus | ESCC | 2.23e-02 | 2.90e-01 | 0.1617 |
| 3976 | LIF | P57T-E | Human | Esophagus | ESCC | 2.26e-03 | 6.81e-01 | 0.0926 |
| 3976 | LIF | P74T-E | Human | Esophagus | ESCC | 1.79e-05 | 1.04e-01 | 0.1479 |
| 3976 | LIF | P75T-E | Human | Esophagus | ESCC | 7.01e-08 | 3.69e-01 | 0.1125 |
| 3976 | LIF | P76T-E | Human | Esophagus | ESCC | 1.52e-10 | 6.13e-01 | 0.1207 |
| 3976 | LIF | P83T-E | Human | Esophagus | ESCC | 3.19e-20 | 1.07e+00 | 0.1738 |
| 3976 | LIF | P130T-E | Human | Esophagus | ESCC | 1.15e-02 | 2.11e-01 | 0.1676 |
| 3976 | LIF | GSM5252134_BPH511PrG_Fcol_3GEX | Human | Prostate | BPH | 2.79e-03 | 5.63e-01 | -0.1433 |
| 3976 | LIF | GSM5252135_BPH511PrPUr_Fcol_3GEX | Human | Prostate | BPH | 5.90e-08 | 8.82e-01 | -0.1833 |
| 3976 | LIF | 047563_1562-all-cells | Human | Prostate | BPH | 1.89e-02 | 2.56e-01 | 0.0791 |
| 3976 | LIF | 048752_1579-all-cells | Human | Prostate | BPH | 4.61e-05 | 1.95e-01 | 0.1008 |
| 3976 | LIF | Dong_P1 | Human | Prostate | Tumor | 7.45e-29 | 4.30e-01 | 0.035 |
| Page: 1 |
| Tissue | Expression Dynamics | Abbreviation |
| Esophagus | 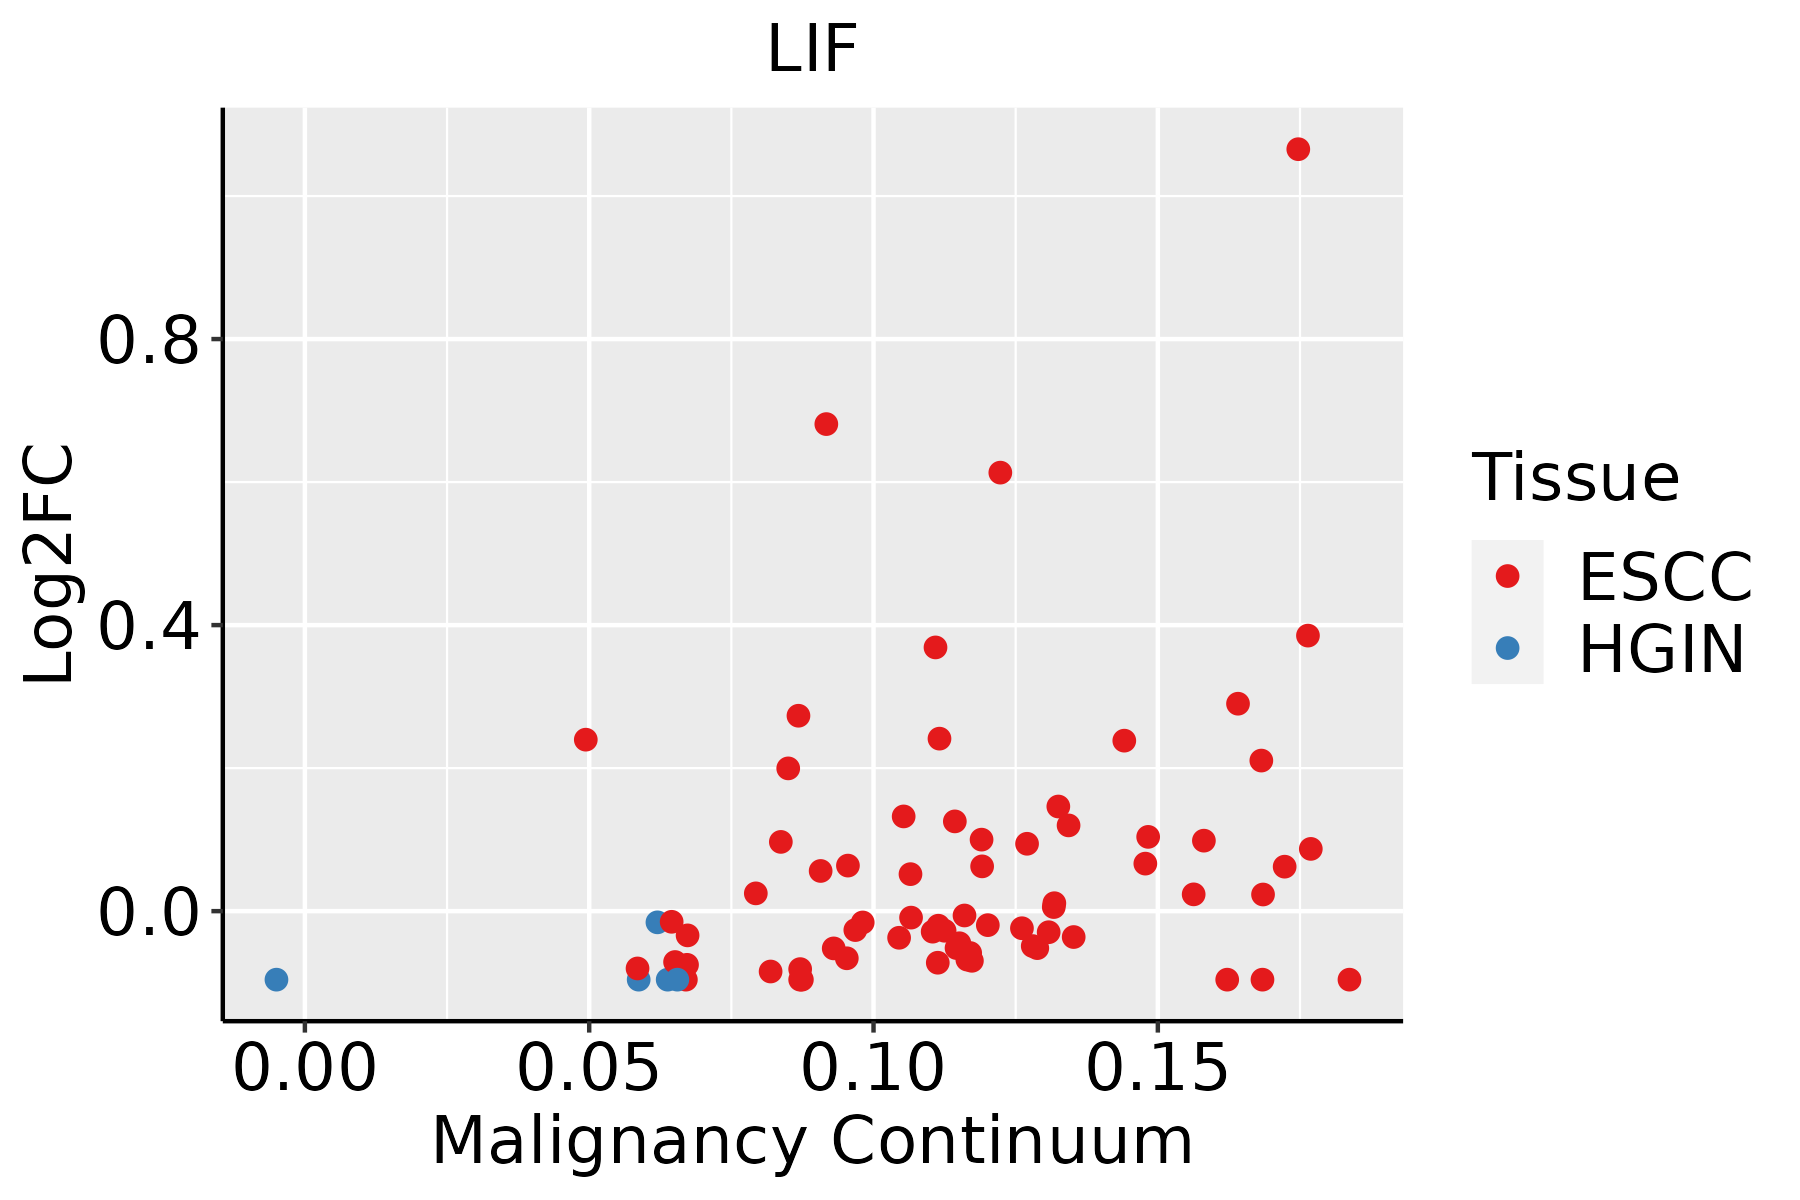 | ESCC: Esophageal squamous cell carcinoma |
| HGIN: High-grade intraepithelial neoplasias | ||
| LGIN: Low-grade intraepithelial neoplasias | ||
| Prostate | 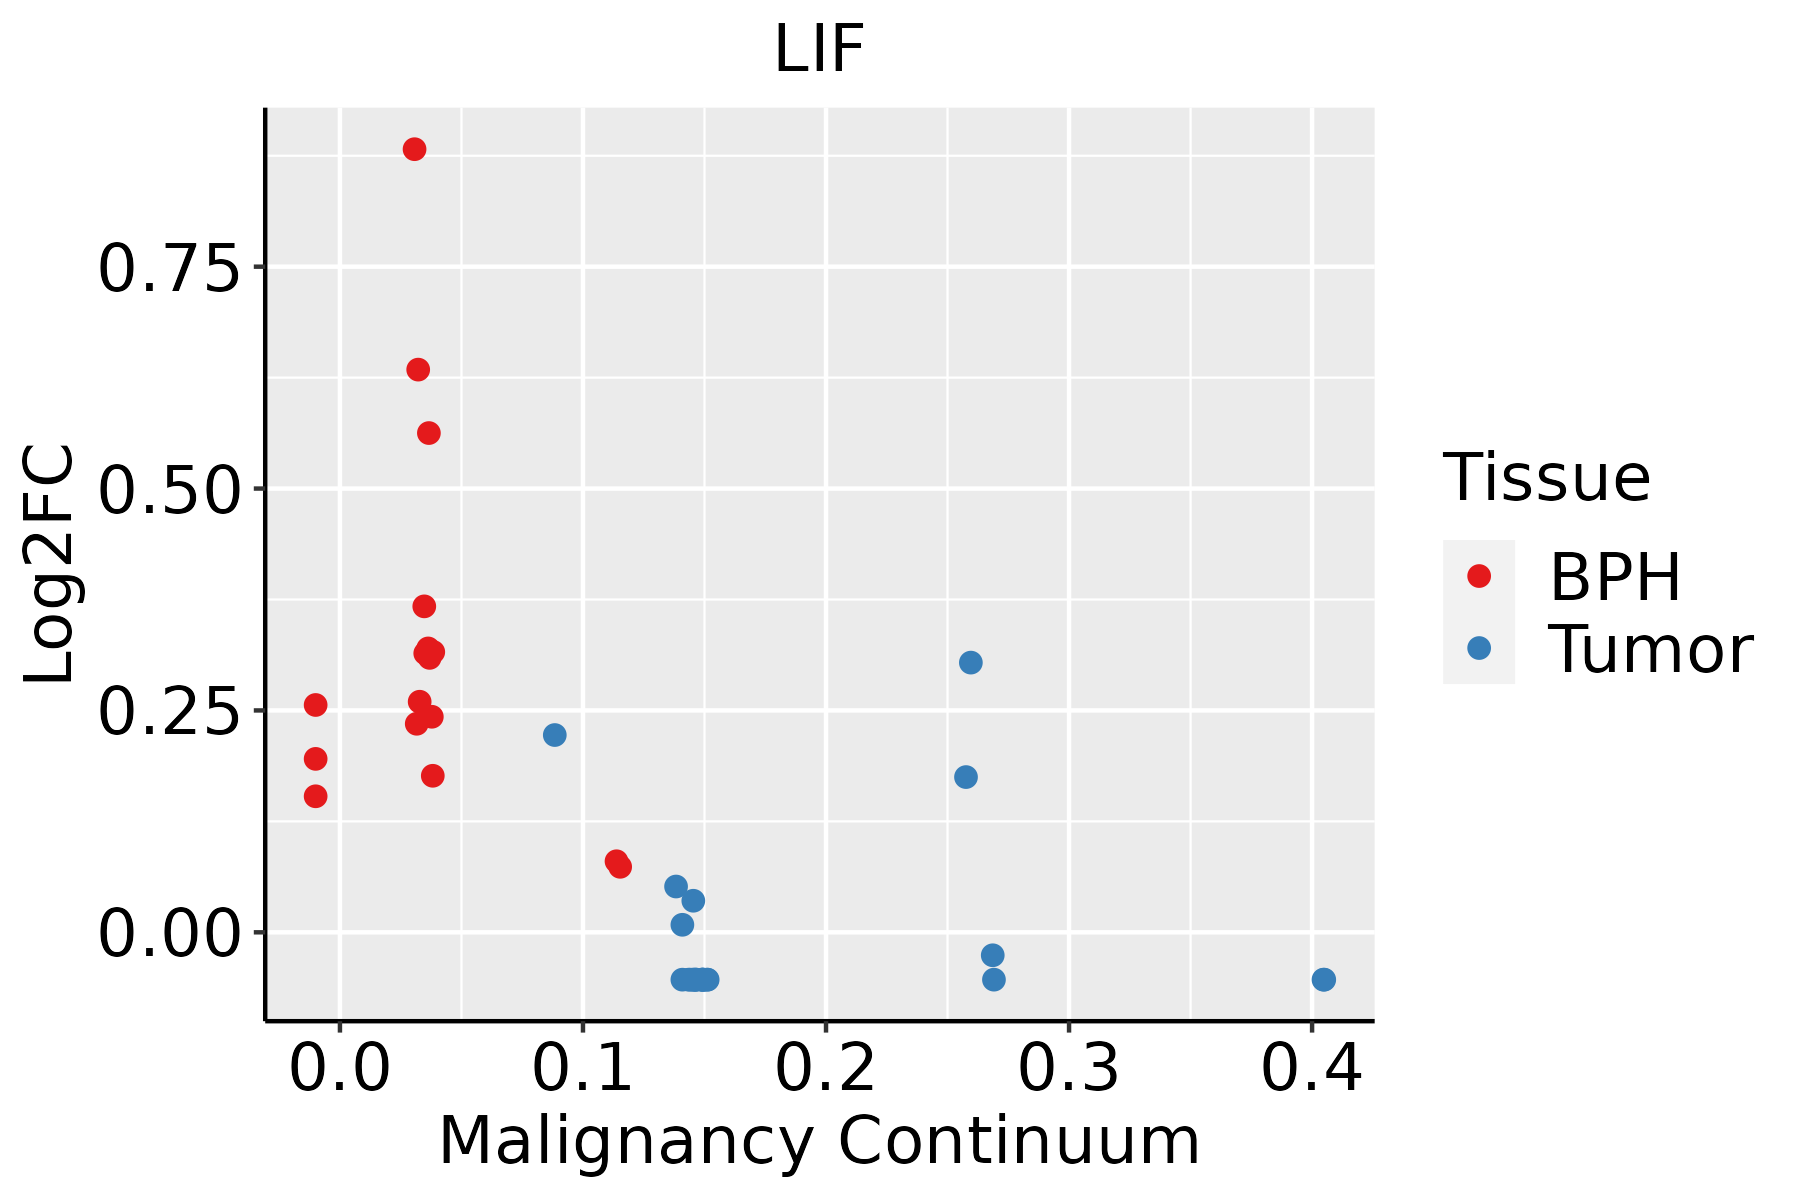 | BPH: Benign Prostatic Hyperplasia |
| ∗log2FC in expression of this searched gene in stem-like cells from each diseased tissue sample relative to stem-like cells in normal samples in each tissue plotted against the malignancy continuum. Samples are colored based on if they are from different disease stage. |
Top |
Malignant transformation related pathway analysis |
| Find out the enriched GO biological processes and KEGG pathways involved in transition from healthy to precancer to cancer |
| Tissue | Disease Stage | Enriched GO biological Processes |
| Colorectum | AD |  |
| Colorectum | SER |  |
| Colorectum | MSS |  |
| Colorectum | MSI-H |  |
| Colorectum | FAP |  |
| ∗Top 15 enriched GO BP terms are showed in the bar plot of each disease state in each tissue. Each row represents a significant GO biological process which is colored according to the -log10(p.adjust). |
| Page: 1 2 3 4 5 6 7 8 9 |
| GO ID | Tissue | Disease Stage | Description | Gene Ratio | Bg Ratio | pvalue | p.adjust | Count |
| GO:006145816 | Prostate | Tumor | reproductive system development | 133/3246 | 427/18723 | 1.24e-12 | 1.15e-10 | 133 |
| GO:004860815 | Prostate | Tumor | reproductive structure development | 131/3246 | 424/18723 | 3.48e-12 | 2.89e-10 | 131 |
| GO:003009919 | Prostate | Tumor | myeloid cell differentiation | 120/3246 | 381/18723 | 6.96e-12 | 5.62e-10 | 120 |
| GO:190018014 | Prostate | Tumor | regulation of protein localization to nucleus | 53/3246 | 136/18723 | 1.72e-09 | 7.91e-08 | 53 |
| GO:005110119 | Prostate | Tumor | regulation of DNA binding | 48/3246 | 118/18723 | 1.87e-09 | 8.43e-08 | 48 |
| GO:190018214 | Prostate | Tumor | positive regulation of protein localization to nucleus | 39/3246 | 87/18723 | 2.24e-09 | 9.59e-08 | 39 |
| GO:004578519 | Prostate | Tumor | positive regulation of cell adhesion | 125/3246 | 437/18723 | 2.56e-09 | 1.08e-07 | 125 |
| GO:000170115 | Prostate | Tumor | in utero embryonic development | 106/3246 | 367/18723 | 2.37e-08 | 8.09e-07 | 106 |
| GO:000189016 | Prostate | Tumor | placenta development | 52/3246 | 144/18723 | 4.96e-08 | 1.52e-06 | 52 |
| GO:001657013 | Prostate | Tumor | histone modification | 126/3246 | 463/18723 | 5.51e-08 | 1.65e-06 | 126 |
| GO:001072013 | Prostate | Tumor | positive regulation of cell development | 88/3246 | 298/18723 | 1.22e-07 | 3.17e-06 | 88 |
| GO:004563719 | Prostate | Tumor | regulation of myeloid cell differentiation | 67/3246 | 210/18723 | 1.71e-07 | 4.25e-06 | 67 |
| GO:190370617 | Prostate | Tumor | regulation of hemopoiesis | 103/3246 | 367/18723 | 1.78e-07 | 4.38e-06 | 103 |
| GO:000189215 | Prostate | Tumor | embryonic placenta development | 34/3246 | 82/18723 | 2.41e-07 | 5.65e-06 | 34 |
| GO:003085614 | Prostate | Tumor | regulation of epithelial cell differentiation | 52/3246 | 154/18723 | 5.76e-07 | 1.22e-05 | 52 |
| GO:20006771 | Prostate | Tumor | regulation of transcription regulatory region DNA binding | 23/3246 | 50/18723 | 2.48e-06 | 4.19e-05 | 23 |
| GO:009872712 | Prostate | Tumor | maintenance of cell number | 45/3246 | 134/18723 | 3.80e-06 | 6.11e-05 | 45 |
| GO:001982712 | Prostate | Tumor | stem cell population maintenance | 44/3246 | 131/18723 | 4.83e-06 | 7.52e-05 | 44 |
| GO:001820512 | Prostate | Tumor | peptidyl-lysine modification | 99/3246 | 376/18723 | 6.77e-06 | 1.02e-04 | 99 |
| GO:000165513 | Prostate | Tumor | urogenital system development | 90/3246 | 338/18723 | 1.08e-05 | 1.56e-04 | 90 |
| Page: 1 2 3 4 5 6 7 8 9 10 11 12 |
| Pathway ID | Tissue | Disease Stage | Description | Gene Ratio | Bg Ratio | pvalue | p.adjust | qvalue | Count |
| hsa0466810 | Esophagus | ESCC | TNF signaling pathway | 89/4205 | 114/8465 | 3.36e-10 | 4.01e-09 | 2.06e-09 | 89 |
| hsa0466817 | Esophagus | ESCC | TNF signaling pathway | 89/4205 | 114/8465 | 3.36e-10 | 4.01e-09 | 2.06e-09 | 89 |
| hsa046688 | Prostate | BPH | TNF signaling pathway | 41/1718 | 114/8465 | 6.86e-05 | 4.35e-04 | 2.69e-04 | 41 |
| hsa0466815 | Prostate | BPH | TNF signaling pathway | 41/1718 | 114/8465 | 6.86e-05 | 4.35e-04 | 2.69e-04 | 41 |
| hsa0466821 | Prostate | Tumor | TNF signaling pathway | 40/1791 | 114/8465 | 3.88e-04 | 2.07e-03 | 1.29e-03 | 40 |
| hsa0466831 | Prostate | Tumor | TNF signaling pathway | 40/1791 | 114/8465 | 3.88e-04 | 2.07e-03 | 1.29e-03 | 40 |
| Page: 1 |
Top |
Cell-cell communication analysis |
| Identification of potential cell-cell interactions between two cell types and their ligand-receptor pairs for different disease states |
| Ligand | Receptor | LRpair | Pathway | Tissue | Disease Stage |
| OSM | LIFR_IL6ST | OSM_LIFR_IL6ST | OSM | Breast | DCIS |
| LIF | LIFR_IL6ST | LIF_LIFR_IL6ST | LIFR | Breast | Healthy |
| OSM | LIFR_IL6ST | OSM_LIFR_IL6ST | OSM | Breast | Healthy |
| LIF | LIFR_IL6ST | LIF_LIFR_IL6ST | LIFR | Cervix | ADJ |
| OSM | LIFR_IL6ST | OSM_LIFR_IL6ST | OSM | Cervix | CC |
| LIF | LIFR_IL6ST | LIF_LIFR_IL6ST | LIFR | Cervix | CC |
| OSM | LIFR_IL6ST | OSM_LIFR_IL6ST | OSM | Cervix | Precancer |
| LIF | LIFR_IL6ST | LIF_LIFR_IL6ST | LIFR | Endometrium | ADJ |
| OSM | LIFR_IL6ST | OSM_LIFR_IL6ST | OSM | Endometrium | ADJ |
| LIF | LIFR_IL6ST | LIF_LIFR_IL6ST | LIFR | Endometrium | AEH |
| OSM | LIFR_IL6ST | OSM_LIFR_IL6ST | OSM | Endometrium | AEH |
| OSM | LIFR_IL6ST | OSM_LIFR_IL6ST | OSM | Endometrium | EEC |
| LIF | LIFR_IL6ST | LIF_LIFR_IL6ST | LIFR | Endometrium | EEC |
| LIF | LIFR_IL6ST | LIF_LIFR_IL6ST | LIFR | Endometrium | Healthy |
| OSM | LIFR_IL6ST | OSM_LIFR_IL6ST | OSM | Endometrium | Healthy |
| OSM | LIFR_IL6ST | OSM_LIFR_IL6ST | OSM | Esophagus | ESCC |
| LIF | LIFR_IL6ST | LIF_LIFR_IL6ST | LIFR | Esophagus | ESCC |
| OSM | LIFR_IL6ST | OSM_LIFR_IL6ST | OSM | HNSCC | ADJ |
| OSM | LIFR_IL6ST | OSM_LIFR_IL6ST | OSM | HNSCC | Healthy |
| OSM | LIFR_IL6ST | OSM_LIFR_IL6ST | OSM | HNSCC | OSCC |
| Page: 1 |
Top |
Single-cell gene regulatory network inference analysis |
| Find out the significant the regulons (TFs) and the target genes of each regulon across cell types for different disease states |
| TF | Cell Type | Tissue | Disease Stage | Target Gene | RSS | Regulon Activity |
| ∗The dot plots of a searched regulon are shown for all cell subpopulations in each disease state of each tissue based on the regulon specific score inferred using pySCENIC and by calculating the average expression. |
| Page: 1 |
Top |
Somatic mutation of malignant transformation related genes |
| Annotation of somatic variants for genes involved in malignant transformation |
| Hugo Symbol | Variant Class | Variant Classification | dbSNP RS | HGVSc | HGVSp | HGVSp Short | SWISSPROT | BIOTYPE | SIFT | PolyPhen | Tumor Sample Barcode | Tissue | Histology | Sex | Age | Stage | Therapy Types | Drugs | Outcome |
| LIF | SNV | Missense_Mutation | rs753939297 | c.451G>A | p.Val151Met | p.V151M | P15018 | protein_coding | tolerated(0.09) | probably_damaging(0.997) | TCGA-AN-A0FX-01 | Breast | breast invasive carcinoma | Female | <65 | I/II | Unknown | Unknown | SD |
| LIF | SNV | Missense_Mutation | c.102T>G | p.Cys34Trp | p.C34W | P15018 | protein_coding | deleterious(0) | probably_damaging(0.985) | TCGA-AR-A0TP-01 | Breast | breast invasive carcinoma | Female | <65 | I/II | Chemotherapy | doxorubicin | SD | |
| LIF | SNV | Missense_Mutation | novel | c.344N>G | p.Ser115Cys | p.S115C | P15018 | protein_coding | deleterious(0.01) | possibly_damaging(0.627) | TCGA-DS-A1OB-01 | Cervix | cervical & endocervical cancer | Female | <65 | I/II | Chemotherapy | carboplatin | PD |
| LIF | SNV | Missense_Mutation | novel | c.343N>A | p.Ser115Thr | p.S115T | P15018 | protein_coding | deleterious(0.02) | benign(0.029) | TCGA-DS-A1OB-01 | Cervix | cervical & endocervical cancer | Female | <65 | I/II | Chemotherapy | carboplatin | PD |
| LIF | SNV | Missense_Mutation | rs140799590 | c.218N>T | p.Pro73Leu | p.P73L | P15018 | protein_coding | deleterious(0.03) | probably_damaging(1) | TCGA-AA-3811-01 | Colorectum | colon adenocarcinoma | Female | >=65 | III/IV | Unknown | Unknown | PD |
| LIF | SNV | Missense_Mutation | c.514N>T | p.Thr172Ser | p.T172S | P15018 | protein_coding | tolerated(0.58) | benign(0.023) | TCGA-G4-6293-01 | Colorectum | colon adenocarcinoma | Female | <65 | III/IV | Chemotherapy | fluorouracil | SD | |
| LIF | SNV | Missense_Mutation | novel | c.576G>T | p.Lys192Asn | p.K192N | P15018 | protein_coding | tolerated(0.08) | probably_damaging(0.996) | TCGA-A5-A0G2-01 | Endometrium | uterine corpus endometrioid carcinoma | Female | <65 | III/IV | Unknown | Unknown | SD |
| LIF | SNV | Missense_Mutation | novel | c.575A>C | p.Lys192Thr | p.K192T | P15018 | protein_coding | tolerated(0.14) | probably_damaging(0.996) | TCGA-AP-A0LM-01 | Endometrium | uterine corpus endometrioid carcinoma | Female | <65 | III/IV | Chemotherapy | cisplatin | SD |
| LIF | SNV | Missense_Mutation | novel | c.143N>G | p.Ile48Ser | p.I48S | P15018 | protein_coding | deleterious(0) | probably_damaging(0.998) | TCGA-AP-A1E0-01 | Endometrium | uterine corpus endometrioid carcinoma | Female | <65 | III/IV | Chemotherapy | paclitaxel | SD |
| LIF | SNV | Missense_Mutation | rs746660268 | c.421N>A | p.Ala141Thr | p.A141T | P15018 | protein_coding | tolerated(1) | benign(0.015) | TCGA-D1-A103-01 | Endometrium | uterine corpus endometrioid carcinoma | Female | >=65 | I/II | Unknown | Unknown | SD |
| Page: 1 2 |
Top |
Related drugs of malignant transformation related genes |
| Identification of chemicals and drugs interact with genes involved in malignant transfromation |
| (DGIdb 4.0) |
| Entrez ID | Symbol | Category | Interaction Types | Drug Claim Name | Drug Name | PMIDs |
| 3976 | LIF | GROWTH FACTOR, DRUGGABLE GENOME | RETINOIC ACID | 2119291 | ||
| 3976 | LIF | GROWTH FACTOR, DRUGGABLE GENOME | HORMONES | 11589623 | ||
| 3976 | LIF | GROWTH FACTOR, DRUGGABLE GENOME | BUPIVACAINE | BUPIVACAINE | 10838161 | |
| 3976 | LIF | GROWTH FACTOR, DRUGGABLE GENOME | CLOMIPHENE CITRATE | 12012626 | ||
| 3976 | LIF | GROWTH FACTOR, DRUGGABLE GENOME | PACLITAXEL | PACLITAXEL | 11800022 | |
| 3976 | LIF | GROWTH FACTOR, DRUGGABLE GENOME | IL-13 | 12620497 | ||
| 3976 | LIF | GROWTH FACTOR, DRUGGABLE GENOME | SIMVASTATIN | SIMVASTATIN | 16797728 | |
| 3976 | LIF | GROWTH FACTOR, DRUGGABLE GENOME | CISPLATIN | CISPLATIN | 11800022,12519017 | |
| 3976 | LIF | GROWTH FACTOR, DRUGGABLE GENOME | MIFEPRISTONE | MIFEPRISTONE | 10717784 | |
| 3976 | LIF | GROWTH FACTOR, DRUGGABLE GENOME | OESTRADIOL | ESTRADIOL | 10508216 |
| Page: 1 2 |

Copyright 2023-Present -The University of Texas Health Science Center at Houston |