| Tissue | Expression Dynamics | Abbreviation |
| Colorectum (GSE201348) |  | FAP: Familial adenomatous polyposis |
| CRC: Colorectal cancer |
| Colorectum (HTA11) |  | AD: Adenomas |
| SER: Sessile serrated lesions |
| MSI-H: Microsatellite-high colorectal cancer |
| MSS: Microsatellite stable colorectal cancer |
| Esophagus | 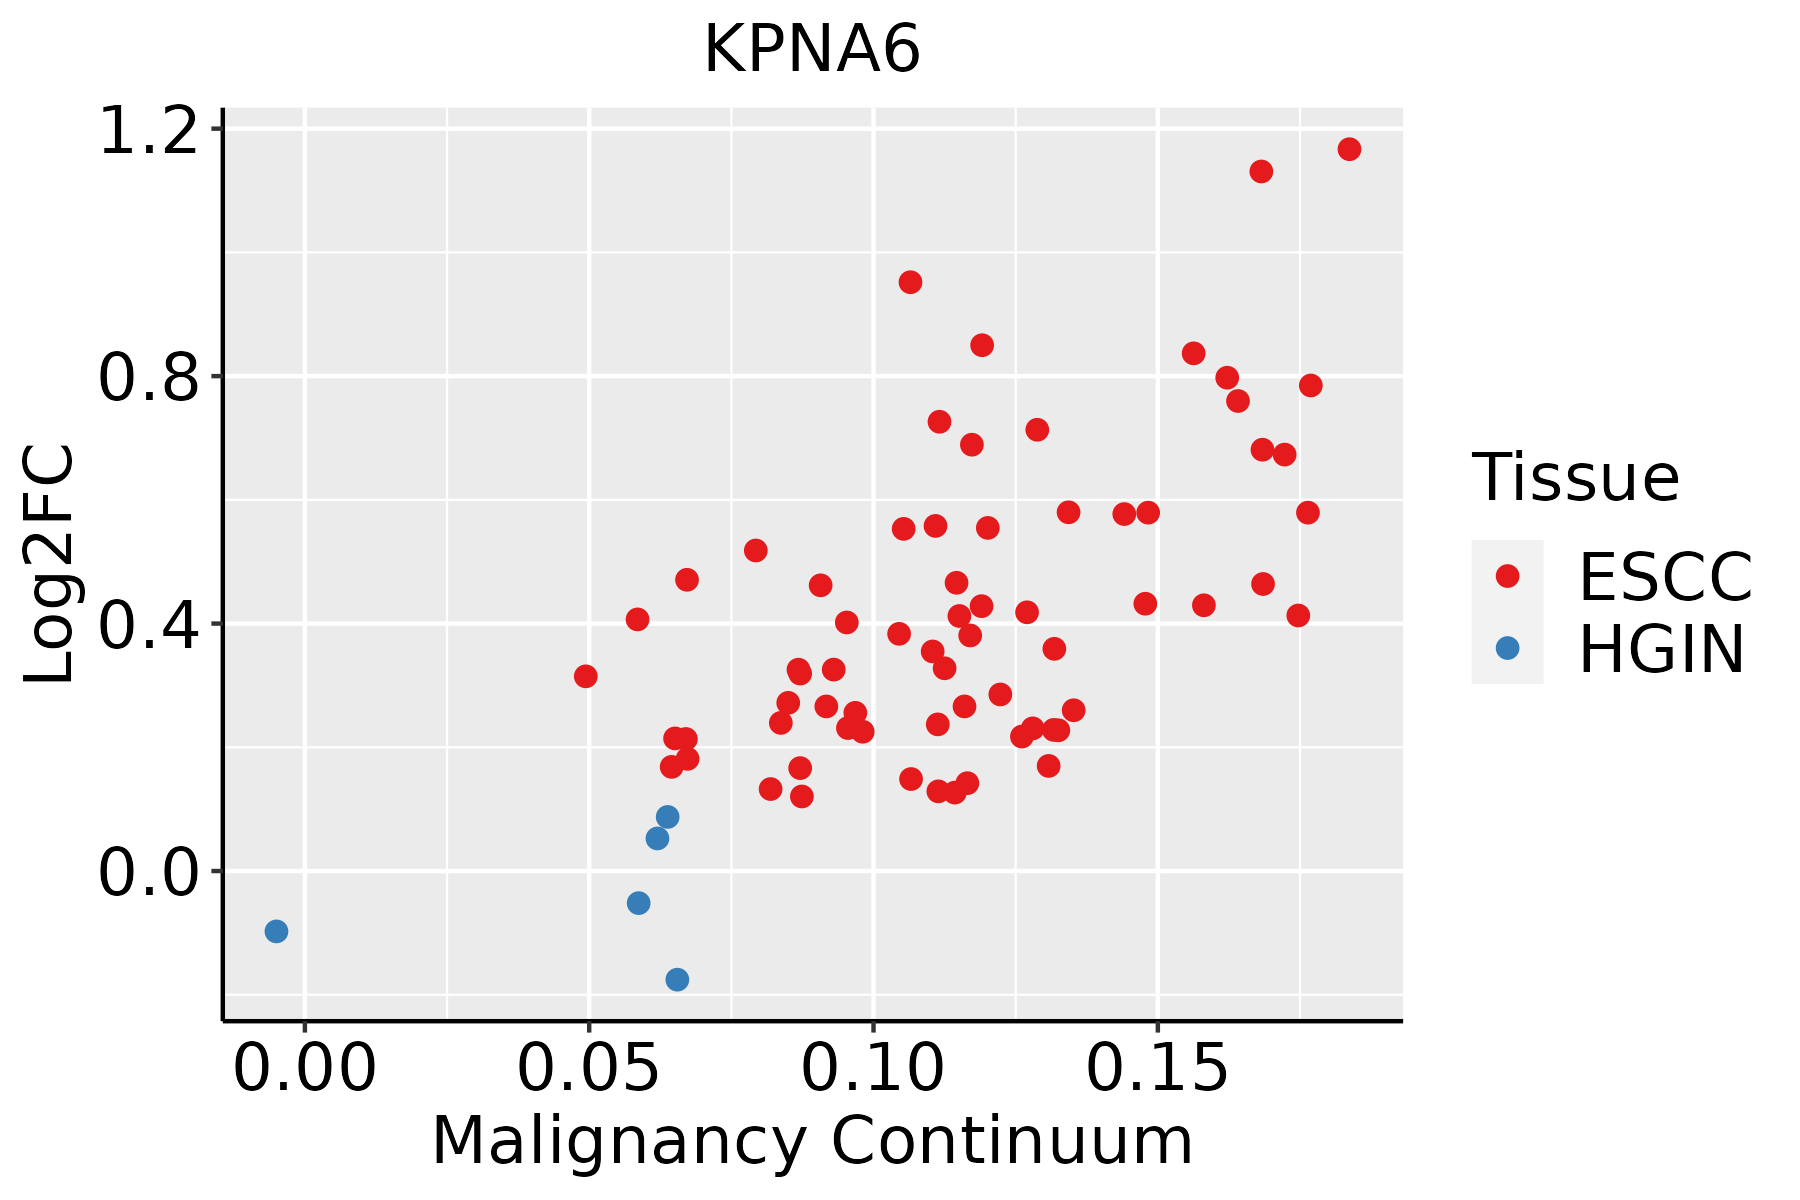 | ESCC: Esophageal squamous cell carcinoma |
| HGIN: High-grade intraepithelial neoplasias |
| LGIN: Low-grade intraepithelial neoplasias |
| Liver |  | HCC: Hepatocellular carcinoma |
| NAFLD: Non-alcoholic fatty liver disease |
| Lung |  | AAH: Atypical adenomatous hyperplasia |
| AIS: Adenocarcinoma in situ |
| IAC: Invasive lung adenocarcinoma |
| MIA: Minimally invasive adenocarcinoma |
| Oral Cavity |  | EOLP: Erosive Oral lichen planus |
| LP: leukoplakia |
| NEOLP: Non-erosive oral lichen planus |
| OSCC: Oral squamous cell carcinoma |
| Skin | 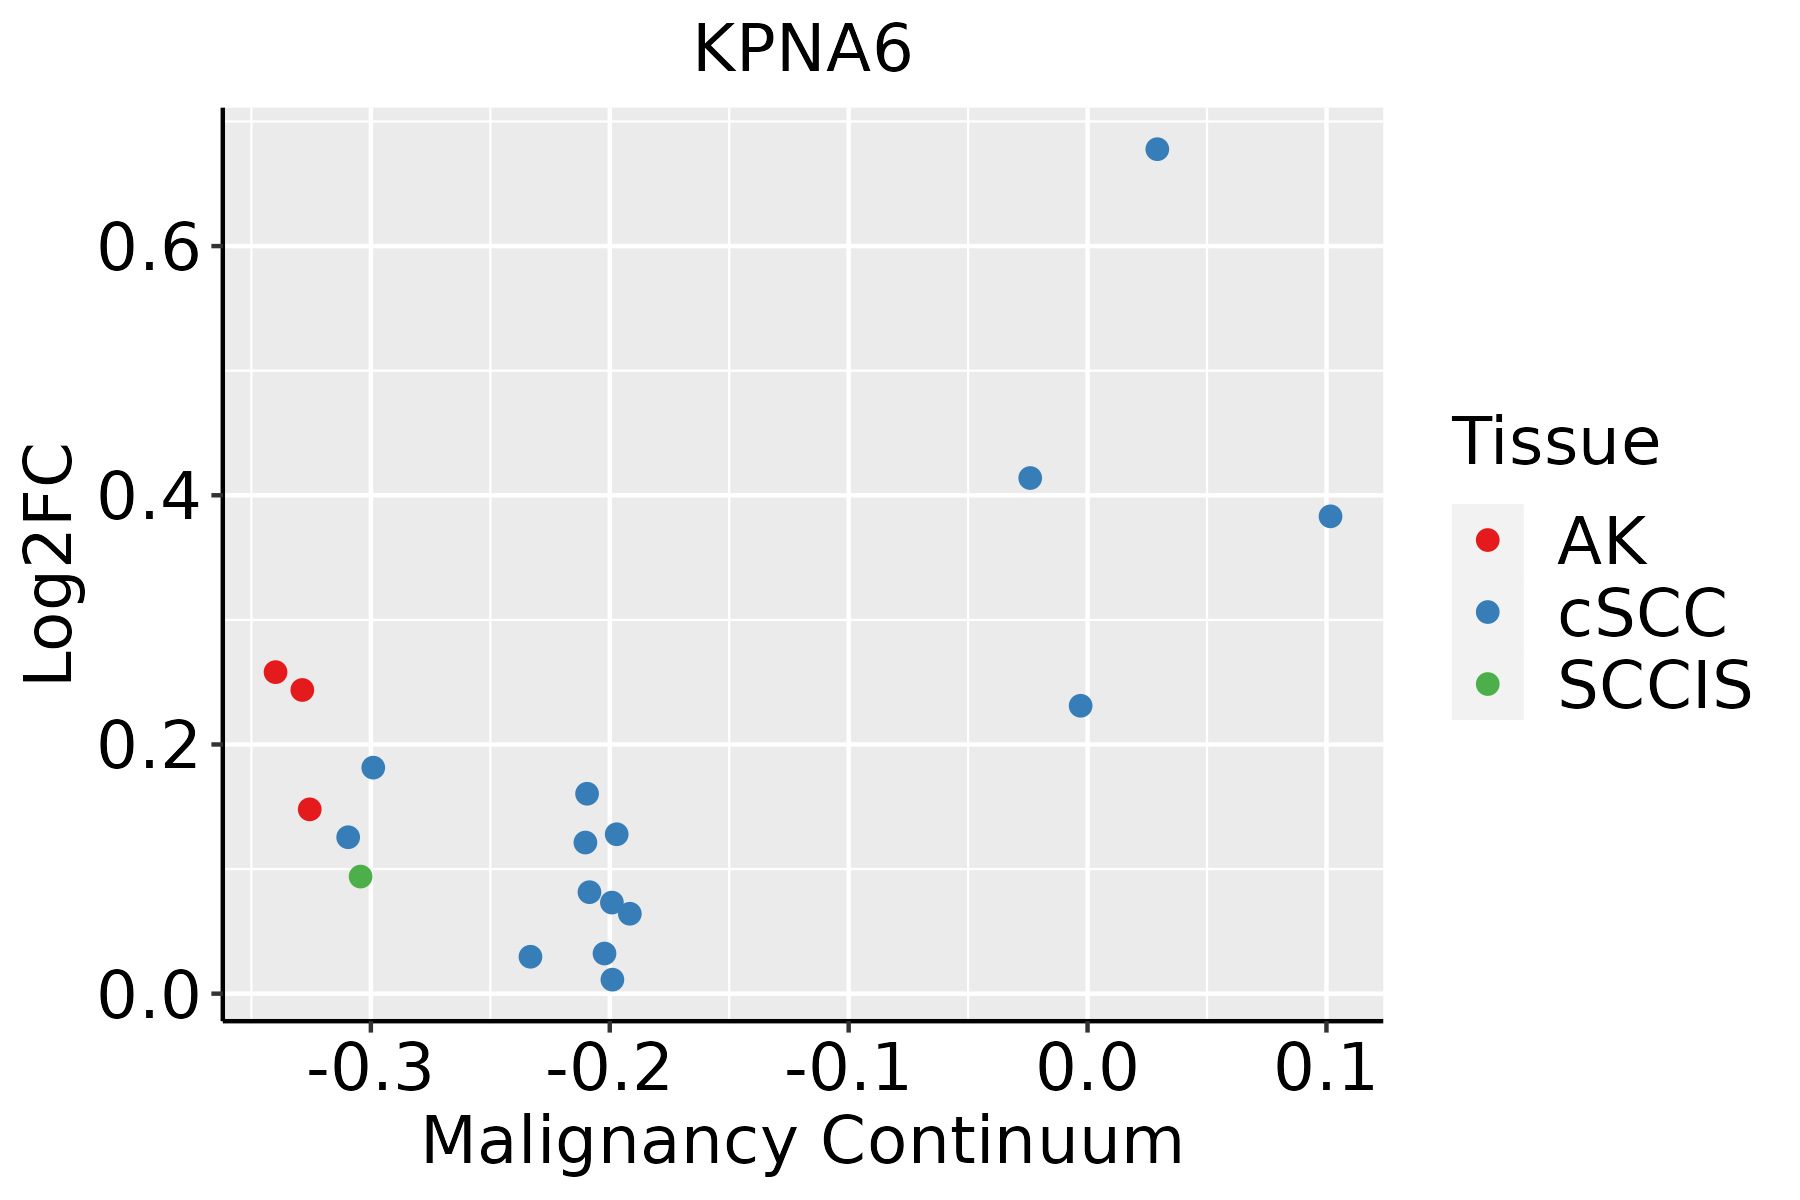 | AK: Actinic keratosis |
| cSCC: Cutaneous squamous cell carcinoma |
| SCCIS:squamous cell carcinoma in situ |
| Thyroid | 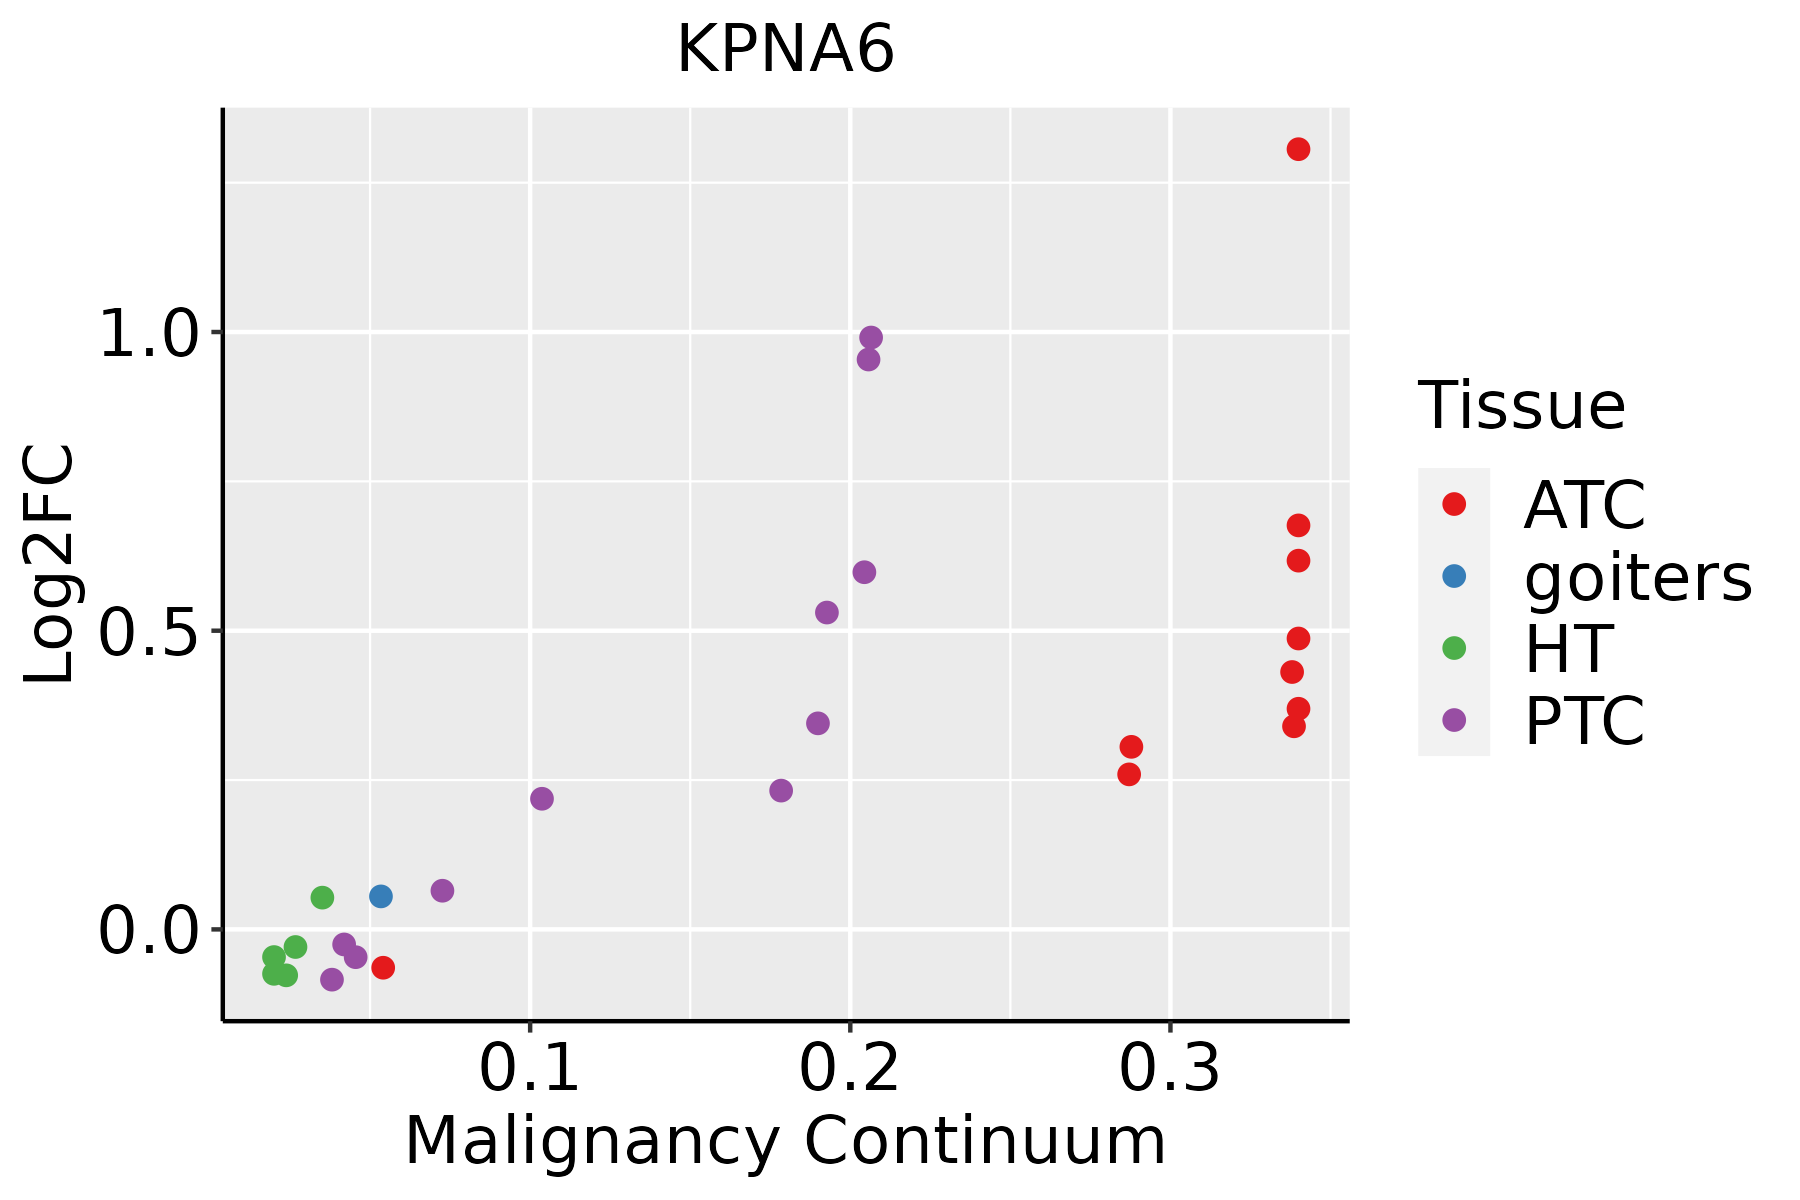 | ATC: Anaplastic thyroid cancer |
| HT: Hashimoto's thyroiditis |
| PTC: Papillary thyroid cancer |
| GO ID | Tissue | Disease Stage | Description | Gene Ratio | Bg Ratio | pvalue | p.adjust | Count |
| GO:000181910 | Oral cavity | OSCC | positive regulation of cytokine production | 213/7305 | 467/18723 | 1.93e-03 | 8.96e-03 | 213 |
| GO:00447067 | Oral cavity | OSCC | multi-multicellular organism process | 105/7305 | 220/18723 | 5.05e-03 | 1.97e-02 | 105 |
| GO:00447664 | Oral cavity | OSCC | multi-organism transport | 14/7305 | 21/18723 | 9.54e-03 | 3.39e-02 | 14 |
| GO:19025794 | Oral cavity | OSCC | multi-organism localization | 14/7305 | 21/18723 | 9.54e-03 | 3.39e-02 | 14 |
| GO:0016032110 | Oral cavity | LP | viral process | 211/4623 | 415/18723 | 4.06e-31 | 3.18e-28 | 211 |
| GO:007259419 | Oral cavity | LP | establishment of protein localization to organelle | 205/4623 | 422/18723 | 6.76e-27 | 3.85e-24 | 205 |
| GO:0019058110 | Oral cavity | LP | viral life cycle | 161/4623 | 317/18723 | 5.99e-24 | 2.21e-21 | 161 |
| GO:003450416 | Oral cavity | LP | protein localization to nucleus | 133/4623 | 290/18723 | 2.41e-15 | 3.35e-13 | 133 |
| GO:0019079110 | Oral cavity | LP | viral genome replication | 73/4623 | 131/18723 | 2.78e-14 | 3.11e-12 | 73 |
| GO:0050792110 | Oral cavity | LP | regulation of viral process | 83/4623 | 164/18723 | 6.50e-13 | 5.74e-11 | 83 |
| GO:000691318 | Oral cavity | LP | nucleocytoplasmic transport | 130/4623 | 301/18723 | 1.19e-12 | 9.77e-11 | 130 |
| GO:005116918 | Oral cavity | LP | nuclear transport | 130/4623 | 301/18723 | 1.19e-12 | 9.77e-11 | 130 |
| GO:001703816 | Oral cavity | LP | protein import | 95/4623 | 206/18723 | 1.55e-11 | 1.13e-09 | 95 |
| GO:1903900110 | Oral cavity | LP | regulation of viral life cycle | 72/4623 | 148/18723 | 2.23e-10 | 1.19e-08 | 72 |
| GO:004852418 | Oral cavity | LP | positive regulation of viral process | 40/4623 | 65/18723 | 3.14e-10 | 1.64e-08 | 40 |
| GO:190390216 | Oral cavity | LP | positive regulation of viral life cycle | 19/4623 | 29/18723 | 3.94e-06 | 8.19e-05 | 19 |
| GO:005117013 | Oral cavity | LP | import into nucleus | 65/4623 | 159/18723 | 4.78e-06 | 9.69e-05 | 65 |
| GO:000660612 | Oral cavity | LP | protein import into nucleus | 62/4623 | 155/18723 | 1.76e-05 | 3.04e-04 | 62 |
| GO:006013515 | Oral cavity | LP | maternal process involved in female pregnancy | 25/4623 | 62/18723 | 4.74e-03 | 3.00e-02 | 25 |
| GO:000756515 | Oral cavity | LP | female pregnancy | 63/4623 | 193/18723 | 7.56e-03 | 4.17e-02 | 63 |
| Pathway ID | Tissue | Disease Stage | Description | Gene Ratio | Bg Ratio | pvalue | p.adjust | qvalue | Count |
| hsa05207 | Colorectum | CRC | Chemical carcinogenesis - receptor activation | 42/1091 | 212/8465 | 2.62e-03 | 1.75e-02 | 1.19e-02 | 42 |
| hsa052071 | Colorectum | CRC | Chemical carcinogenesis - receptor activation | 42/1091 | 212/8465 | 2.62e-03 | 1.75e-02 | 1.19e-02 | 42 |
| hsa0301321 | Esophagus | ESCC | Nucleocytoplasmic transport | 89/4205 | 108/8465 | 1.20e-12 | 2.37e-11 | 1.21e-11 | 89 |
| hsa0516425 | Esophagus | ESCC | Influenza A | 122/4205 | 171/8465 | 5.01e-09 | 4.79e-08 | 2.45e-08 | 122 |
| hsa0301331 | Esophagus | ESCC | Nucleocytoplasmic transport | 89/4205 | 108/8465 | 1.20e-12 | 2.37e-11 | 1.21e-11 | 89 |
| hsa0516435 | Esophagus | ESCC | Influenza A | 122/4205 | 171/8465 | 5.01e-09 | 4.79e-08 | 2.45e-08 | 122 |
| hsa0516410 | Liver | Cirrhotic | Influenza A | 66/2530 | 171/8465 | 8.56e-03 | 2.91e-02 | 1.79e-02 | 66 |
| hsa0516411 | Liver | Cirrhotic | Influenza A | 66/2530 | 171/8465 | 8.56e-03 | 2.91e-02 | 1.79e-02 | 66 |
| hsa03013 | Liver | HCC | Nucleocytoplasmic transport | 81/4020 | 108/8465 | 4.28e-09 | 6.83e-08 | 3.80e-08 | 81 |
| hsa0516421 | Liver | HCC | Influenza A | 101/4020 | 171/8465 | 1.41e-03 | 5.07e-03 | 2.82e-03 | 101 |
| hsa030131 | Liver | HCC | Nucleocytoplasmic transport | 81/4020 | 108/8465 | 4.28e-09 | 6.83e-08 | 3.80e-08 | 81 |
| hsa0516431 | Liver | HCC | Influenza A | 101/4020 | 171/8465 | 1.41e-03 | 5.07e-03 | 2.82e-03 | 101 |
| hsa0516412 | Lung | IAC | Influenza A | 35/1053 | 171/8465 | 1.82e-03 | 1.00e-02 | 6.66e-03 | 35 |
| hsa0516413 | Lung | IAC | Influenza A | 35/1053 | 171/8465 | 1.82e-03 | 1.00e-02 | 6.66e-03 | 35 |
| hsa030136 | Oral cavity | OSCC | Nucleocytoplasmic transport | 82/3704 | 108/8465 | 7.93e-12 | 1.33e-10 | 6.77e-11 | 82 |
| hsa0516418 | Oral cavity | OSCC | Influenza A | 116/3704 | 171/8465 | 1.23e-10 | 1.78e-09 | 9.08e-10 | 116 |
| hsa0301311 | Oral cavity | OSCC | Nucleocytoplasmic transport | 82/3704 | 108/8465 | 7.93e-12 | 1.33e-10 | 6.77e-11 | 82 |
| hsa0516419 | Oral cavity | OSCC | Influenza A | 116/3704 | 171/8465 | 1.23e-10 | 1.78e-09 | 9.08e-10 | 116 |
| hsa0516424 | Oral cavity | LP | Influenza A | 80/2418 | 171/8465 | 2.56e-07 | 3.41e-06 | 2.20e-06 | 80 |
| hsa030132 | Oral cavity | LP | Nucleocytoplasmic transport | 53/2418 | 108/8465 | 4.68e-06 | 4.10e-05 | 2.64e-05 | 53 |
| Hugo Symbol | Variant Class | Variant Classification | dbSNP RS | HGVSc | HGVSp | HGVSp Short | SWISSPROT | BIOTYPE | SIFT | PolyPhen | Tumor Sample Barcode | Tissue | Histology | Sex | Age | Stage | Therapy Types | Drugs | Outcome |
| KPNA6 | SNV | Missense_Mutation | | c.1168N>A | p.Ala390Thr | p.A390T | O60684 | protein_coding | deleterious(0.01) | possibly_damaging(0.481) | TCGA-A2-A0CT-01 | Breast | breast invasive carcinoma | Female | >=65 | I/II | Chemotherapy | cytoxan | SD |
| KPNA6 | SNV | Missense_Mutation | | c.128G>A | p.Arg43Gln | p.R43Q | O60684 | protein_coding | deleterious(0) | probably_damaging(0.941) | TCGA-AN-A046-01 | Breast | breast invasive carcinoma | Female | >=65 | I/II | Unknown | Unknown | SD |
| KPNA6 | SNV | Missense_Mutation | novel | c.1153G>A | p.Glu385Lys | p.E385K | O60684 | protein_coding | tolerated(0.31) | benign(0.033) | TCGA-AN-A046-01 | Breast | breast invasive carcinoma | Female | >=65 | I/II | Unknown | Unknown | SD |
| KPNA6 | SNV | Missense_Mutation | novel | c.981N>G | p.Ile327Met | p.I327M | O60684 | protein_coding | tolerated(0.38) | benign(0.01) | TCGA-S3-A6ZF-01 | Breast | breast invasive carcinoma | Female | <65 | I/II | Chemotherapy | taxotere | CR |
| KPNA6 | insertion | Frame_Shift_Ins | novel | c.849_850insTGGAGAT | p.Asn284TrpfsTer3 | p.N284Wfs*3 | O60684 | protein_coding | | | TCGA-BH-A0HY-01 | Breast | breast invasive carcinoma | Female | <65 | I/II | Hormone Therapy | taxotere | CR |
| KPNA6 | insertion | In_Frame_Ins | novel | c.851_852insAGATACAACTTCCATTTCTCCCAT | p.Asn284delinsLysAspThrThrSerIleSerProIle | p.N284delinsKDTTSISPI | O60684 | protein_coding | | | TCGA-BH-A0HY-01 | Breast | breast invasive carcinoma | Female | <65 | I/II | Hormone Therapy | taxotere | CR |
| KPNA6 | deletion | Frame_Shift_Del | novel | c.1480delG | p.Ala494ProfsTer11 | p.A494Pfs*11 | O60684 | protein_coding | | | TCGA-EW-A2FV-01 | Breast | breast invasive carcinoma | Female | <65 | III/IV | Chemotherapy | docetaxel | SD |
| KPNA6 | deletion | Frame_Shift_Del | novel | c.1436delN | p.Ile479MetfsTer26 | p.I479Mfs*26 | O60684 | protein_coding | | | TCGA-S3-AA17-01 | Breast | breast invasive carcinoma | Female | <65 | I/II | Hormone Therapy | anastrozole | SD |
| KPNA6 | SNV | Missense_Mutation | | c.86N>A | p.Arg29Gln | p.R29Q | O60684 | protein_coding | deleterious(0) | probably_damaging(0.921) | TCGA-A6-3810-01 | Colorectum | colon adenocarcinoma | Male | <65 | I/II | Unknown | Unknown | SD |
| KPNA6 | SNV | Missense_Mutation | rs201663407 | c.1519G>A | p.Asp507Asn | p.D507N | O60684 | protein_coding | deleterious(0.02) | benign(0.009) | TCGA-A6-5661-01 | Colorectum | colon adenocarcinoma | Female | >=65 | I/II | Unknown | Unknown | SD |


