| Tissue | Expression Dynamics | Abbreviation |
| Colorectum (GSE201348) | 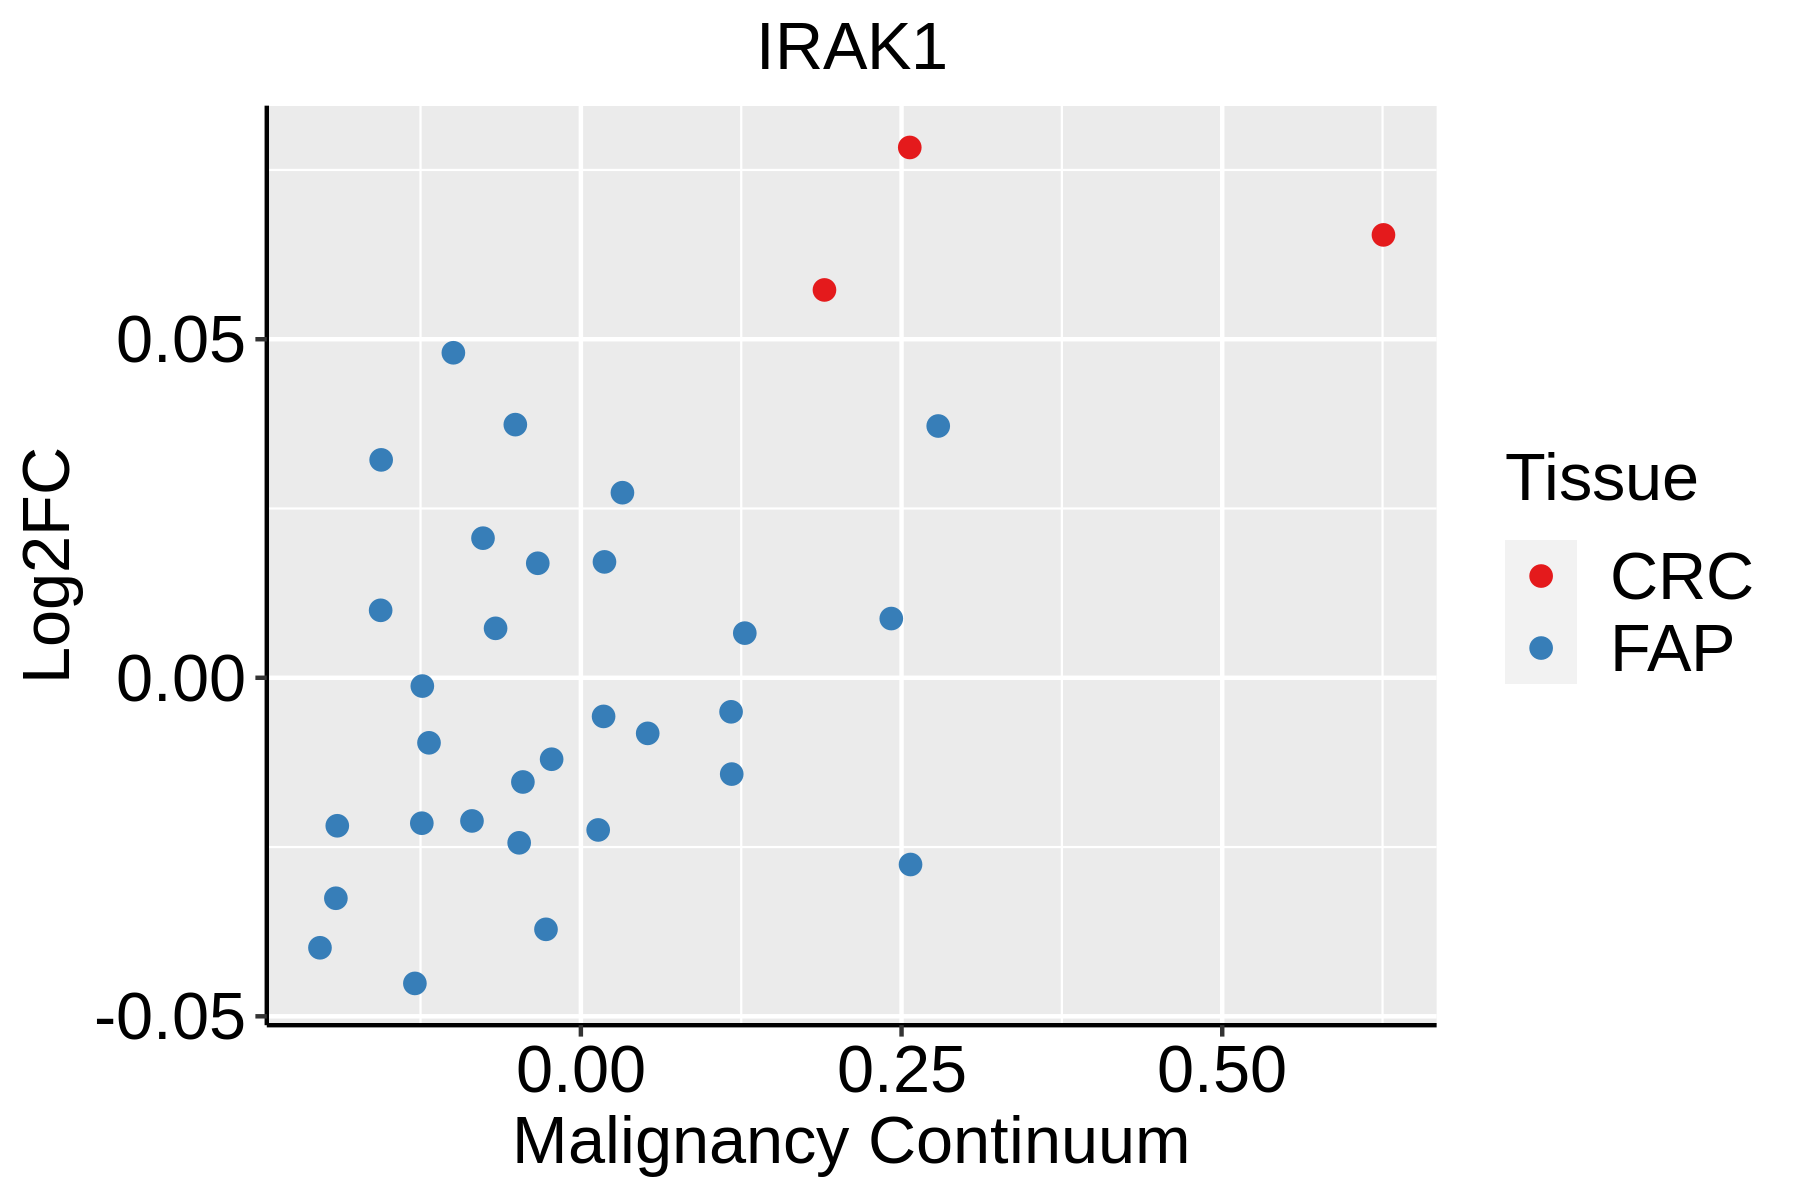 | FAP: Familial adenomatous polyposis |
| CRC: Colorectal cancer |
| Colorectum (HTA11) |  | AD: Adenomas |
| SER: Sessile serrated lesions |
| MSI-H: Microsatellite-high colorectal cancer |
| MSS: Microsatellite stable colorectal cancer |
| Esophagus | 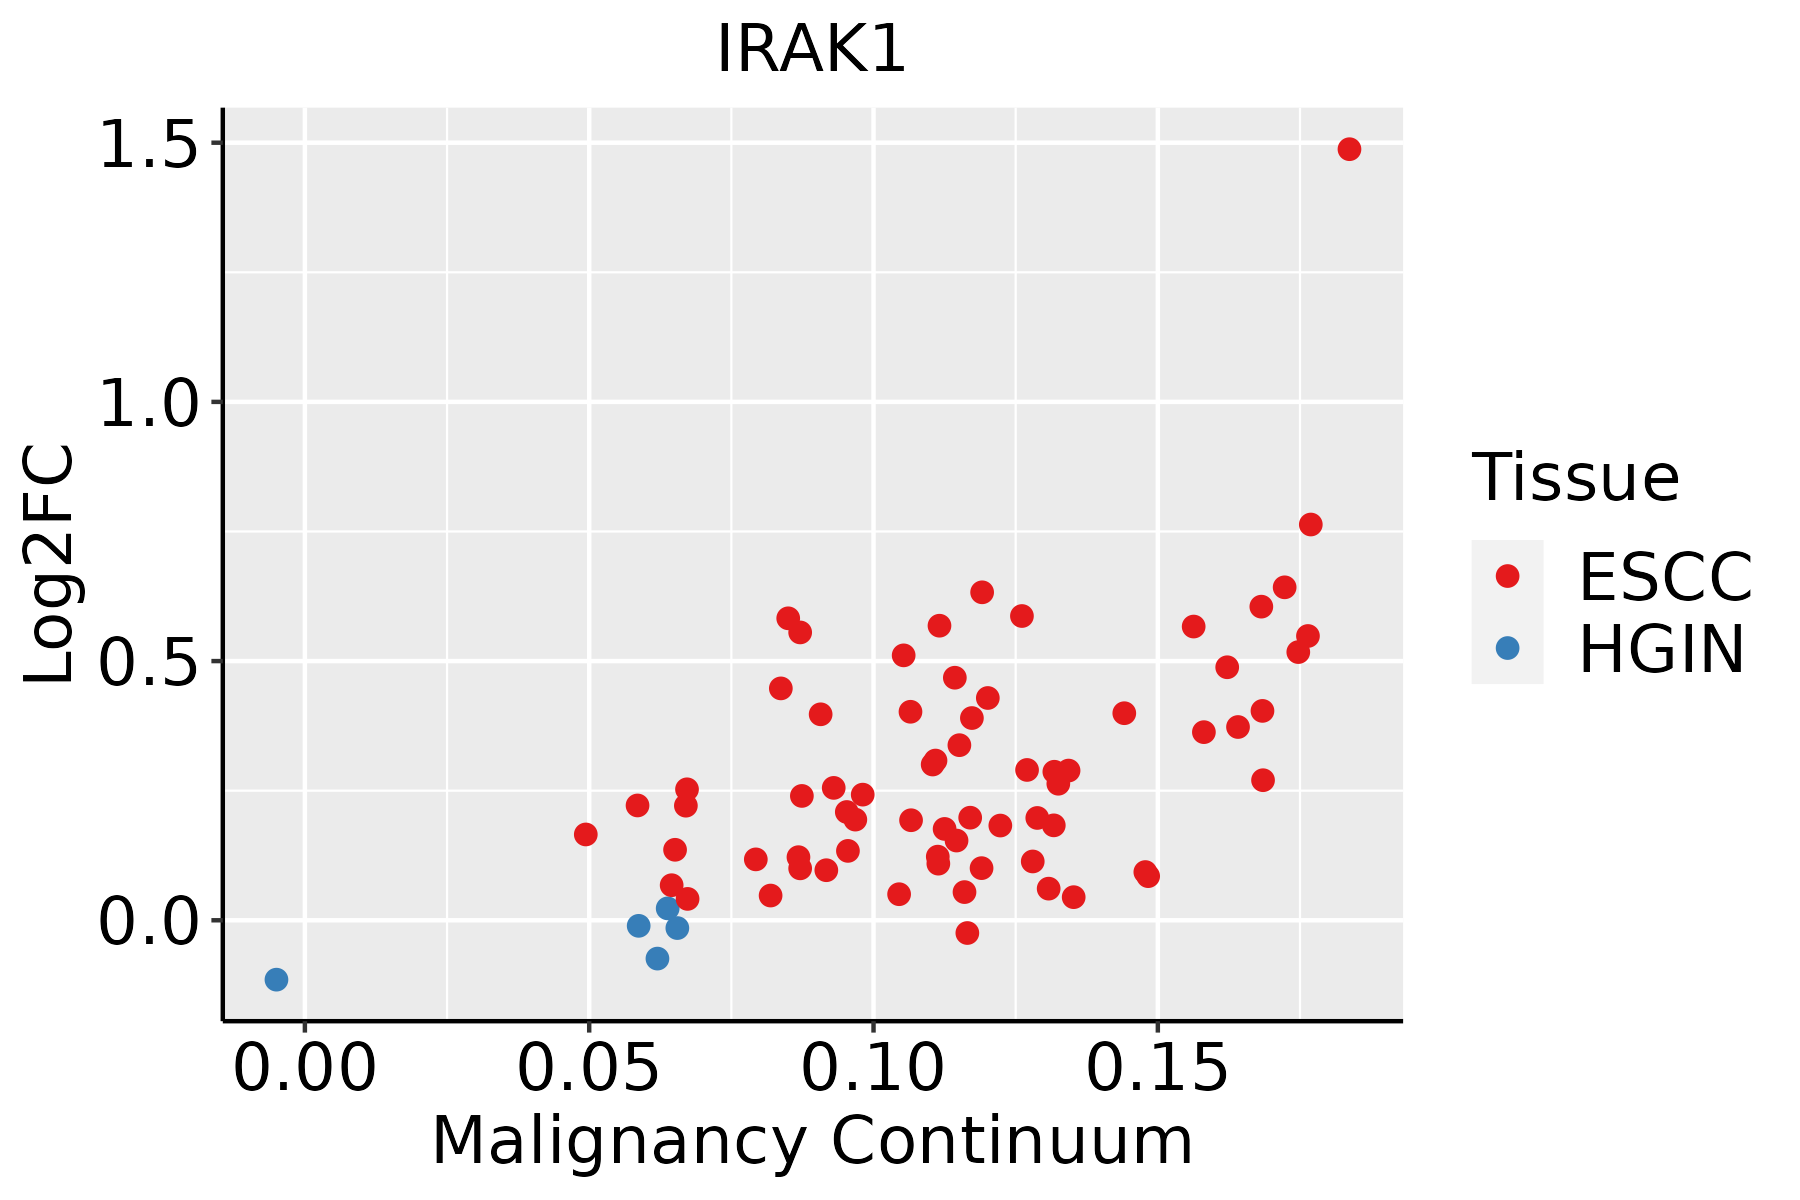 | ESCC: Esophageal squamous cell carcinoma |
| HGIN: High-grade intraepithelial neoplasias |
| LGIN: Low-grade intraepithelial neoplasias |
| Liver | 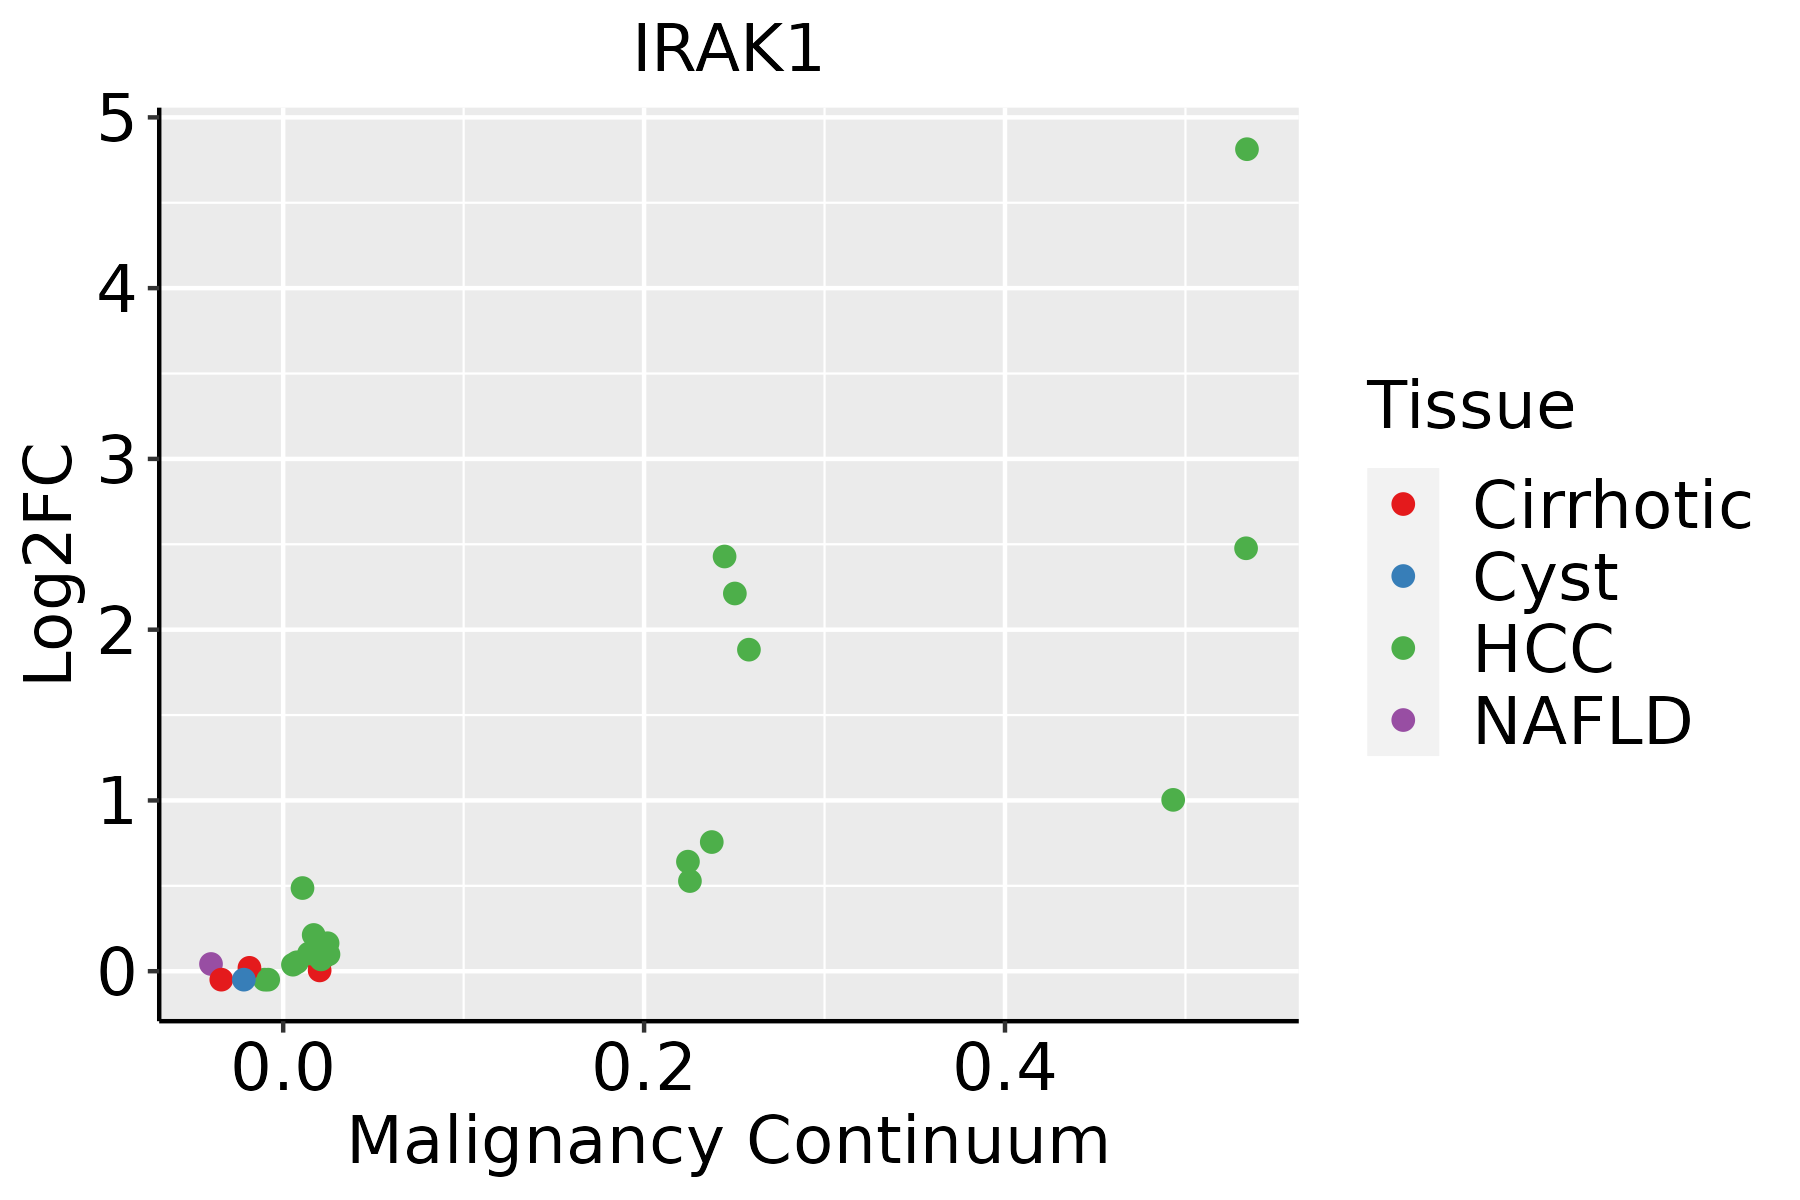 | HCC: Hepatocellular carcinoma |
| NAFLD: Non-alcoholic fatty liver disease |
| Oral Cavity |  | EOLP: Erosive Oral lichen planus |
| LP: leukoplakia |
| NEOLP: Non-erosive oral lichen planus |
| OSCC: Oral squamous cell carcinoma |
| Skin |  | AK: Actinic keratosis |
| cSCC: Cutaneous squamous cell carcinoma |
| SCCIS:squamous cell carcinoma in situ |
| Thyroid | 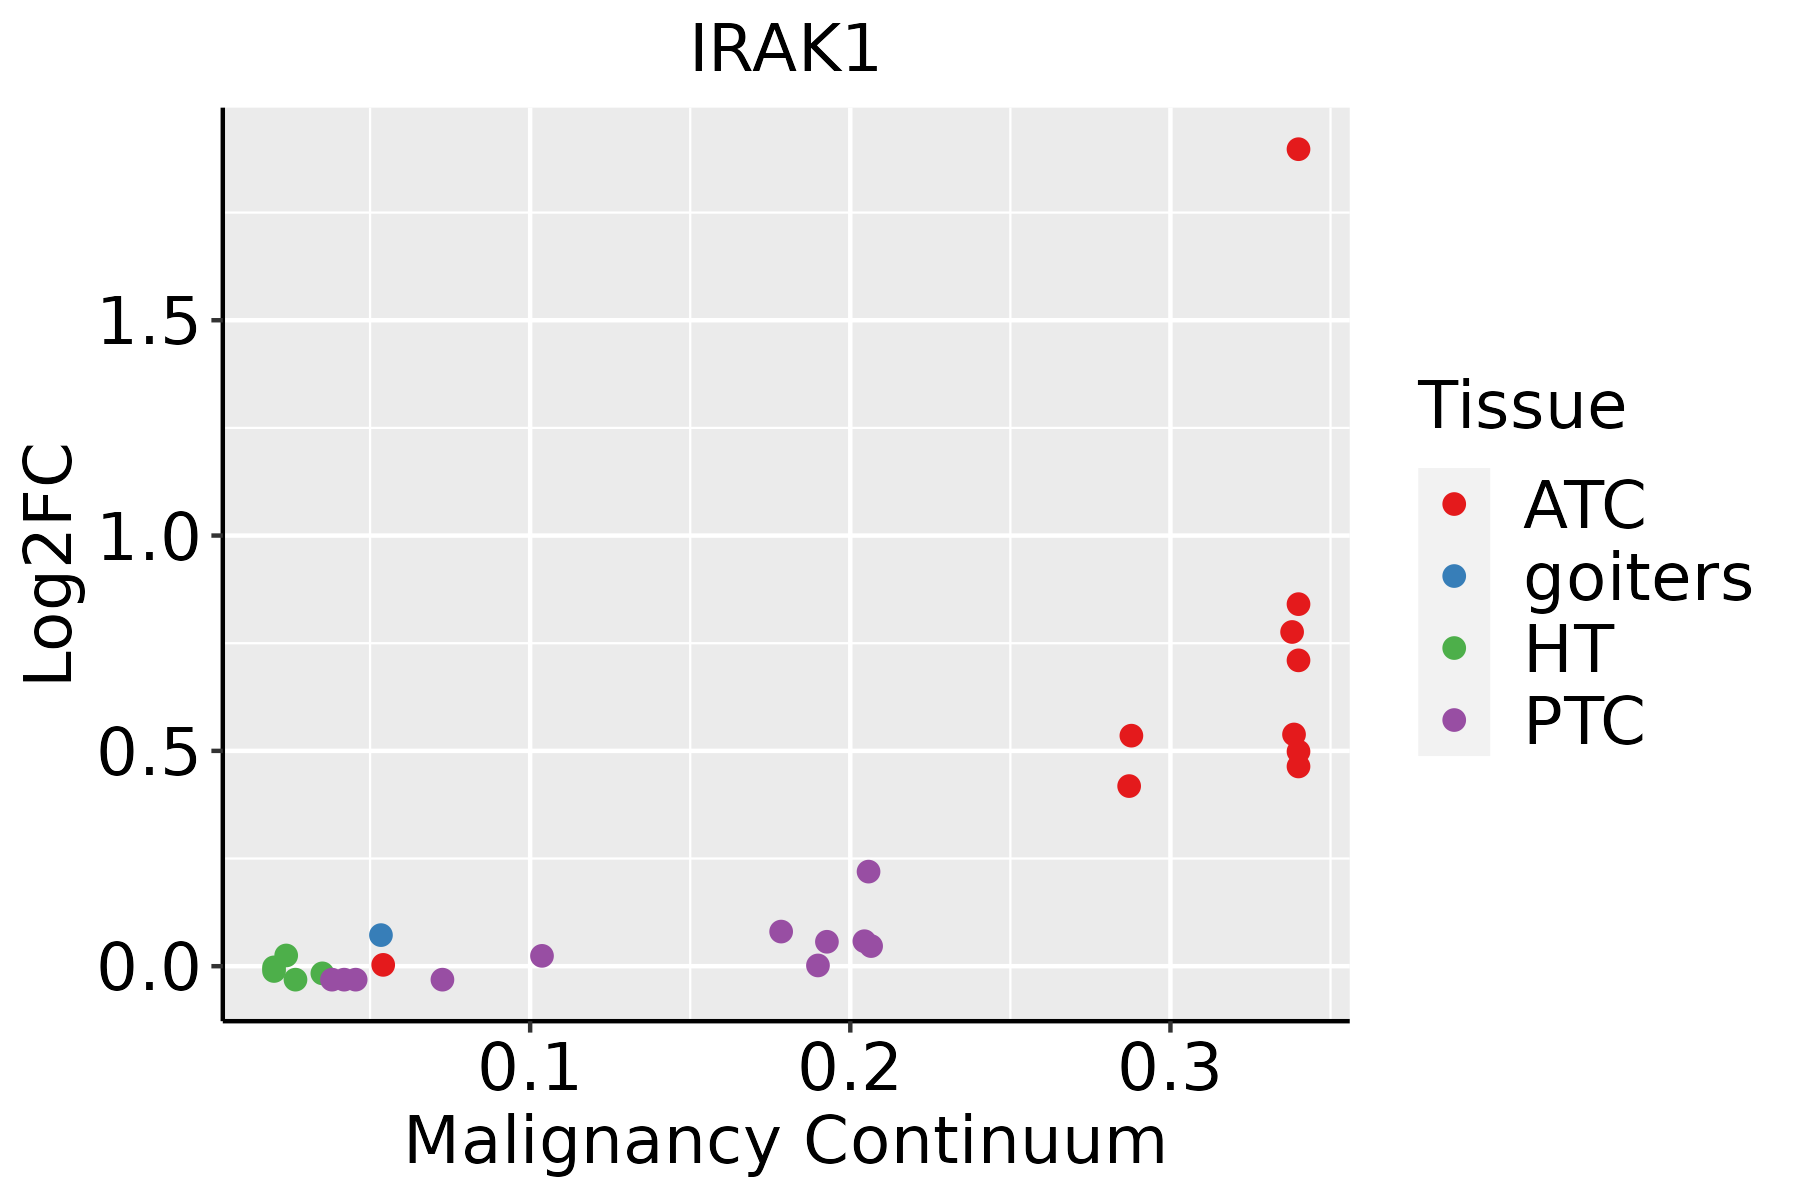 | ATC: Anaplastic thyroid cancer |
| HT: Hashimoto's thyroiditis |
| PTC: Papillary thyroid cancer |
| GO ID | Tissue | Disease Stage | Description | Gene Ratio | Bg Ratio | pvalue | p.adjust | Count |
| GO:007135711 | Liver | HCC | cellular response to type I interferon | 38/7958 | 52/18723 | 7.59e-06 | 8.98e-05 | 38 |
| GO:004312312 | Liver | HCC | positive regulation of I-kappaB kinase/NF-kappaB signaling | 108/7958 | 186/18723 | 1.28e-05 | 1.43e-04 | 108 |
| GO:00324814 | Liver | HCC | positive regulation of type I interferon production | 41/7958 | 58/18723 | 1.29e-05 | 1.44e-04 | 41 |
| GO:003109822 | Liver | HCC | stress-activated protein kinase signaling cascade | 138/7958 | 247/18723 | 1.43e-05 | 1.57e-04 | 138 |
| GO:005140322 | Liver | HCC | stress-activated MAPK cascade | 134/7958 | 239/18723 | 1.50e-05 | 1.64e-04 | 134 |
| GO:004312212 | Liver | HCC | regulation of I-kappaB kinase/NF-kappaB signaling | 138/7958 | 249/18723 | 2.47e-05 | 2.58e-04 | 138 |
| GO:0032479 | Liver | HCC | regulation of type I interferon production | 60/7958 | 95/18723 | 3.84e-05 | 3.80e-04 | 60 |
| GO:0032606 | Liver | HCC | type I interferon production | 60/7958 | 95/18723 | 3.84e-05 | 3.80e-04 | 60 |
| GO:007190021 | Liver | HCC | regulation of protein serine/threonine kinase activity | 189/7958 | 359/18723 | 5.97e-05 | 5.47e-04 | 189 |
| GO:000926611 | Liver | HCC | response to temperature stimulus | 101/7958 | 178/18723 | 8.55e-05 | 7.48e-04 | 101 |
| GO:00467775 | Liver | HCC | protein autophosphorylation | 123/7958 | 227/18723 | 2.40e-04 | 1.80e-03 | 123 |
| GO:007145311 | Liver | HCC | cellular response to oxygen levels | 98/7958 | 177/18723 | 3.63e-04 | 2.52e-03 | 98 |
| GO:003629411 | Liver | HCC | cellular response to decreased oxygen levels | 90/7958 | 161/18723 | 4.03e-04 | 2.72e-03 | 90 |
| GO:007145611 | Liver | HCC | cellular response to hypoxia | 84/7958 | 151/18723 | 7.57e-04 | 4.56e-03 | 84 |
| GO:00705551 | Liver | HCC | response to interleukin-1 | 80/7958 | 143/18723 | 7.95e-04 | 4.77e-03 | 80 |
| GO:00510902 | Liver | HCC | regulation of DNA-binding transcription factor activity | 220/7958 | 440/18723 | 8.04e-04 | 4.82e-03 | 220 |
| GO:004586021 | Liver | HCC | positive regulation of protein kinase activity | 194/7958 | 386/18723 | 1.16e-03 | 6.54e-03 | 194 |
| GO:003249611 | Liver | HCC | response to lipopolysaccharide | 174/7958 | 343/18723 | 1.19e-03 | 6.62e-03 | 174 |
| GO:00712166 | Liver | HCC | cellular response to biotic stimulus | 128/7958 | 246/18723 | 1.53e-03 | 8.10e-03 | 128 |
| GO:003367411 | Liver | HCC | positive regulation of kinase activity | 230/7958 | 467/18723 | 1.72e-03 | 8.95e-03 | 230 |
| Pathway ID | Tissue | Disease Stage | Description | Gene Ratio | Bg Ratio | pvalue | p.adjust | qvalue | Count |
| hsa05171 | Colorectum | AD | Coronavirus disease - COVID-19 | 113/2092 | 232/8465 | 9.90e-16 | 2.55e-14 | 1.63e-14 | 113 |
| hsa05132 | Colorectum | AD | Salmonella infection | 102/2092 | 249/8465 | 7.65e-09 | 1.28e-07 | 8.17e-08 | 102 |
| hsa05130 | Colorectum | AD | Pathogenic Escherichia coli infection | 79/2092 | 197/8465 | 1.05e-06 | 1.36e-05 | 8.65e-06 | 79 |
| hsa05135 | Colorectum | AD | Yersinia infection | 58/2092 | 137/8465 | 3.90e-06 | 4.35e-05 | 2.78e-05 | 58 |
| hsa04722 | Colorectum | AD | Neurotrophin signaling pathway | 50/2092 | 119/8465 | 2.28e-05 | 2.24e-04 | 1.43e-04 | 50 |
| hsa05417 | Colorectum | AD | Lipid and atherosclerosis | 73/2092 | 215/8465 | 1.31e-03 | 8.27e-03 | 5.27e-03 | 73 |
| hsa05170 | Colorectum | AD | Human immunodeficiency virus 1 infection | 72/2092 | 212/8465 | 1.40e-03 | 8.46e-03 | 5.39e-03 | 72 |
| hsa051711 | Colorectum | AD | Coronavirus disease - COVID-19 | 113/2092 | 232/8465 | 9.90e-16 | 2.55e-14 | 1.63e-14 | 113 |
| hsa051321 | Colorectum | AD | Salmonella infection | 102/2092 | 249/8465 | 7.65e-09 | 1.28e-07 | 8.17e-08 | 102 |
| hsa051301 | Colorectum | AD | Pathogenic Escherichia coli infection | 79/2092 | 197/8465 | 1.05e-06 | 1.36e-05 | 8.65e-06 | 79 |
| hsa051351 | Colorectum | AD | Yersinia infection | 58/2092 | 137/8465 | 3.90e-06 | 4.35e-05 | 2.78e-05 | 58 |
| hsa047221 | Colorectum | AD | Neurotrophin signaling pathway | 50/2092 | 119/8465 | 2.28e-05 | 2.24e-04 | 1.43e-04 | 50 |
| hsa054171 | Colorectum | AD | Lipid and atherosclerosis | 73/2092 | 215/8465 | 1.31e-03 | 8.27e-03 | 5.27e-03 | 73 |
| hsa051701 | Colorectum | AD | Human immunodeficiency virus 1 infection | 72/2092 | 212/8465 | 1.40e-03 | 8.46e-03 | 5.39e-03 | 72 |
| hsa051712 | Colorectum | SER | Coronavirus disease - COVID-19 | 98/1580 | 232/8465 | 3.33e-17 | 8.50e-16 | 6.17e-16 | 98 |
| hsa051322 | Colorectum | SER | Salmonella infection | 77/1580 | 249/8465 | 1.56e-06 | 2.35e-05 | 1.71e-05 | 77 |
| hsa051302 | Colorectum | SER | Pathogenic Escherichia coli infection | 60/1580 | 197/8465 | 3.63e-05 | 4.31e-04 | 3.13e-04 | 60 |
| hsa051352 | Colorectum | SER | Yersinia infection | 43/1580 | 137/8465 | 2.15e-04 | 2.10e-03 | 1.52e-03 | 43 |
| hsa051702 | Colorectum | SER | Human immunodeficiency virus 1 infection | 58/1580 | 212/8465 | 1.08e-03 | 8.56e-03 | 6.21e-03 | 58 |
| hsa047222 | Colorectum | SER | Neurotrophin signaling pathway | 35/1580 | 119/8465 | 2.80e-03 | 2.02e-02 | 1.47e-02 | 35 |
| Hugo Symbol | Variant Class | Variant Classification | dbSNP RS | HGVSc | HGVSp | HGVSp Short | SWISSPROT | BIOTYPE | SIFT | PolyPhen | Tumor Sample Barcode | Tissue | Histology | Sex | Age | Stage | Therapy Types | Drugs | Outcome |
| IRAK1 | SNV | Missense_Mutation | | c.1748A>G | p.Asn583Ser | p.N583S | P51617 | protein_coding | tolerated(0.07) | probably_damaging(0.996) | TCGA-A8-A079-01 | Breast | breast invasive carcinoma | Female | >=65 | III/IV | Chemotherapy | 5-fluorouracil | SD |
| IRAK1 | SNV | Missense_Mutation | | c.1263N>C | p.Gln421His | p.Q421H | P51617 | protein_coding | deleterious(0.02) | probably_damaging(0.925) | TCGA-AR-A2LE-01 | Breast | breast invasive carcinoma | Female | >=65 | I/II | Hormone Therapy | tamoxiphen | PD |
| IRAK1 | SNV | Missense_Mutation | rs782334259 | c.1984N>G | p.Ile662Val | p.I662V | P51617 | protein_coding | tolerated(0.1) | probably_damaging(0.984) | TCGA-C8-A1HM-01 | Breast | breast invasive carcinoma | Female | >=65 | I/II | Chemotherapy | doxorubicin | CR |
| IRAK1 | insertion | In_Frame_Ins | novel | c.464_465insCCCCTCTGTGAGATTTCCCGGGGC | p.Pro156_Glu157insSerValArgPheProGlyAlaPro | p.P156_E157insSVRFPGAP | P51617 | protein_coding | | | TCGA-AN-A0FX-01 | Breast | breast invasive carcinoma | Female | <65 | I/II | Unknown | Unknown | SD |
| IRAK1 | SNV | Missense_Mutation | novel | c.335N>A | p.Gly112Asp | p.G112D | P51617 | protein_coding | tolerated(0.16) | benign(0.006) | TCGA-DS-A1OA-01 | Cervix | cervical & endocervical cancer | Female | >=65 | I/II | Chemotherapy | carboplatin | PD |
| IRAK1 | SNV | Missense_Mutation | novel | c.1555N>C | p.Glu519Gln | p.E519Q | P51617 | protein_coding | tolerated(0.15) | probably_damaging(0.998) | TCGA-EA-A3HU-01 | Cervix | cervical & endocervical cancer | Female | <65 | I/II | Unknown | Unknown | SD |
| IRAK1 | insertion | Nonsense_Mutation | novel | c.333_334insTAAA | p.Gly112Ter | p.G112* | P51617 | protein_coding | | | TCGA-DS-A1OA-01 | Cervix | cervical & endocervical cancer | Female | >=65 | I/II | Chemotherapy | carboplatin | PD |
| IRAK1 | SNV | Missense_Mutation | novel | c.505N>G | p.Pro169Ala | p.P169A | P51617 | protein_coding | deleterious(0.01) | benign(0.165) | TCGA-A6-2683-01 | Colorectum | colon adenocarcinoma | Female | <65 | III/IV | Chemotherapy | irinotecan | PD |
| IRAK1 | SNV | Missense_Mutation | | c.1936N>A | p.Ala646Thr | p.A646T | P51617 | protein_coding | tolerated(0.6) | benign(0.015) | TCGA-AA-3663-01 | Colorectum | colon adenocarcinoma | Male | <65 | I/II | Unknown | Unknown | SD |
| IRAK1 | SNV | Missense_Mutation | | c.1141A>T | p.Thr381Ser | p.T381S | P51617 | protein_coding | deleterious(0.01) | possibly_damaging(0.874) | TCGA-CK-4947-01 | Colorectum | colon adenocarcinoma | Female | <65 | III/IV | Other, specify in notes | folinic | SD |
| Entrez ID | Symbol | Category | Interaction Types | Drug Claim Name | Drug Name | PMIDs |
| 3654 | IRAK1 | DRUGGABLE GENOME, KINASE, SERINE THREONINE KINASE, ENZYME, TRANSCRIPTION FACTOR | | PF-562271 | PF-00562271 | |
| 3654 | IRAK1 | DRUGGABLE GENOME, KINASE, SERINE THREONINE KINASE, ENZYME, TRANSCRIPTION FACTOR | inhibitor | 249565765 | | |
| 3654 | IRAK1 | DRUGGABLE GENOME, KINASE, SERINE THREONINE KINASE, ENZYME, TRANSCRIPTION FACTOR | | GEFITINIB | GEFITINIB | |
| 3654 | IRAK1 | DRUGGABLE GENOME, KINASE, SERINE THREONINE KINASE, ENZYME, TRANSCRIPTION FACTOR | | GW441756X | GW441756X | |
| 3654 | IRAK1 | DRUGGABLE GENOME, KINASE, SERINE THREONINE KINASE, ENZYME, TRANSCRIPTION FACTOR | | LINIFANIB | LINIFANIB | |
| 3654 | IRAK1 | DRUGGABLE GENOME, KINASE, SERINE THREONINE KINASE, ENZYME, TRANSCRIPTION FACTOR | inhibitor | 249565764 | | |
| 3654 | IRAK1 | DRUGGABLE GENOME, KINASE, SERINE THREONINE KINASE, ENZYME, TRANSCRIPTION FACTOR | inhibitor | 385612233 | | |
| 3654 | IRAK1 | DRUGGABLE GENOME, KINASE, SERINE THREONINE KINASE, ENZYME, TRANSCRIPTION FACTOR | | TAMATINIB | R-406 | |
| 3654 | IRAK1 | DRUGGABLE GENOME, KINASE, SERINE THREONINE KINASE, ENZYME, TRANSCRIPTION FACTOR | | RG-1530 | RG-1530 | |
| 3654 | IRAK1 | DRUGGABLE GENOME, KINASE, SERINE THREONINE KINASE, ENZYME, TRANSCRIPTION FACTOR | inhibitor | 348353615 | | |


