
|
|||||
|
 | |
| |
| |
| |
| |
| |
|
Gene: IL18 |
Gene summary for IL18 |
| Gene information | Species | Human | Gene symbol | IL18 | Gene ID | 3606 |
| Gene name | interleukin 18 | |
| Gene Alias | IGIF | |
| Cytomap | 11q23.1 | |
| Gene Type | protein-coding | GO ID | GO:0000165 | UniProtAcc | A0A024R3E0 |
Top |
Malignant transformation analysis |
| Identification of the aberrant gene expression in precancerous and cancerous lesions by comparing the gene expression of stem-like cells in diseased tissues with normal stem cells |
| Entrez ID | Symbol | Replicates | Species | Organ | Tissue | Adj P-value | Log2FC | Malignancy |
| 3606 | IL18 | CA_HPV_1 | Human | Cervix | CC | 7.17e-07 | -4.13e-01 | 0.0264 |
| 3606 | IL18 | CA_HPV_3 | Human | Cervix | CC | 1.54e-06 | 2.78e-01 | 0.0414 |
| 3606 | IL18 | CCII_1 | Human | Cervix | CC | 3.98e-14 | -7.13e-01 | 0.3249 |
| 3606 | IL18 | Tumor | Human | Cervix | CC | 5.19e-14 | -5.76e-01 | 0.1241 |
| 3606 | IL18 | sample1 | Human | Cervix | CC | 2.68e-02 | -5.01e-01 | 0.0959 |
| 3606 | IL18 | sample3 | Human | Cervix | CC | 2.27e-20 | -6.28e-01 | 0.1387 |
| 3606 | IL18 | H2 | Human | Cervix | HSIL_HPV | 3.77e-09 | -4.52e-01 | 0.0632 |
| 3606 | IL18 | L1 | Human | Cervix | CC | 2.51e-06 | -5.40e-01 | 0.0802 |
| 3606 | IL18 | T1 | Human | Cervix | CC | 6.31e-12 | -5.72e-01 | 0.0918 |
| 3606 | IL18 | T3 | Human | Cervix | CC | 7.25e-20 | -6.31e-01 | 0.1389 |
| 3606 | IL18 | LZE4T | Human | Esophagus | ESCC | 3.34e-05 | -4.28e-03 | 0.0811 |
| 3606 | IL18 | LZE8T | Human | Esophagus | ESCC | 3.36e-02 | -1.10e-01 | 0.067 |
| 3606 | IL18 | P1T-E | Human | Esophagus | ESCC | 6.47e-05 | -2.62e-02 | 0.0875 |
| 3606 | IL18 | P2T-E | Human | Esophagus | ESCC | 9.22e-04 | -2.95e-01 | 0.1177 |
| 3606 | IL18 | P4T-E | Human | Esophagus | ESCC | 6.80e-12 | 5.69e-01 | 0.1323 |
| 3606 | IL18 | P5T-E | Human | Esophagus | ESCC | 7.84e-28 | 1.01e+00 | 0.1327 |
| 3606 | IL18 | P9T-E | Human | Esophagus | ESCC | 2.13e-11 | 4.21e-01 | 0.1131 |
| 3606 | IL18 | P10T-E | Human | Esophagus | ESCC | 2.68e-07 | 3.22e-01 | 0.116 |
| 3606 | IL18 | P12T-E | Human | Esophagus | ESCC | 3.83e-03 | -2.18e-01 | 0.1122 |
| 3606 | IL18 | P16T-E | Human | Esophagus | ESCC | 3.71e-08 | -3.19e-01 | 0.1153 |
| Page: 1 2 3 4 |
| Tissue | Expression Dynamics | Abbreviation |
| Cervix | 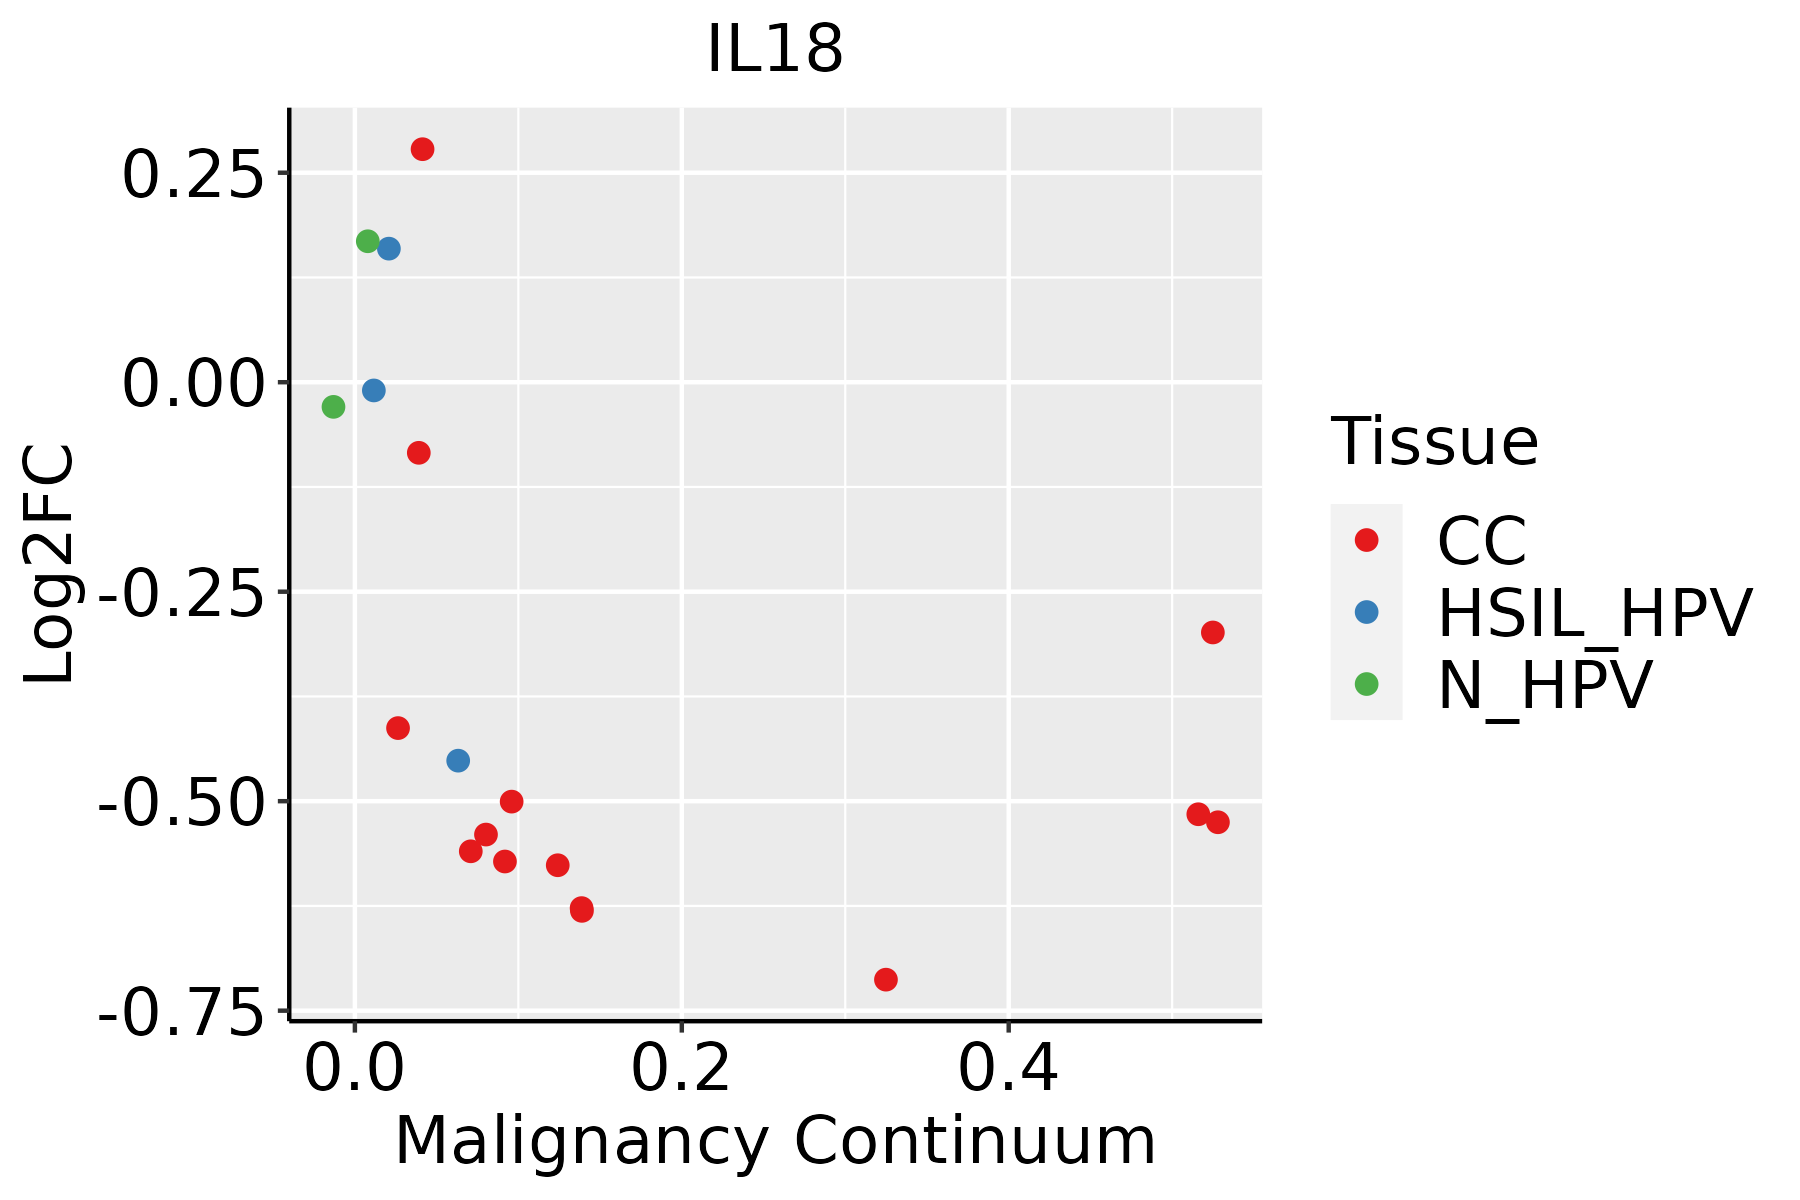 | CC: Cervix cancer |
| HSIL_HPV: HPV-infected high-grade squamous intraepithelial lesions | ||
| N_HPV: HPV-infected normal cervix | ||
| Esophagus | 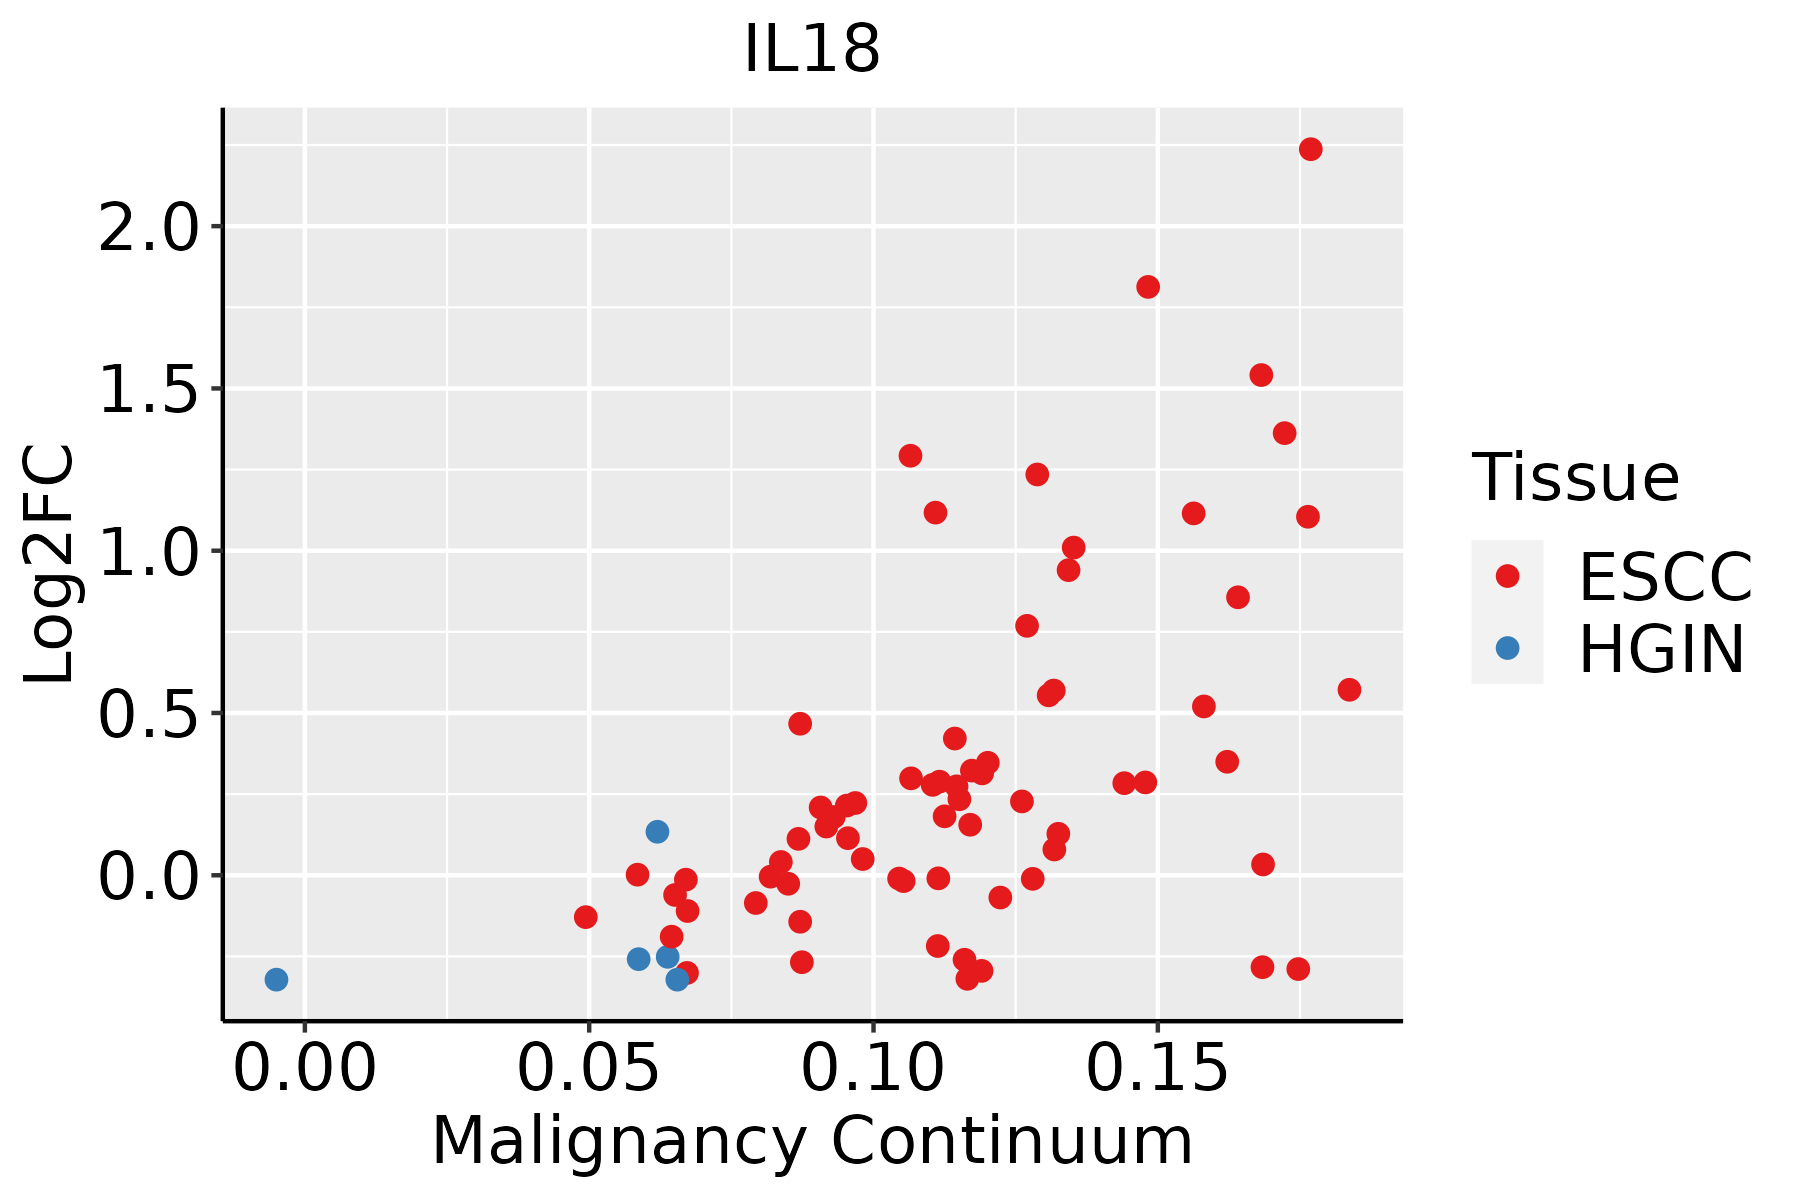 | ESCC: Esophageal squamous cell carcinoma |
| HGIN: High-grade intraepithelial neoplasias | ||
| LGIN: Low-grade intraepithelial neoplasias | ||
| Liver | 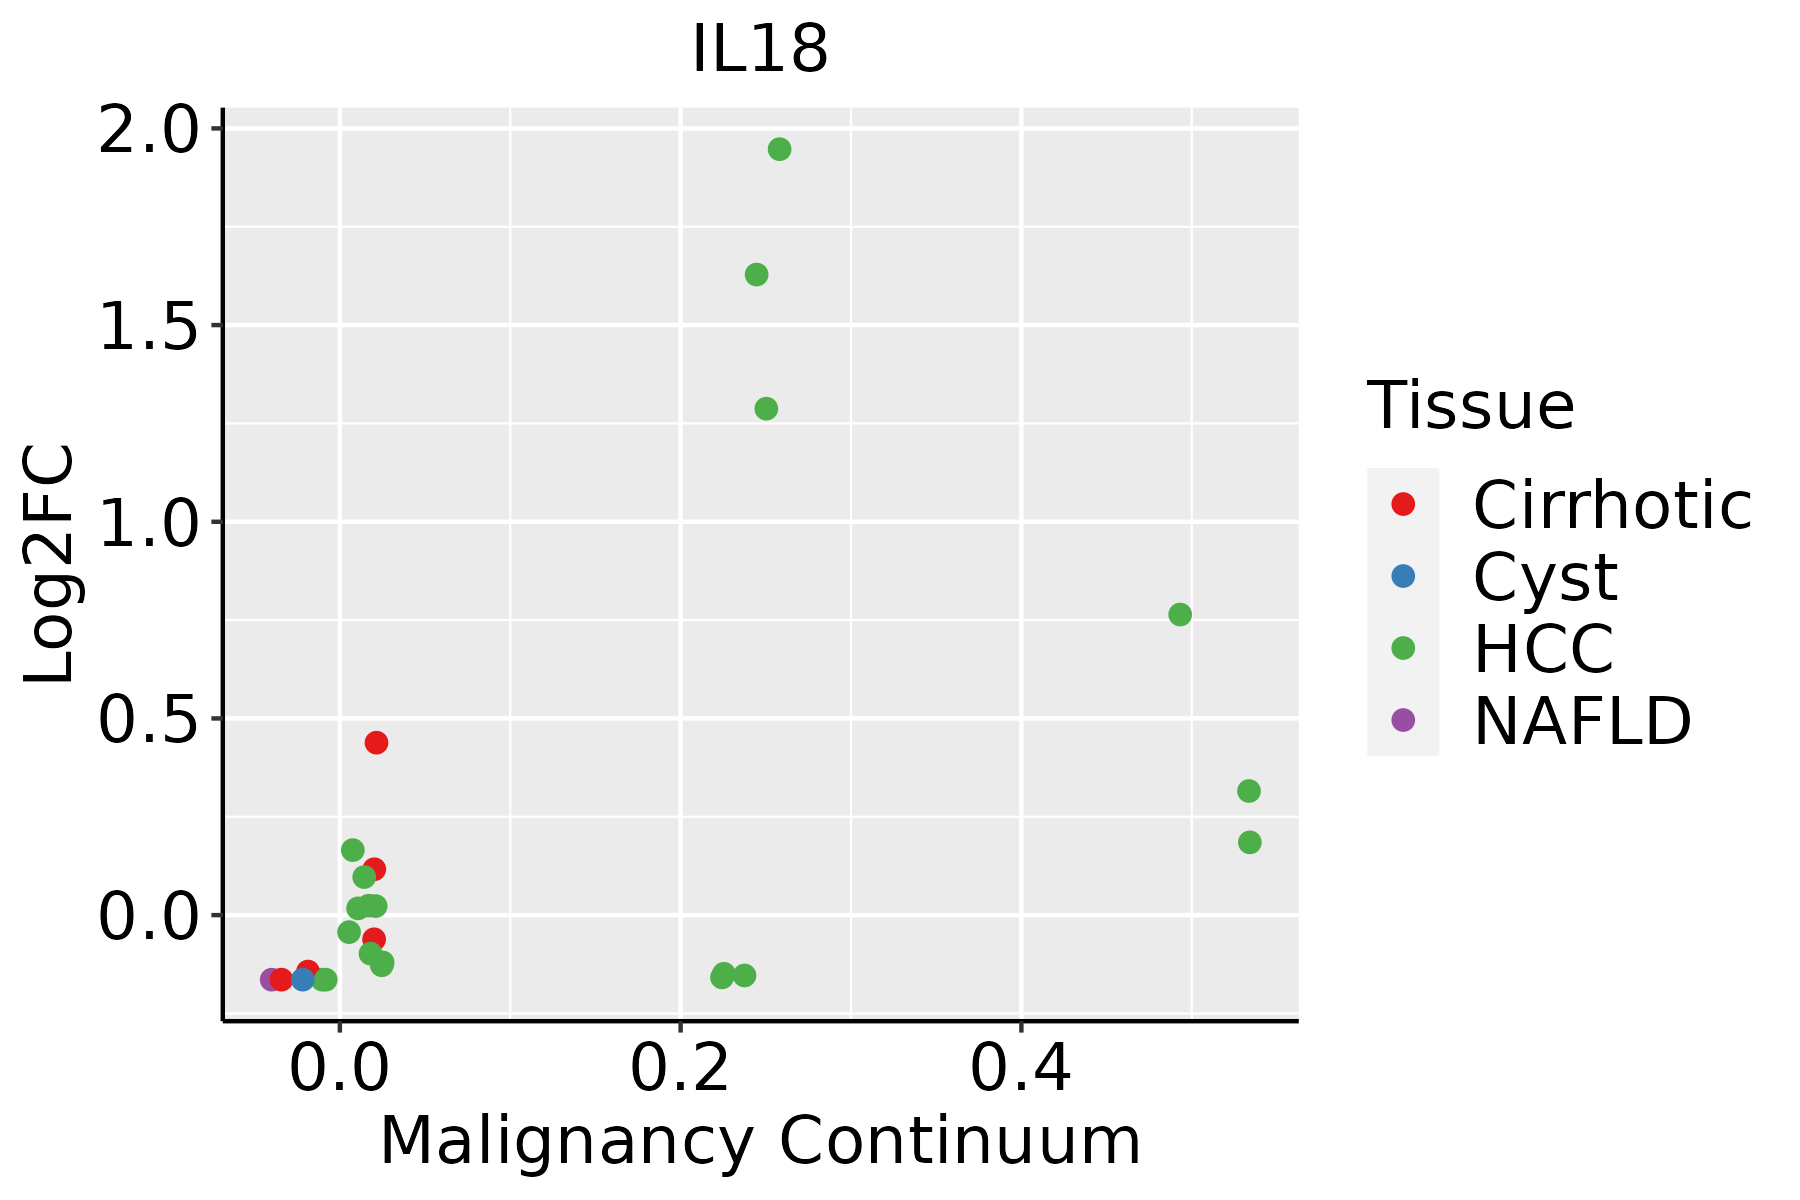 | HCC: Hepatocellular carcinoma |
| NAFLD: Non-alcoholic fatty liver disease | ||
| Oral Cavity | 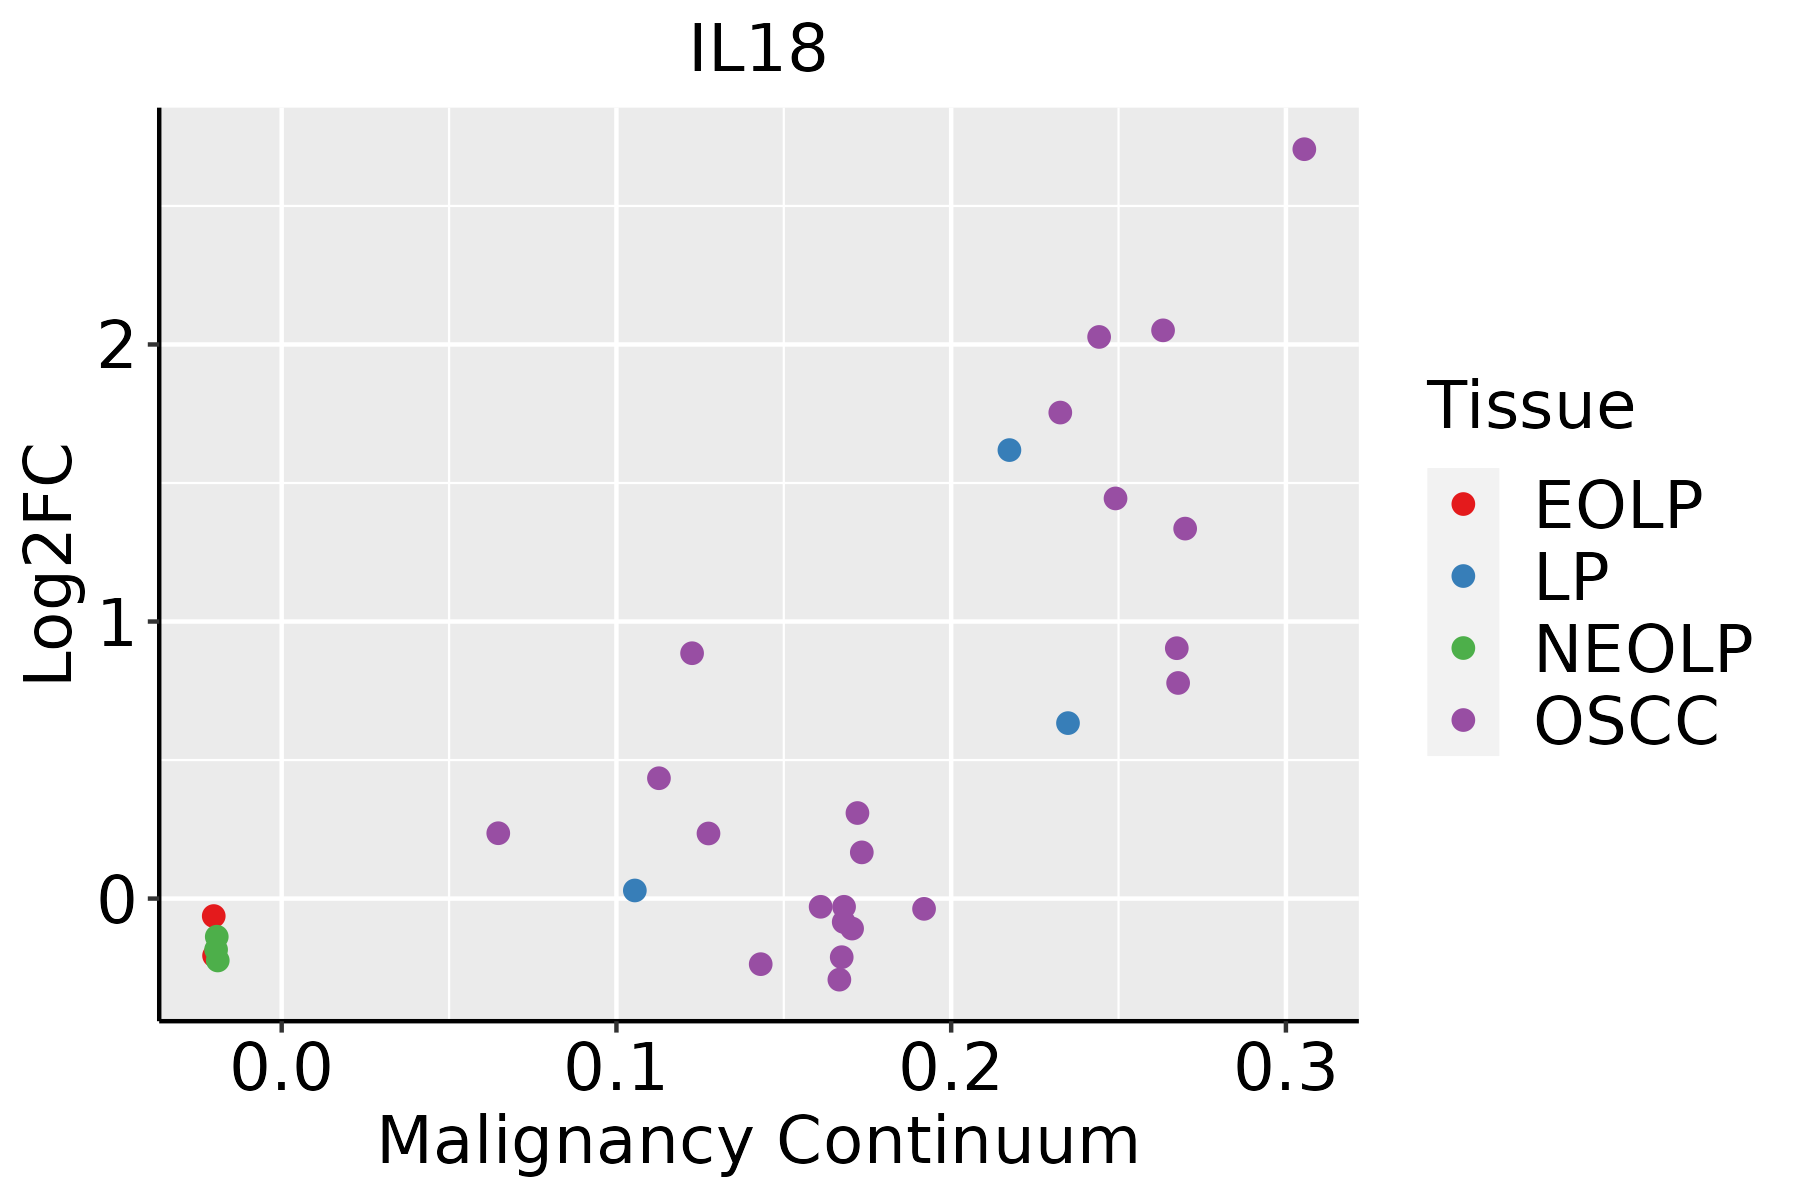 | EOLP: Erosive Oral lichen planus |
| LP: leukoplakia | ||
| NEOLP: Non-erosive oral lichen planus | ||
| OSCC: Oral squamous cell carcinoma | ||
| Skin | 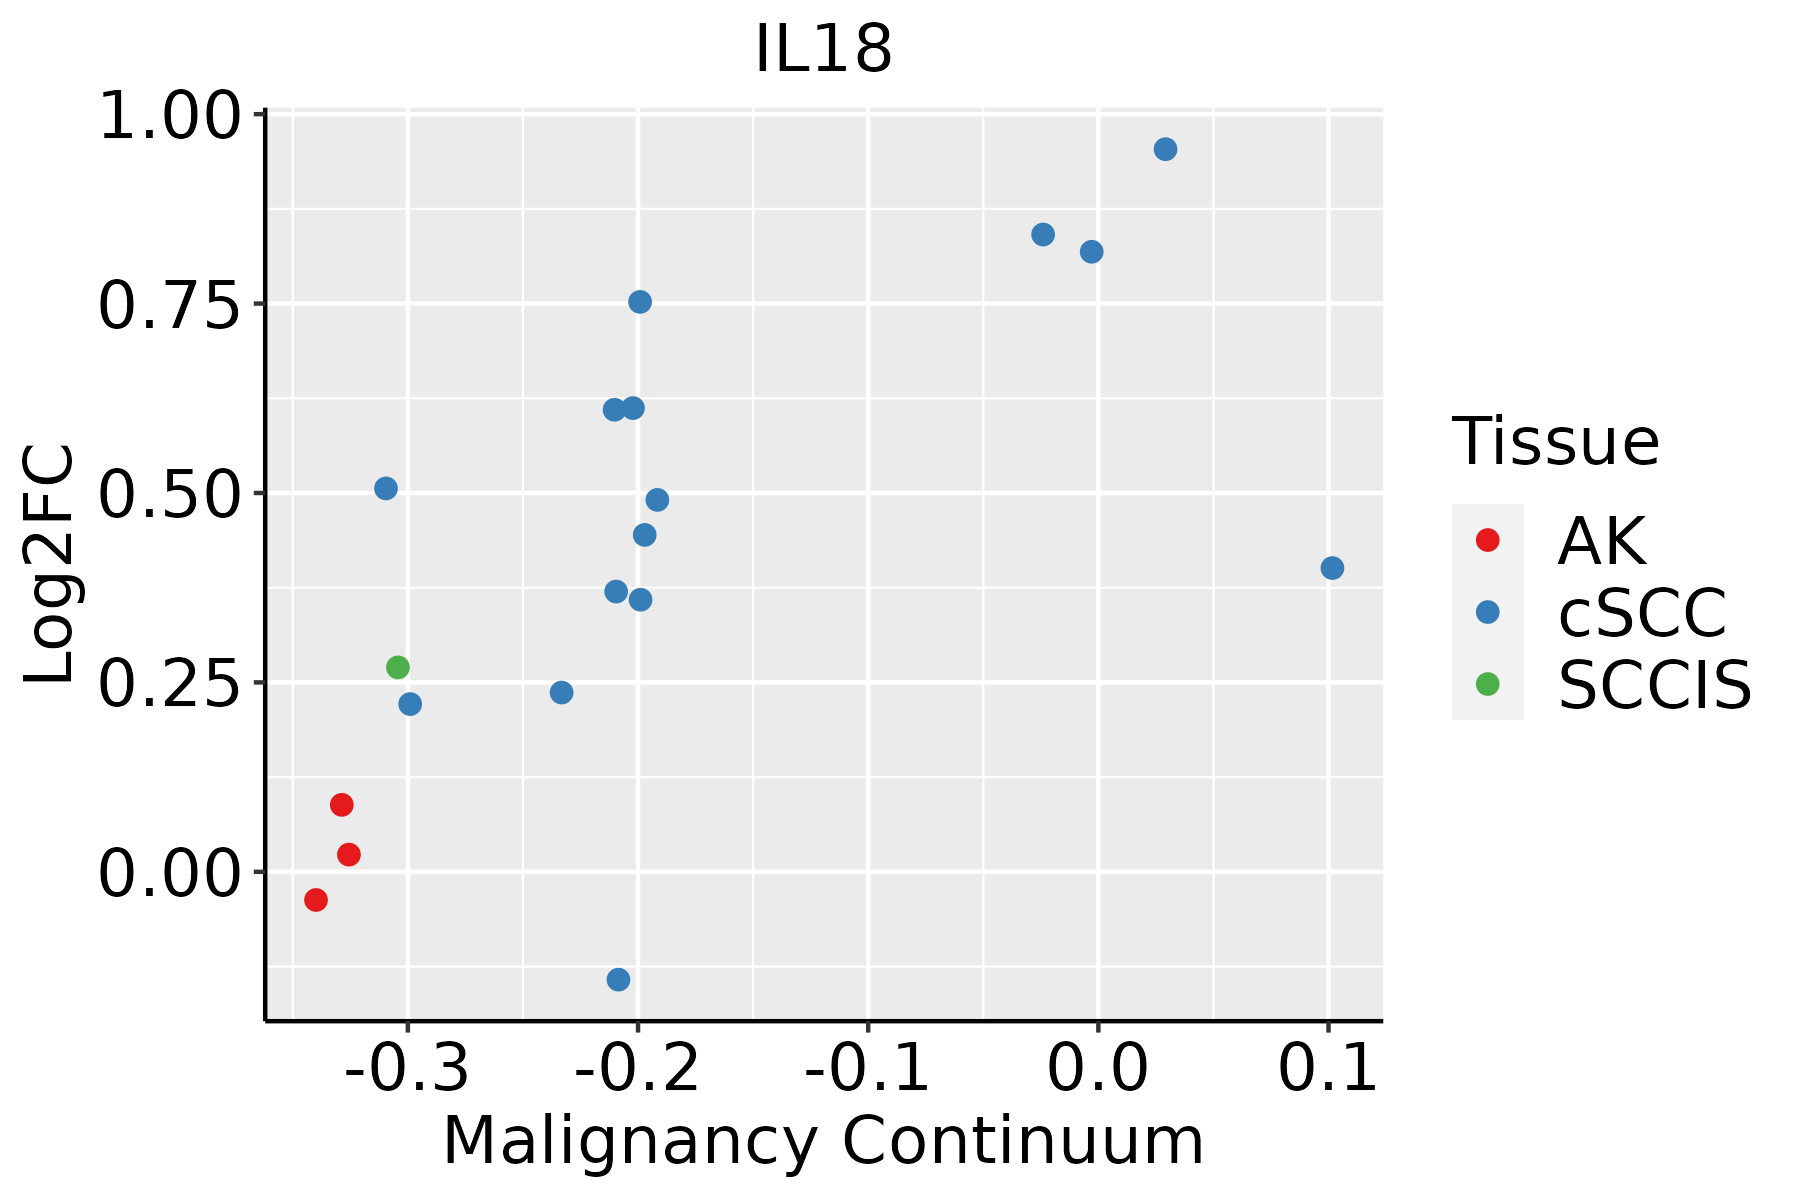 | AK: Actinic keratosis |
| cSCC: Cutaneous squamous cell carcinoma | ||
| SCCIS:squamous cell carcinoma in situ |
| ∗log2FC in expression of this searched gene in stem-like cells from each diseased tissue sample relative to stem-like cells in normal samples in each tissue plotted against the malignancy continuum. Samples are colored based on if they are from different disease stage. |
Top |
Malignant transformation related pathway analysis |
| Find out the enriched GO biological processes and KEGG pathways involved in transition from healthy to precancer to cancer |
| Tissue | Disease Stage | Enriched GO biological Processes |
| Colorectum | AD |  |
| Colorectum | SER |  |
| Colorectum | MSS |  |
| Colorectum | MSI-H |  |
| Colorectum | FAP |  |
| ∗Top 15 enriched GO BP terms are showed in the bar plot of each disease state in each tissue. Each row represents a significant GO biological process which is colored according to the -log10(p.adjust). |
| Page: 1 2 3 4 5 6 7 8 9 |
| GO ID | Tissue | Disease Stage | Description | Gene Ratio | Bg Ratio | pvalue | p.adjust | Count |
| GO:003461420 | Esophagus | ESCC | cellular response to reactive oxygen species | 103/8552 | 155/18723 | 1.34e-07 | 2.17e-06 | 103 |
| GO:00510908 | Esophagus | ESCC | regulation of DNA-binding transcription factor activity | 252/8552 | 440/18723 | 5.22e-07 | 6.97e-06 | 252 |
| GO:00703018 | Esophagus | ESCC | cellular response to hydrogen peroxide | 68/8552 | 98/18723 | 1.70e-06 | 2.03e-05 | 68 |
| GO:00510918 | Esophagus | ESCC | positive regulation of DNA-binding transcription factor activity | 155/8552 | 260/18723 | 3.83e-06 | 4.14e-05 | 155 |
| GO:004586018 | Esophagus | ESCC | positive regulation of protein kinase activity | 219/8552 | 386/18723 | 6.91e-06 | 6.97e-05 | 219 |
| GO:003367420 | Esophagus | ESCC | positive regulation of kinase activity | 260/8552 | 467/18723 | 7.26e-06 | 7.22e-05 | 260 |
| GO:003461220 | Esophagus | ESCC | response to tumor necrosis factor | 149/8552 | 253/18723 | 1.47e-05 | 1.33e-04 | 149 |
| GO:003249619 | Esophagus | ESCC | response to lipopolysaccharide | 191/8552 | 343/18723 | 1.11e-04 | 7.73e-04 | 191 |
| GO:007135620 | Esophagus | ESCC | cellular response to tumor necrosis factor | 132/8552 | 229/18723 | 1.69e-04 | 1.11e-03 | 132 |
| GO:1903706110 | Esophagus | ESCC | regulation of hemopoiesis | 201/8552 | 367/18723 | 2.60e-04 | 1.58e-03 | 201 |
| GO:00510926 | Esophagus | ESCC | positive regulation of NF-kappaB transcription factor activity | 91/8552 | 152/18723 | 2.91e-04 | 1.75e-03 | 91 |
| GO:19021076 | Esophagus | ESCC | positive regulation of leukocyte differentiation | 93/8552 | 157/18723 | 4.20e-04 | 2.39e-03 | 93 |
| GO:19037086 | Esophagus | ESCC | positive regulation of hemopoiesis | 93/8552 | 157/18723 | 4.20e-04 | 2.39e-03 | 93 |
| GO:002240720 | Esophagus | ESCC | regulation of cell-cell adhesion | 239/8552 | 448/18723 | 5.88e-04 | 3.19e-03 | 239 |
| GO:004211018 | Esophagus | ESCC | T cell activation | 256/8552 | 487/18723 | 1.18e-03 | 5.87e-03 | 256 |
| GO:19031317 | Esophagus | ESCC | mononuclear cell differentiation | 226/8552 | 426/18723 | 1.20e-03 | 5.88e-03 | 226 |
| GO:00182124 | Esophagus | ESCC | peptidyl-tyrosine modification | 202/8552 | 378/18723 | 1.34e-03 | 6.39e-03 | 202 |
| GO:002240919 | Esophagus | ESCC | positive regulation of cell-cell adhesion | 155/8552 | 284/18723 | 1.50e-03 | 7.06e-03 | 155 |
| GO:00181084 | Esophagus | ESCC | peptidyl-tyrosine phosphorylation | 200/8552 | 375/18723 | 1.60e-03 | 7.45e-03 | 200 |
| GO:000223719 | Esophagus | ESCC | response to molecule of bacterial origin | 194/8552 | 363/18723 | 1.64e-03 | 7.61e-03 | 194 |
| Page: 1 2 3 4 5 6 7 8 9 10 11 12 13 14 15 16 17 |
| Pathway ID | Tissue | Disease Stage | Description | Gene Ratio | Bg Ratio | pvalue | p.adjust | qvalue | Count |
| hsa0513020 | Cervix | CC | Pathogenic Escherichia coli infection | 63/1267 | 197/8465 | 9.28e-10 | 2.00e-08 | 1.19e-08 | 63 |
| hsa0513220 | Cervix | CC | Salmonella infection | 74/1267 | 249/8465 | 1.33e-09 | 2.54e-08 | 1.50e-08 | 74 |
| hsa0541720 | Cervix | CC | Lipid and atherosclerosis | 65/1267 | 215/8465 | 6.47e-09 | 1.10e-07 | 6.52e-08 | 65 |
| hsa0513120 | Cervix | CC | Shigellosis | 69/1267 | 247/8465 | 7.64e-08 | 1.03e-06 | 6.10e-07 | 69 |
| hsa0513516 | Cervix | CC | Yersinia infection | 39/1267 | 137/8465 | 3.27e-05 | 2.41e-04 | 1.42e-04 | 39 |
| hsa0513416 | Cervix | CC | Legionellosis | 20/1267 | 57/8465 | 1.29e-04 | 8.19e-04 | 4.85e-04 | 20 |
| hsa0516414 | Cervix | CC | Influenza A | 43/1267 | 171/8465 | 3.03e-04 | 1.64e-03 | 9.68e-04 | 43 |
| hsa0532314 | Cervix | CC | Rheumatoid arthritis | 27/1267 | 93/8465 | 3.64e-04 | 1.82e-03 | 1.07e-03 | 27 |
| hsa05152 | Cervix | CC | Tuberculosis | 42/1267 | 180/8465 | 1.78e-03 | 7.21e-03 | 4.26e-03 | 42 |
| hsa046213 | Cervix | CC | NOD-like receptor signaling pathway | 41/1267 | 186/8465 | 5.90e-03 | 1.95e-02 | 1.15e-02 | 41 |
| hsa05130110 | Cervix | CC | Pathogenic Escherichia coli infection | 63/1267 | 197/8465 | 9.28e-10 | 2.00e-08 | 1.19e-08 | 63 |
| hsa05132110 | Cervix | CC | Salmonella infection | 74/1267 | 249/8465 | 1.33e-09 | 2.54e-08 | 1.50e-08 | 74 |
| hsa05417110 | Cervix | CC | Lipid and atherosclerosis | 65/1267 | 215/8465 | 6.47e-09 | 1.10e-07 | 6.52e-08 | 65 |
| hsa05131110 | Cervix | CC | Shigellosis | 69/1267 | 247/8465 | 7.64e-08 | 1.03e-06 | 6.10e-07 | 69 |
| hsa0513517 | Cervix | CC | Yersinia infection | 39/1267 | 137/8465 | 3.27e-05 | 2.41e-04 | 1.42e-04 | 39 |
| hsa0513417 | Cervix | CC | Legionellosis | 20/1267 | 57/8465 | 1.29e-04 | 8.19e-04 | 4.85e-04 | 20 |
| hsa0516415 | Cervix | CC | Influenza A | 43/1267 | 171/8465 | 3.03e-04 | 1.64e-03 | 9.68e-04 | 43 |
| hsa0532315 | Cervix | CC | Rheumatoid arthritis | 27/1267 | 93/8465 | 3.64e-04 | 1.82e-03 | 1.07e-03 | 27 |
| hsa051521 | Cervix | CC | Tuberculosis | 42/1267 | 180/8465 | 1.78e-03 | 7.21e-03 | 4.26e-03 | 42 |
| hsa0462112 | Cervix | CC | NOD-like receptor signaling pathway | 41/1267 | 186/8465 | 5.90e-03 | 1.95e-02 | 1.15e-02 | 41 |
| Page: 1 2 3 4 5 6 7 |
Top |
Cell-cell communication analysis |
| Identification of potential cell-cell interactions between two cell types and their ligand-receptor pairs for different disease states |
| Ligand | Receptor | LRpair | Pathway | Tissue | Disease Stage |
| IL18 | IL18R1_IL18RAP | IL18_IL18R1_IL18RAP | IL1 | Liver | Healthy |
| IL18 | IL18R1_IL18RAP | IL18_IL18R1_IL18RAP | IL1 | Lung | AAH |
| Page: 1 |
Top |
Single-cell gene regulatory network inference analysis |
| Find out the significant the regulons (TFs) and the target genes of each regulon across cell types for different disease states |
| TF | Cell Type | Tissue | Disease Stage | Target Gene | RSS | Regulon Activity |
| ∗The dot plots of a searched regulon are shown for all cell subpopulations in each disease state of each tissue based on the regulon specific score inferred using pySCENIC and by calculating the average expression. |
| Page: 1 |
Top |
Somatic mutation of malignant transformation related genes |
| Annotation of somatic variants for genes involved in malignant transformation |
| Hugo Symbol | Variant Class | Variant Classification | dbSNP RS | HGVSc | HGVSp | HGVSp Short | SWISSPROT | BIOTYPE | SIFT | PolyPhen | Tumor Sample Barcode | Tissue | Histology | Sex | Age | Stage | Therapy Types | Drugs | Outcome |
| IL18 | SNV | Missense_Mutation | c.212N>T | p.Asp71Val | p.D71V | Q14116 | protein_coding | deleterious(0) | probably_damaging(0.992) | TCGA-AO-A1KT-01 | Breast | breast invasive carcinoma | Female | >=65 | I/II | Chemotherapy | fluorouracil | SD | |
| IL18 | SNV | Missense_Mutation | novel | c.48N>A | p.Met16Ile | p.M16I | Q14116 | protein_coding | tolerated(0.1) | benign(0.006) | TCGA-EW-A3E8-01 | Breast | breast invasive carcinoma | Female | <65 | I/II | Hormone Therapy | anastrozole | SD |
| IL18 | insertion | Nonsense_Mutation | novel | c.401_402insATAATGTTTAAAAAATTCATAGTTTGAAAACATTCT | p.Asp134delinsGluTerCysLeuLysAsnSerTerPheGluAsnIleLeu | p.D134delinsE*CLKNS*FENIL | Q14116 | protein_coding | TCGA-A8-A09X-01 | Breast | breast invasive carcinoma | Female | <65 | III/IV | Unknown | Unknown | SD | ||
| IL18 | SNV | Missense_Mutation | c.146G>C | p.Arg49Thr | p.R49T | Q14116 | protein_coding | deleterious(0) | probably_damaging(0.999) | TCGA-AA-3697-01 | Colorectum | colon adenocarcinoma | Male | >=65 | I/II | Unknown | Unknown | SD | |
| IL18 | SNV | Missense_Mutation | novel | c.328C>A | p.Leu110Ile | p.L110I | Q14116 | protein_coding | deleterious(0.01) | probably_damaging(0.999) | TCGA-AZ-4315-01 | Colorectum | colon adenocarcinoma | Male | <65 | I/II | Unknown | Unknown | SD |
| IL18 | SNV | Missense_Mutation | novel | c.53T>G | p.Phe18Cys | p.F18C | Q14116 | protein_coding | deleterious(0) | possibly_damaging(0.903) | TCGA-AZ-4315-01 | Colorectum | colon adenocarcinoma | Male | <65 | I/II | Unknown | Unknown | SD |
| IL18 | deletion | Frame_Shift_Del | c.528delA | p.Glu177ArgfsTer9 | p.E177Rfs*9 | Q14116 | protein_coding | TCGA-A6-2686-01 | Colorectum | colon adenocarcinoma | Female | >=65 | I/II | Unknown | Unknown | SD | |||
| IL18 | SNV | Missense_Mutation | novel | c.539N>C | p.Leu180Ser | p.L180S | Q14116 | protein_coding | tolerated(0.48) | benign(0.001) | TCGA-A5-A0G2-01 | Endometrium | uterine corpus endometrioid carcinoma | Female | <65 | III/IV | Unknown | Unknown | SD |
| IL18 | SNV | Missense_Mutation | novel | c.527N>C | p.Lys176Thr | p.K176T | Q14116 | protein_coding | deleterious(0.02) | benign(0.303) | TCGA-AP-A056-01 | Endometrium | uterine corpus endometrioid carcinoma | Female | <65 | I/II | Unknown | Unknown | SD |
| IL18 | SNV | Missense_Mutation | c.551C>A | p.Ser184Tyr | p.S184Y | Q14116 | protein_coding | deleterious(0) | probably_damaging(0.985) | TCGA-AX-A0J0-01 | Endometrium | uterine corpus endometrioid carcinoma | Female | <65 | I/II | Unknown | Unknown | SD |
| Page: 1 2 |
Top |
Related drugs of malignant transformation related genes |
| Identification of chemicals and drugs interact with genes involved in malignant transfromation |
| (DGIdb 4.0) |
| Entrez ID | Symbol | Category | Interaction Types | Drug Claim Name | Drug Name | PMIDs |
| 3606 | IL18 | DRUGGABLE GENOME | PPD | 11882036 | ||
| 3606 | IL18 | DRUGGABLE GENOME | MEDI-2338 | MEDI-2338 | 24812504 | |
| 3606 | IL18 | DRUGGABLE GENOME | tacrolimus | TACROLIMUS | 25712187,25487141 | |
| 3606 | IL18 | DRUGGABLE GENOME | MYCOPHENOLIC ACID | 12907250 | ||
| 3606 | IL18 | DRUGGABLE GENOME | POLYPHENOL | 16143535 | ||
| 3606 | IL18 | DRUGGABLE GENOME | Iboctadekin | IBOCTADEKIN | ||
| 3606 | IL18 | DRUGGABLE GENOME | COLCHICINE | COLCHICINE | 15281431 | |
| 3606 | IL18 | DRUGGABLE GENOME | THYROXINE | THYROXINE | 16061828 | |
| 3606 | IL18 | DRUGGABLE GENOME | Iboctadekin + Doxil | |||
| 3606 | IL18 | DRUGGABLE GENOME | Iboctadekin + rituximab |
| Page: 1 2 |

Copyright 2023-Present -The University of Texas Health Science Center at Houston |