
|
|||||
|
 | |
| |
| |
| |
| |
| |
|
Gene: IFIT1 |
Gene summary for IFIT1 |
| Gene information | Species | Human | Gene symbol | IFIT1 | Gene ID | 3434 |
| Gene name | interferon induced protein with tetratricopeptide repeats 1 | |
| Gene Alias | C56 | |
| Cytomap | 10q23.31 | |
| Gene Type | protein-coding | GO ID | GO:0002376 | UniProtAcc | P09914 |
Top |
Malignant transformation analysis |
| Identification of the aberrant gene expression in precancerous and cancerous lesions by comparing the gene expression of stem-like cells in diseased tissues with normal stem cells |
| Entrez ID | Symbol | Replicates | Species | Organ | Tissue | Adj P-value | Log2FC | Malignancy |
| 3434 | IFIT1 | GSM4909308 | Human | Breast | IDC | 2.62e-04 | 1.88e-01 | 0.158 |
| 3434 | IFIT1 | NCCBC5 | Human | Breast | DCIS | 3.77e-11 | 5.33e-01 | 0.2046 |
| 3434 | IFIT1 | P1 | Human | Breast | IDC | 5.56e-04 | 3.43e-01 | 0.1527 |
| 3434 | IFIT1 | P2 | Human | Breast | IDC | 1.19e-12 | 5.53e-01 | 0.21 |
| 3434 | IFIT1 | LZE20T | Human | Esophagus | ESCC | 1.06e-02 | 1.02e-01 | 0.0662 |
| 3434 | IFIT1 | LZE24T | Human | Esophagus | ESCC | 7.62e-31 | 1.71e+00 | 0.0596 |
| 3434 | IFIT1 | P1T-E | Human | Esophagus | ESCC | 6.19e-04 | 4.50e-01 | 0.0875 |
| 3434 | IFIT1 | P2T-E | Human | Esophagus | ESCC | 5.50e-20 | 5.77e-01 | 0.1177 |
| 3434 | IFIT1 | P4T-E | Human | Esophagus | ESCC | 6.55e-05 | 2.99e-01 | 0.1323 |
| 3434 | IFIT1 | P8T-E | Human | Esophagus | ESCC | 4.19e-13 | 5.85e-01 | 0.0889 |
| 3434 | IFIT1 | P9T-E | Human | Esophagus | ESCC | 9.99e-35 | 1.09e+00 | 0.1131 |
| 3434 | IFIT1 | P11T-E | Human | Esophagus | ESCC | 3.14e-36 | 1.73e+00 | 0.1426 |
| 3434 | IFIT1 | P15T-E | Human | Esophagus | ESCC | 3.17e-10 | 4.24e-01 | 0.1149 |
| 3434 | IFIT1 | P17T-E | Human | Esophagus | ESCC | 1.28e-09 | 7.94e-01 | 0.1278 |
| 3434 | IFIT1 | P20T-E | Human | Esophagus | ESCC | 4.22e-06 | 7.02e-01 | 0.1124 |
| 3434 | IFIT1 | P21T-E | Human | Esophagus | ESCC | 6.45e-13 | 5.27e-01 | 0.1617 |
| 3434 | IFIT1 | P23T-E | Human | Esophagus | ESCC | 2.32e-09 | 4.39e-01 | 0.108 |
| 3434 | IFIT1 | P24T-E | Human | Esophagus | ESCC | 3.30e-16 | 7.04e-01 | 0.1287 |
| 3434 | IFIT1 | P27T-E | Human | Esophagus | ESCC | 7.51e-13 | 4.76e-01 | 0.1055 |
| 3434 | IFIT1 | P28T-E | Human | Esophagus | ESCC | 6.65e-37 | 1.18e+00 | 0.1149 |
| Page: 1 2 3 4 |
| Tissue | Expression Dynamics | Abbreviation |
| Breast |  | IDC: Invasive ductal carcinoma |
| DCIS: Ductal carcinoma in situ | ||
| Precancer(BRCA1-mut): Precancerous lesion from BRCA1 mutation carriers | ||
| Esophagus |  | ESCC: Esophageal squamous cell carcinoma |
| HGIN: High-grade intraepithelial neoplasias | ||
| LGIN: Low-grade intraepithelial neoplasias | ||
| Liver | 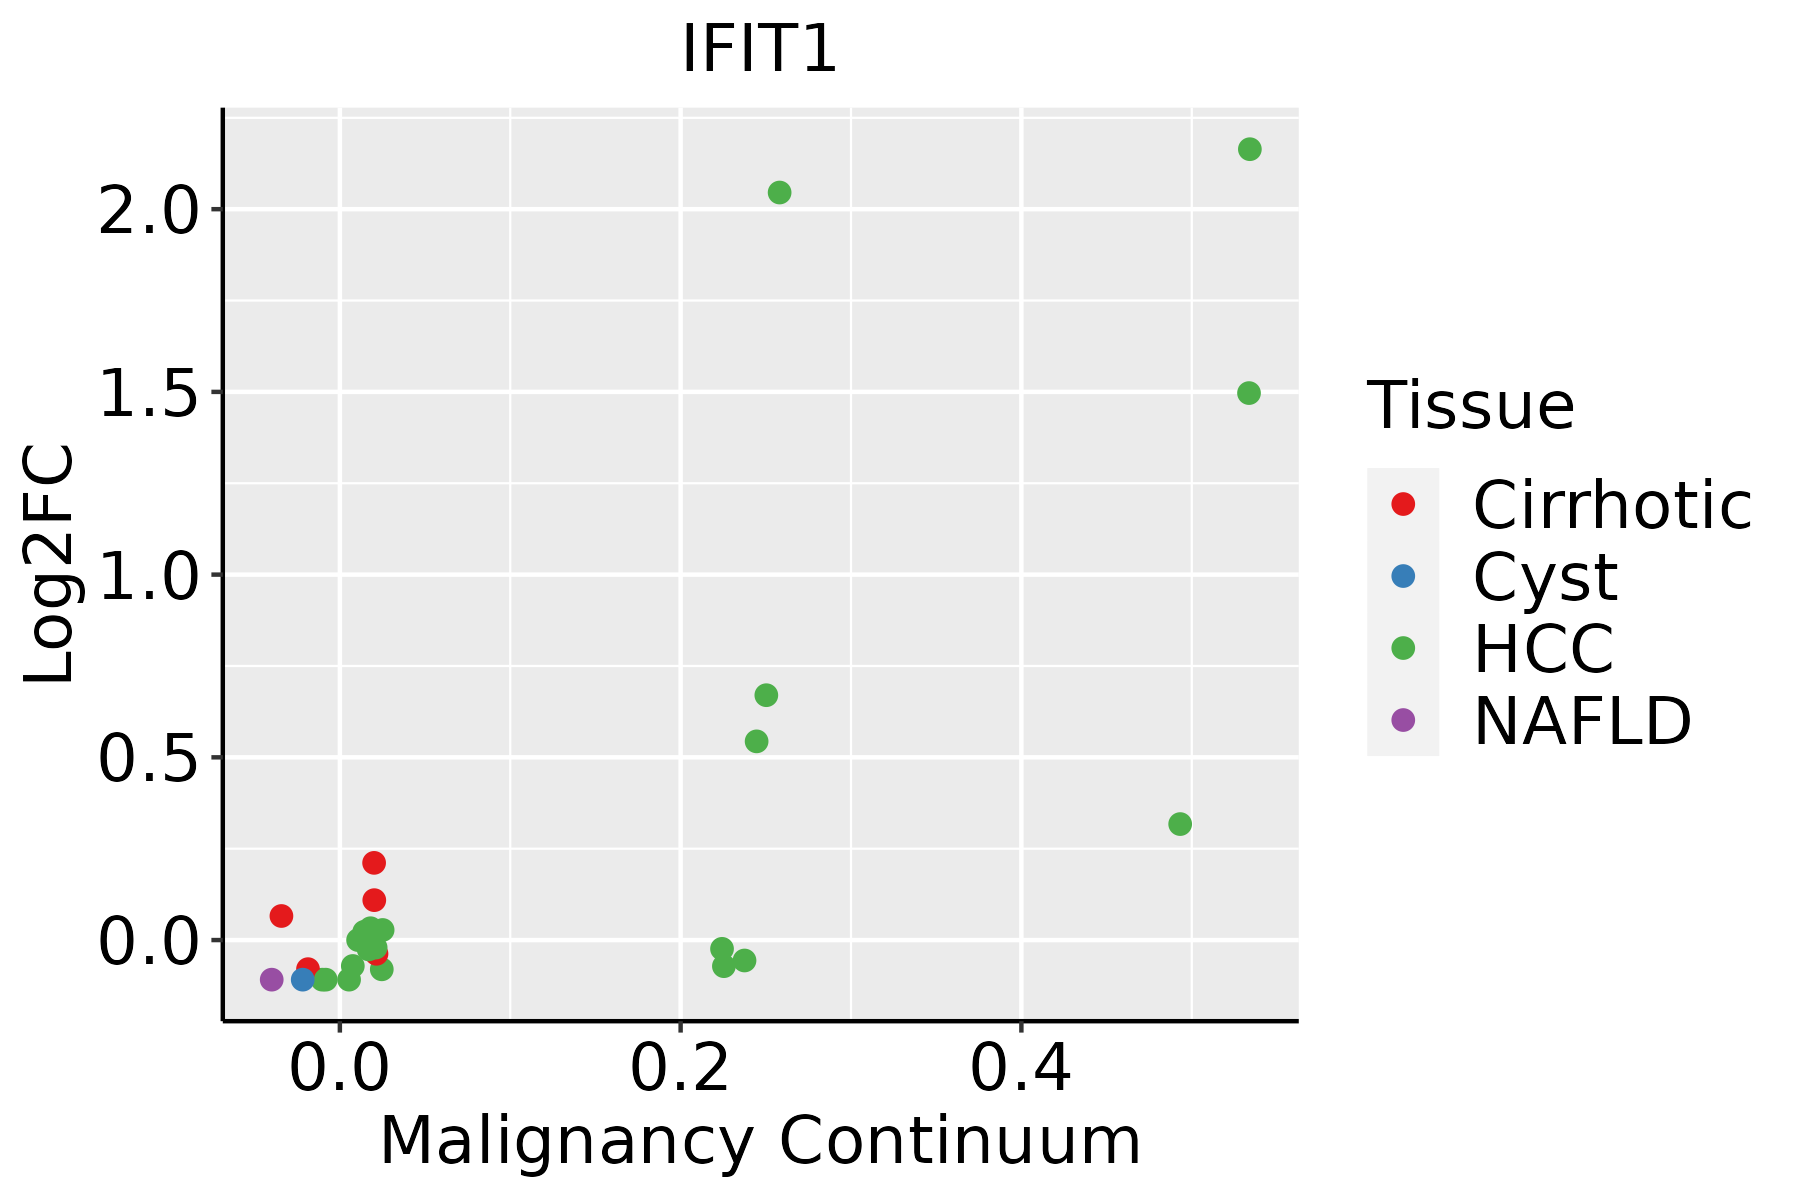 | HCC: Hepatocellular carcinoma |
| NAFLD: Non-alcoholic fatty liver disease | ||
| Oral Cavity | 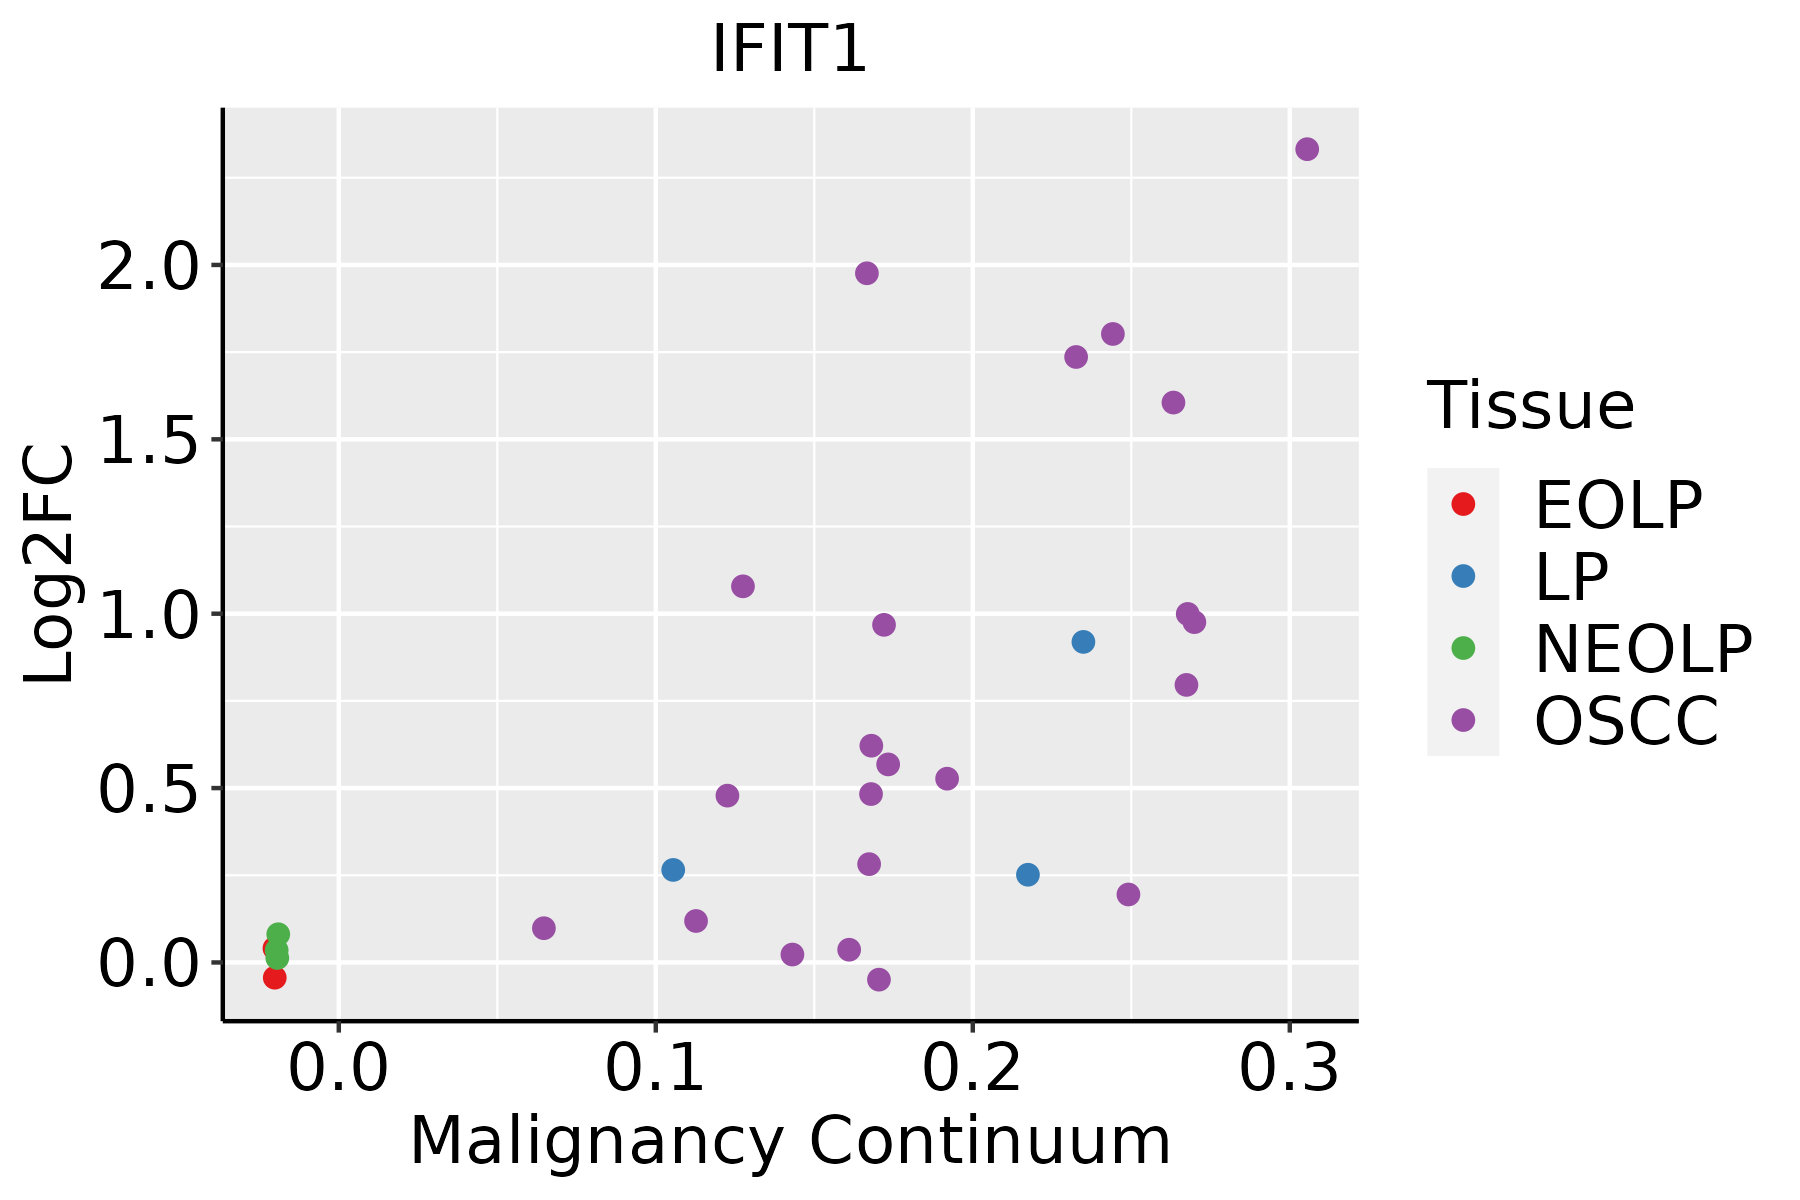 | EOLP: Erosive Oral lichen planus |
| LP: leukoplakia | ||
| NEOLP: Non-erosive oral lichen planus | ||
| OSCC: Oral squamous cell carcinoma | ||
| Skin | 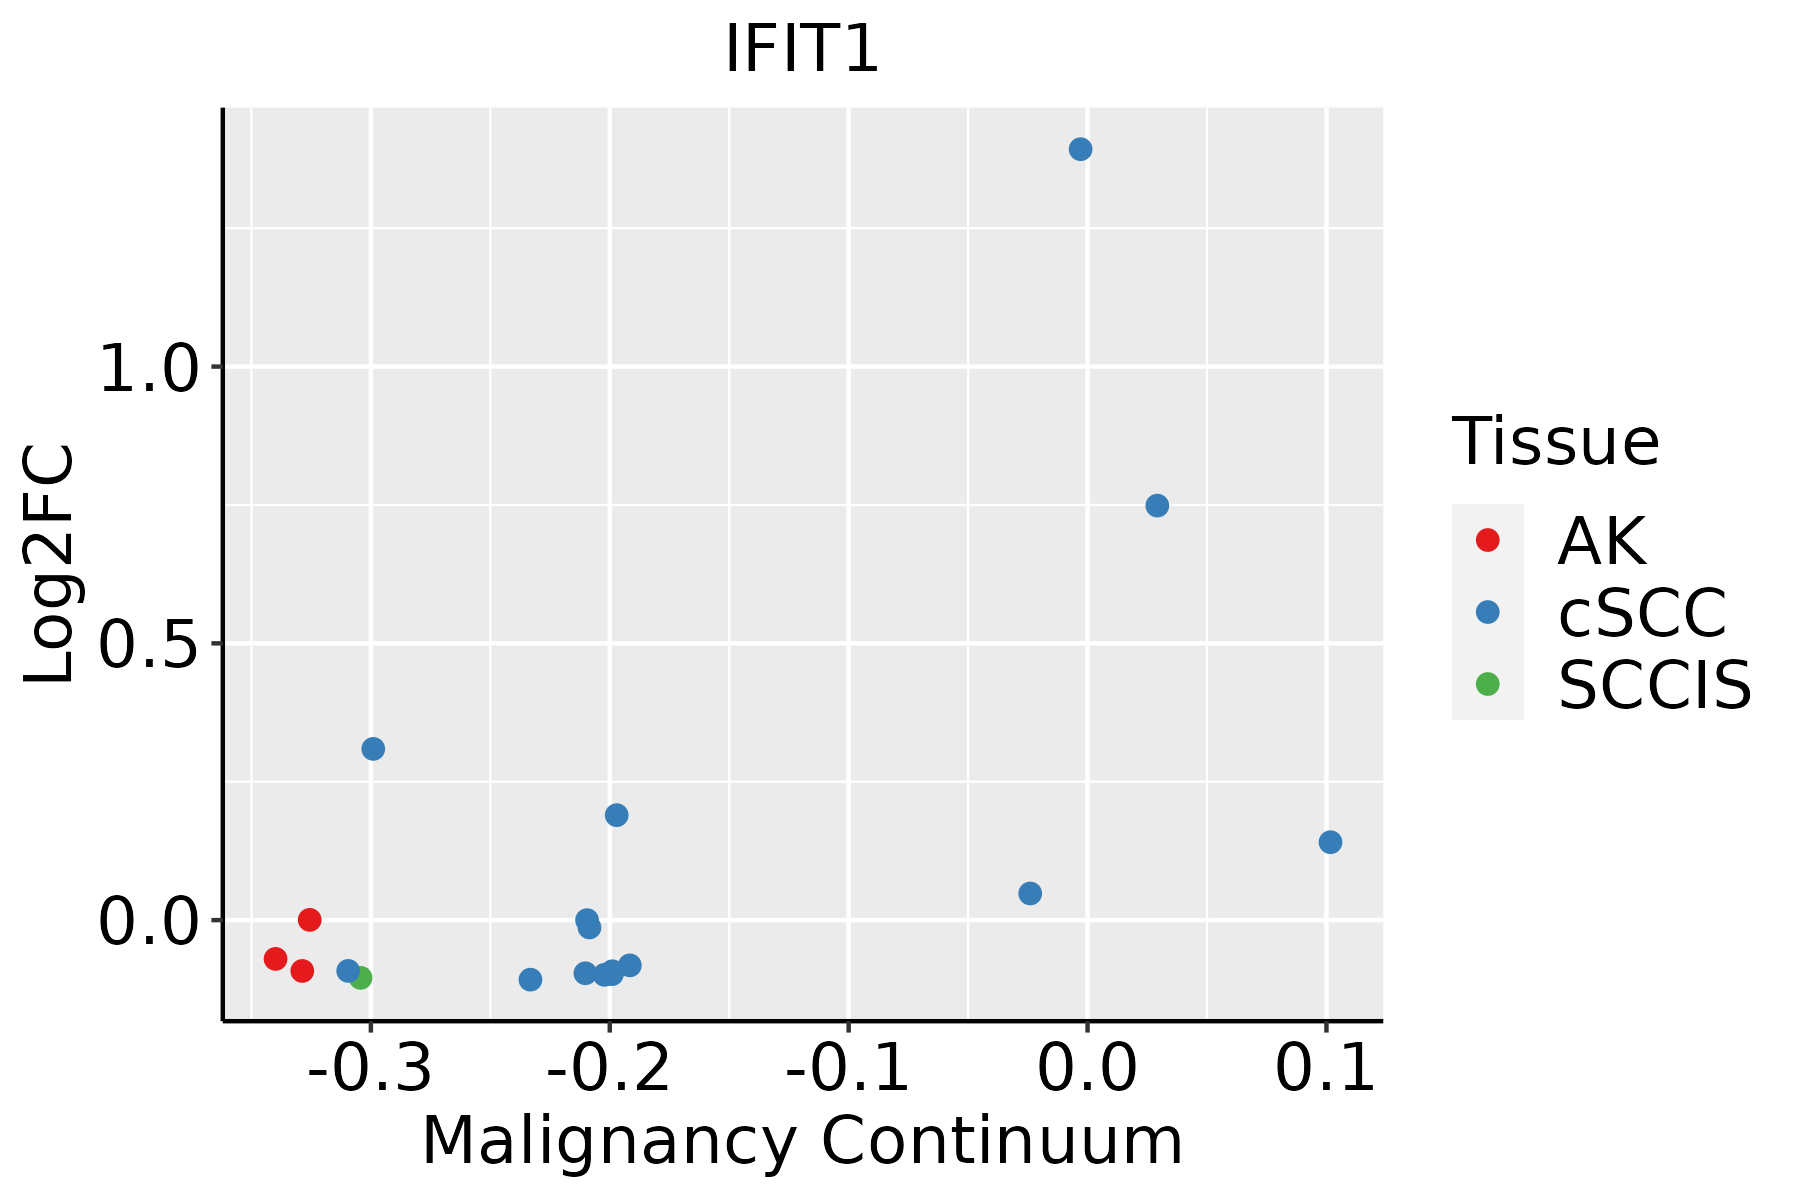 | AK: Actinic keratosis |
| cSCC: Cutaneous squamous cell carcinoma | ||
| SCCIS:squamous cell carcinoma in situ | ||
| Thyroid |  | ATC: Anaplastic thyroid cancer |
| HT: Hashimoto's thyroiditis | ||
| PTC: Papillary thyroid cancer |
| ∗log2FC in expression of this searched gene in stem-like cells from each diseased tissue sample relative to stem-like cells in normal samples in each tissue plotted against the malignancy continuum. Samples are colored based on if they are from different disease stage. |
Top |
Malignant transformation related pathway analysis |
| Find out the enriched GO biological processes and KEGG pathways involved in transition from healthy to precancer to cancer |
| Tissue | Disease Stage | Enriched GO biological Processes |
| Colorectum | AD |  |
| Colorectum | SER |  |
| Colorectum | MSS |  |
| Colorectum | MSI-H |  |
| Colorectum | FAP |  |
| ∗Top 15 enriched GO BP terms are showed in the bar plot of each disease state in each tissue. Each row represents a significant GO biological process which is colored according to the -log10(p.adjust). |
| Page: 1 2 3 4 5 6 7 8 9 |
| GO ID | Tissue | Disease Stage | Description | Gene Ratio | Bg Ratio | pvalue | p.adjust | Count |
| GO:005109827 | Skin | cSCC | regulation of binding | 152/4864 | 363/18723 | 2.21e-11 | 1.10e-09 | 152 |
| GO:000961522 | Skin | cSCC | response to virus | 152/4864 | 367/18723 | 5.88e-11 | 2.75e-09 | 152 |
| GO:004440328 | Skin | cSCC | biological process involved in symbiotic interaction | 126/4864 | 290/18723 | 6.39e-11 | 2.97e-09 | 126 |
| GO:0048524111 | Skin | cSCC | positive regulation of viral process | 40/4864 | 65/18723 | 1.60e-09 | 5.97e-08 | 40 |
| GO:005170129 | Skin | cSCC | biological process involved in interaction with host | 91/4864 | 203/18723 | 4.30e-09 | 1.45e-07 | 91 |
| GO:0050792112 | Skin | cSCC | regulation of viral process | 77/4864 | 164/18723 | 5.38e-09 | 1.78e-07 | 77 |
| GO:0045069111 | Skin | cSCC | regulation of viral genome replication | 46/4864 | 85/18723 | 3.08e-08 | 8.30e-07 | 46 |
| GO:003434014 | Skin | cSCC | response to type I interferon | 35/4864 | 58/18723 | 3.43e-08 | 9.08e-07 | 35 |
| GO:007135713 | Skin | cSCC | cellular response to type I interferon | 32/4864 | 52/18723 | 6.87e-08 | 1.72e-06 | 32 |
| GO:1903900112 | Skin | cSCC | regulation of viral life cycle | 68/4864 | 148/18723 | 1.17e-07 | 2.77e-06 | 68 |
| GO:00516076 | Skin | cSCC | defense response to virus | 107/4864 | 265/18723 | 1.84e-07 | 4.02e-06 | 107 |
| GO:01405466 | Skin | cSCC | defense response to symbiont | 107/4864 | 265/18723 | 1.84e-07 | 4.02e-06 | 107 |
| GO:004507016 | Skin | cSCC | positive regulation of viral genome replication | 21/4864 | 30/18723 | 5.52e-07 | 1.06e-05 | 21 |
| GO:004339325 | Skin | cSCC | regulation of protein binding | 79/4864 | 196/18723 | 7.59e-06 | 1.04e-04 | 79 |
| GO:005110025 | Skin | cSCC | negative regulation of binding | 67/4864 | 162/18723 | 1.34e-05 | 1.68e-04 | 67 |
| GO:003209117 | Skin | cSCC | negative regulation of protein binding | 43/4864 | 94/18723 | 2.68e-05 | 3.03e-04 | 43 |
| GO:00450719 | Skin | cSCC | negative regulation of viral genome replication | 27/4864 | 56/18723 | 2.84e-04 | 2.27e-03 | 27 |
| GO:000283122 | Skin | cSCC | regulation of response to biotic stimulus | 112/4864 | 327/18723 | 5.00e-04 | 3.76e-03 | 112 |
| GO:007135911 | Skin | cSCC | cellular response to dsRNA | 13/4864 | 22/18723 | 1.03e-03 | 6.94e-03 | 13 |
| GO:004852517 | Skin | cSCC | negative regulation of viral process | 37/4864 | 92/18723 | 1.94e-03 | 1.17e-02 | 37 |
| Page: 1 2 3 4 5 6 7 8 9 10 11 12 |
| Pathway ID | Tissue | Disease Stage | Description | Gene Ratio | Bg Ratio | pvalue | p.adjust | qvalue | Count |
| hsa051609 | Esophagus | ESCC | Hepatitis C | 107/4205 | 157/8465 | 1.75e-06 | 1.08e-05 | 5.55e-06 | 107 |
| hsa0516016 | Esophagus | ESCC | Hepatitis C | 107/4205 | 157/8465 | 1.75e-06 | 1.08e-05 | 5.55e-06 | 107 |
| hsa051605 | Liver | Cirrhotic | Hepatitis C | 63/2530 | 157/8465 | 3.67e-03 | 1.49e-02 | 9.20e-03 | 63 |
| hsa0516012 | Liver | Cirrhotic | Hepatitis C | 63/2530 | 157/8465 | 3.67e-03 | 1.49e-02 | 9.20e-03 | 63 |
| hsa0516021 | Liver | HCC | Hepatitis C | 94/4020 | 157/8465 | 1.11e-03 | 4.10e-03 | 2.28e-03 | 94 |
| hsa0516031 | Liver | HCC | Hepatitis C | 94/4020 | 157/8465 | 1.11e-03 | 4.10e-03 | 2.28e-03 | 94 |
| hsa051608 | Oral cavity | OSCC | Hepatitis C | 103/3704 | 157/8465 | 2.17e-08 | 1.96e-07 | 9.99e-08 | 103 |
| hsa0516015 | Oral cavity | OSCC | Hepatitis C | 103/3704 | 157/8465 | 2.17e-08 | 1.96e-07 | 9.99e-08 | 103 |
| hsa0516024 | Oral cavity | LP | Hepatitis C | 73/2418 | 157/8465 | 1.14e-06 | 1.36e-05 | 8.74e-06 | 73 |
| hsa0516034 | Oral cavity | LP | Hepatitis C | 73/2418 | 157/8465 | 1.14e-06 | 1.36e-05 | 8.74e-06 | 73 |
| Page: 1 |
Top |
Cell-cell communication analysis |
| Identification of potential cell-cell interactions between two cell types and their ligand-receptor pairs for different disease states |
| Ligand | Receptor | LRpair | Pathway | Tissue | Disease Stage |
| Page: 1 |
Top |
Single-cell gene regulatory network inference analysis |
| Find out the significant the regulons (TFs) and the target genes of each regulon across cell types for different disease states |
| TF | Cell Type | Tissue | Disease Stage | Target Gene | RSS | Regulon Activity |
| ∗The dot plots of a searched regulon are shown for all cell subpopulations in each disease state of each tissue based on the regulon specific score inferred using pySCENIC and by calculating the average expression. |
| Page: 1 |
Top |
Somatic mutation of malignant transformation related genes |
| Annotation of somatic variants for genes involved in malignant transformation |
| Hugo Symbol | Variant Class | Variant Classification | dbSNP RS | HGVSc | HGVSp | HGVSp Short | SWISSPROT | BIOTYPE | SIFT | PolyPhen | Tumor Sample Barcode | Tissue | Histology | Sex | Age | Stage | Therapy Types | Drugs | Outcome |
| IFIT1 | SNV | Missense_Mutation | rs747305726 | c.970N>C | p.Ser324Pro | p.S324P | P09914 | protein_coding | tolerated(0.07) | benign(0.035) | TCGA-A8-A096-01 | Breast | breast invasive carcinoma | Female | >=65 | I/II | Unknown | Unknown | SD |
| IFIT1 | SNV | Missense_Mutation | c.1413G>C | p.Glu471Asp | p.E471D | P09914 | protein_coding | tolerated(0.07) | benign(0.006) | TCGA-AC-A23H-01 | Breast | breast invasive carcinoma | Female | >=65 | I/II | Unknown | Unknown | PD | |
| IFIT1 | SNV | Missense_Mutation | novel | c.897N>T | p.Met299Ile | p.M299I | P09914 | protein_coding | tolerated(0.21) | benign(0) | TCGA-AN-A046-01 | Breast | breast invasive carcinoma | Female | >=65 | I/II | Unknown | Unknown | SD |
| IFIT1 | SNV | Missense_Mutation | c.497N>T | p.Lys166Met | p.K166M | P09914 | protein_coding | deleterious(0.03) | probably_damaging(0.989) | TCGA-B6-A0WV-01 | Breast | breast invasive carcinoma | Female | >=65 | I/II | Unknown | Unknown | SD | |
| IFIT1 | SNV | Missense_Mutation | novel | c.1232N>T | p.Ala411Val | p.A411V | P09914 | protein_coding | tolerated(0.28) | benign(0) | TCGA-PE-A5DD-01 | Breast | breast invasive carcinoma | Female | <65 | I/II | Chemotherapy | CR | |
| IFIT1 | insertion | In_Frame_Ins | novel | c.152_153insAATTTTGTCAAATGCTTTTCCTGCATCAAT | p.Ser51delinsArgIleLeuSerAsnAlaPheProAlaSerIle | p.S51delinsRILSNAFPASI | P09914 | protein_coding | TCGA-A8-A09E-01 | Breast | breast invasive carcinoma | Female | >=65 | III/IV | Hormone Therapy | anastrozole | SD | ||
| IFIT1 | insertion | Frame_Shift_Ins | novel | c.792_793insCATGACAACCAAGCAAATGTGAGGAGTCTGGTGACCTG | p.Gly265HisfsTer23 | p.G265Hfs*23 | P09914 | protein_coding | TCGA-AO-A0JB-01 | Breast | breast invasive carcinoma | Female | <65 | III/IV | Chemotherapy | cyclophosphamide | SD | ||
| IFIT1 | deletion | In_Frame_Del | c.462_464delNNN | p.Lys155del | p.K155del | P09914 | protein_coding | TCGA-C8-A1HJ-01 | Breast | breast invasive carcinoma | Female | <65 | I/II | Unknown | Unknown | SD | |||
| IFIT1 | deletion | Frame_Shift_Del | c.822delN | p.Lys276ArgfsTer16 | p.K276Rfs*16 | P09914 | protein_coding | TCGA-D8-A1XQ-01 | Breast | breast invasive carcinoma | Female | >=65 | I/II | Unknown | Unknown | SD | |||
| IFIT1 | SNV | Missense_Mutation | c.404N>T | p.Arg135Ile | p.R135I | P09914 | protein_coding | deleterious(0) | benign(0.325) | TCGA-A6-6141-01 | Colorectum | colon adenocarcinoma | Male | <65 | I/II | Chemotherapy | 5-fu | SD |
| Page: 1 2 3 4 5 |
Top |
Related drugs of malignant transformation related genes |
| Identification of chemicals and drugs interact with genes involved in malignant transfromation |
| (DGIdb 4.0) |
| Entrez ID | Symbol | Category | Interaction Types | Drug Claim Name | Drug Name | PMIDs |
| Page: 1 |

Copyright 2023-Present -The University of Texas Health Science Center at Houston |