
|
|||||
|
 | |
| |
| |
| |
| |
| |
|
Gene: HHEX |
Gene summary for HHEX |
| Gene information | Species | Human | Gene symbol | HHEX | Gene ID | 3087 |
| Gene name | hematopoietically expressed homeobox | |
| Gene Alias | HEX | |
| Cytomap | 10q23.33 | |
| Gene Type | protein-coding | GO ID | GO:0000079 | UniProtAcc | Q03014 |
Top |
Malignant transformation analysis |
| Identification of the aberrant gene expression in precancerous and cancerous lesions by comparing the gene expression of stem-like cells in diseased tissues with normal stem cells |
| Entrez ID | Symbol | Replicates | Species | Organ | Tissue | Adj P-value | Log2FC | Malignancy |
| 3087 | HHEX | S43 | Human | Liver | Cirrhotic | 2.23e-14 | -3.78e-01 | -0.0187 |
| 3087 | HHEX | HCC1_Meng | Human | Liver | HCC | 5.44e-86 | -3.55e-02 | 0.0246 |
| 3087 | HHEX | HCC2_Meng | Human | Liver | HCC | 5.48e-13 | -3.50e-01 | 0.0107 |
| 3087 | HHEX | cirrhotic1 | Human | Liver | Cirrhotic | 2.76e-11 | 2.65e-01 | 0.0202 |
| 3087 | HHEX | cirrhotic2 | Human | Liver | Cirrhotic | 4.64e-20 | 3.73e-01 | 0.0201 |
| 3087 | HHEX | HCC1 | Human | Liver | HCC | 1.40e-03 | 3.58e+00 | 0.5336 |
| 3087 | HHEX | HCC2 | Human | Liver | HCC | 8.68e-05 | 3.17e+00 | 0.5341 |
| 3087 | HHEX | HCC5 | Human | Liver | HCC | 6.38e-11 | -1.61e-01 | 0.4932 |
| 3087 | HHEX | Pt13.b | Human | Liver | HCC | 1.87e-06 | -9.11e-02 | 0.0251 |
| 3087 | HHEX | Pt13.c | Human | Liver | HCC | 2.77e-03 | -3.69e-01 | 0.0076 |
| 3087 | HHEX | S016 | Human | Liver | HCC | 9.45e-06 | -3.64e-01 | 0.2243 |
| 3087 | HHEX | S027 | Human | Liver | HCC | 4.05e-02 | 6.80e-01 | 0.2446 |
| 3087 | HHEX | S028 | Human | Liver | HCC | 6.28e-08 | 8.42e-01 | 0.2503 |
| 3087 | HHEX | S029 | Human | Liver | HCC | 8.44e-10 | 9.87e-01 | 0.2581 |
| 3087 | HHEX | Adj_PTCwithHT_6 | Human | Thyroid | HT | 1.01e-03 | -4.94e-01 | 0.02 |
| 3087 | HHEX | PTCwithHT_6 | Human | Thyroid | HT | 7.66e-04 | -5.10e-01 | 0.02 |
| 3087 | HHEX | PTCwithHT_8 | Human | Thyroid | HT | 1.06e-04 | -4.55e-01 | 0.0351 |
| 3087 | HHEX | PTCwithoutHT_2 | Human | Thyroid | PTC | 3.73e-02 | -4.20e-01 | 0.0419 |
| 3087 | HHEX | male-WTA | Human | Thyroid | PTC | 1.28e-59 | 2.99e-01 | 0.1037 |
| 3087 | HHEX | PTC01 | Human | Thyroid | PTC | 2.74e-10 | 5.74e-01 | 0.1899 |
| Page: 1 2 |
| Tissue | Expression Dynamics | Abbreviation |
| Liver | 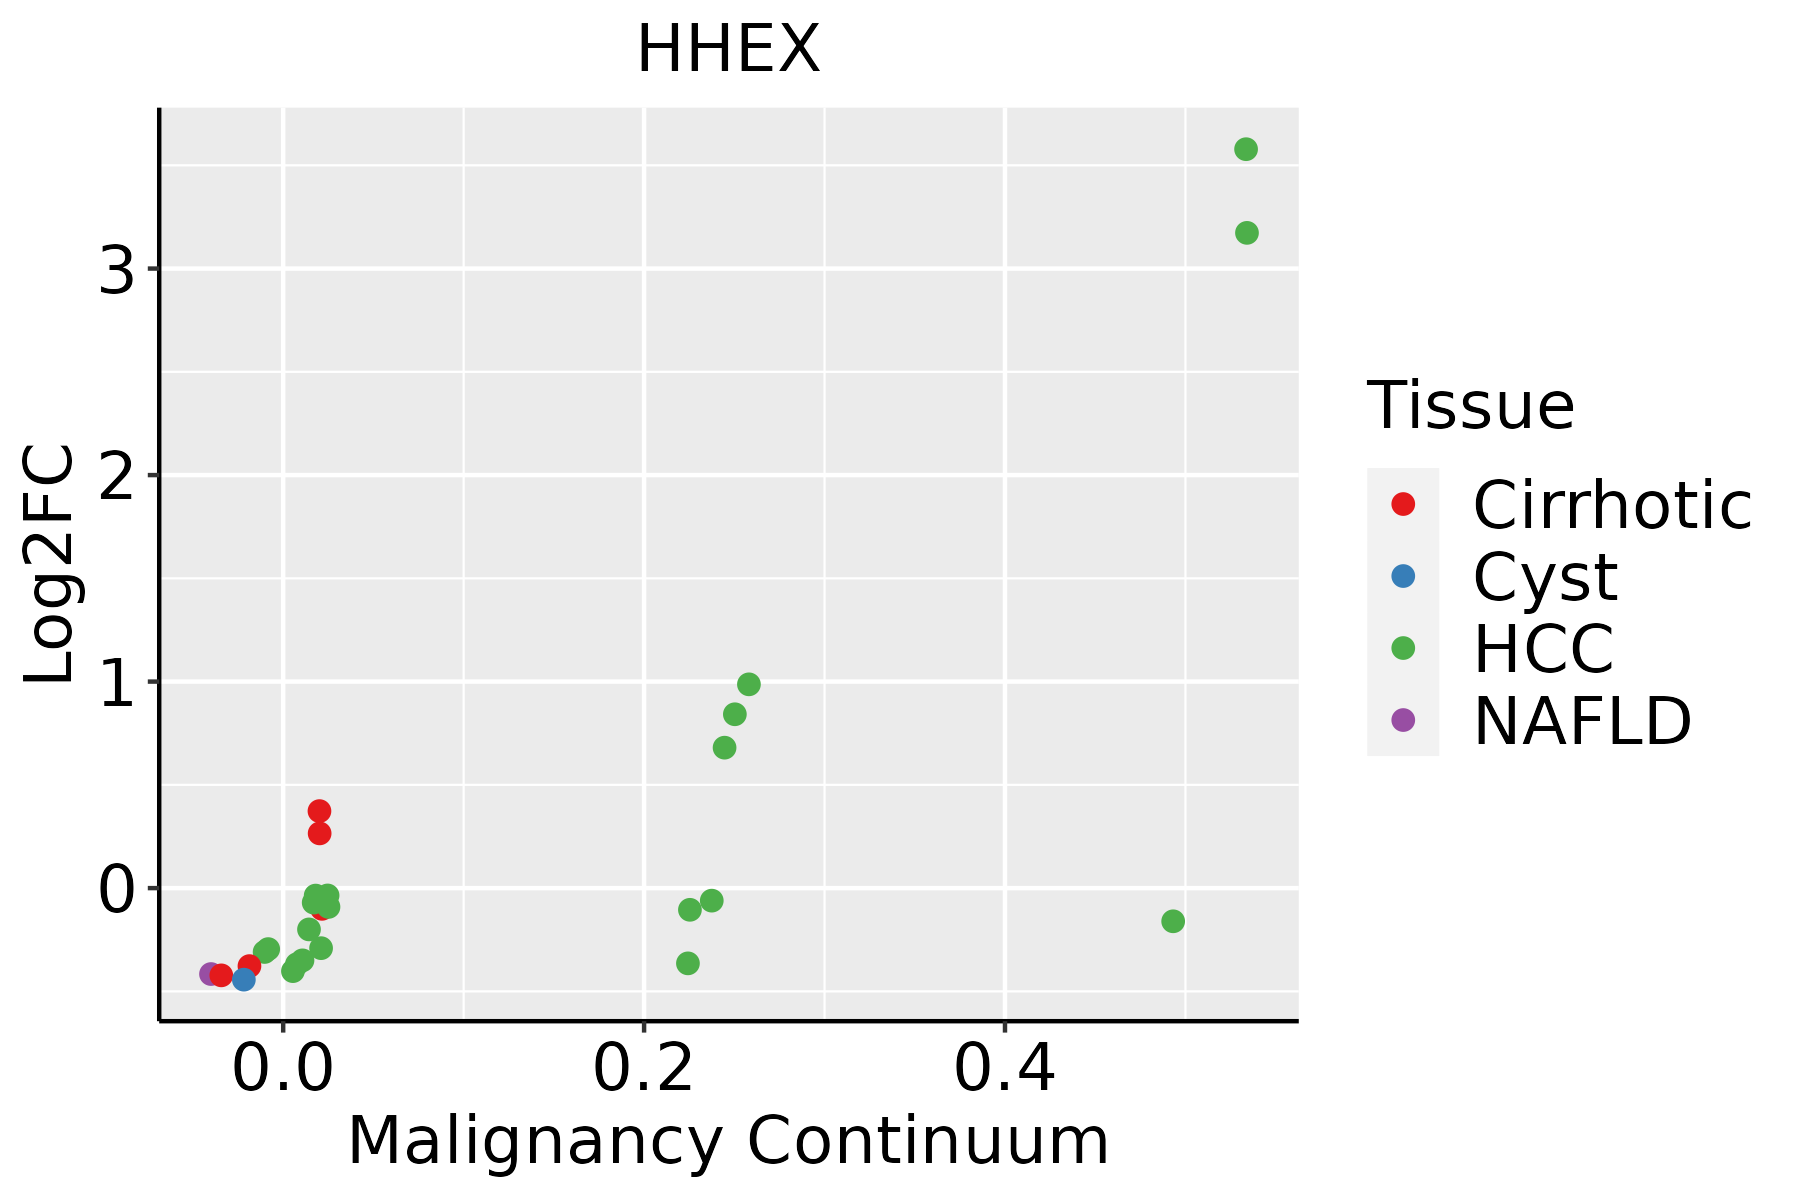 | HCC: Hepatocellular carcinoma |
| NAFLD: Non-alcoholic fatty liver disease | ||
| Thyroid | 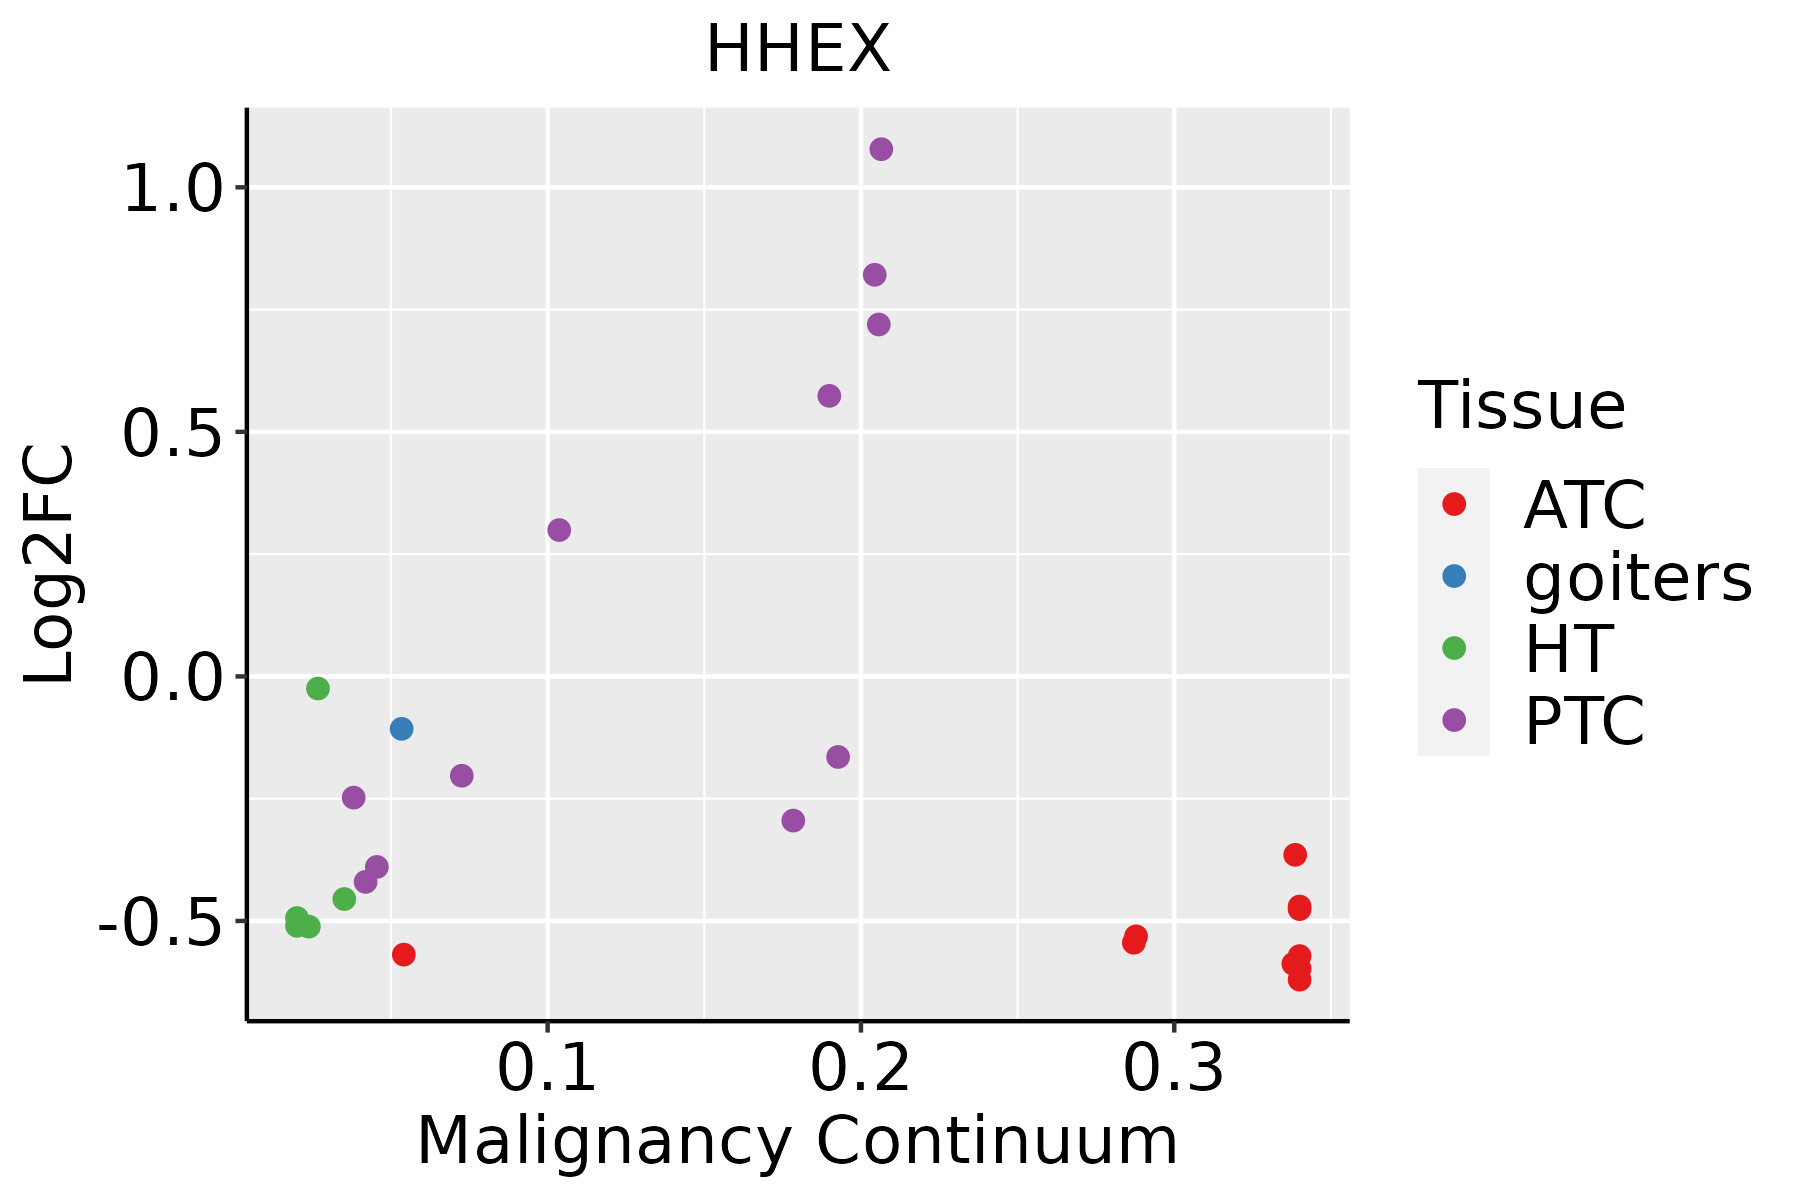 | ATC: Anaplastic thyroid cancer |
| HT: Hashimoto's thyroiditis | ||
| PTC: Papillary thyroid cancer |
| ∗log2FC in expression of this searched gene in stem-like cells from each diseased tissue sample relative to stem-like cells in normal samples in each tissue plotted against the malignancy continuum. Samples are colored based on if they are from different disease stage. |
Top |
Malignant transformation related pathway analysis |
| Find out the enriched GO biological processes and KEGG pathways involved in transition from healthy to precancer to cancer |
| Tissue | Disease Stage | Enriched GO biological Processes |
| Colorectum | AD |  |
| Colorectum | SER |  |
| Colorectum | MSS |  |
| Colorectum | MSI-H |  |
| Colorectum | FAP |  |
| ∗Top 15 enriched GO BP terms are showed in the bar plot of each disease state in each tissue. Each row represents a significant GO biological process which is colored according to the -log10(p.adjust). |
| Page: 1 2 3 4 5 6 7 8 9 |
| GO ID | Tissue | Disease Stage | Description | Gene Ratio | Bg Ratio | pvalue | p.adjust | Count |
| GO:0030177110 | Thyroid | ATC | positive regulation of Wnt signaling pathway | 80/6293 | 140/18723 | 8.75e-09 | 1.86e-07 | 80 |
| GO:003367325 | Thyroid | ATC | negative regulation of kinase activity | 122/6293 | 237/18723 | 9.19e-09 | 1.94e-07 | 122 |
| GO:004578614 | Thyroid | ATC | negative regulation of cell cycle | 181/6293 | 385/18723 | 2.64e-08 | 5.07e-07 | 181 |
| GO:004343428 | Thyroid | ATC | response to peptide hormone | 192/6293 | 414/18723 | 3.63e-08 | 6.70e-07 | 192 |
| GO:0090263110 | Thyroid | ATC | positive regulation of canonical Wnt signaling pathway | 62/6293 | 106/18723 | 1.26e-07 | 2.09e-06 | 62 |
| GO:007116614 | Thyroid | ATC | ribonucleoprotein complex localization | 47/6293 | 77/18723 | 7.43e-07 | 9.89e-06 | 47 |
| GO:000640514 | Thyroid | ATC | RNA export from nucleus | 50/6293 | 84/18723 | 9.81e-07 | 1.29e-05 | 50 |
| GO:003150316 | Thyroid | ATC | protein-containing complex localization | 108/6293 | 220/18723 | 1.33e-06 | 1.69e-05 | 108 |
| GO:007142614 | Thyroid | ATC | ribonucleoprotein complex export from nucleus | 46/6293 | 76/18723 | 1.37e-06 | 1.71e-05 | 46 |
| GO:009028721 | Thyroid | ATC | regulation of cellular response to growth factor stimulus | 140/6293 | 304/18723 | 3.91e-06 | 4.33e-05 | 140 |
| GO:190402921 | Thyroid | ATC | regulation of cyclin-dependent protein kinase activity | 53/6293 | 98/18723 | 2.36e-05 | 2.06e-04 | 53 |
| GO:000007921 | Thyroid | ATC | regulation of cyclin-dependent protein serine/threonine kinase activity | 51/6293 | 94/18723 | 2.97e-05 | 2.48e-04 | 51 |
| GO:000640613 | Thyroid | ATC | mRNA export from nucleus | 34/6293 | 59/18723 | 1.29e-04 | 9.10e-04 | 34 |
| GO:007142713 | Thyroid | ATC | mRNA-containing ribonucleoprotein complex export from nucleus | 34/6293 | 59/18723 | 1.29e-04 | 9.10e-04 | 34 |
| GO:007190122 | Thyroid | ATC | negative regulation of protein serine/threonine kinase activity | 59/6293 | 120/18723 | 2.95e-04 | 1.87e-03 | 59 |
| GO:00457657 | Thyroid | ATC | regulation of angiogenesis | 141/6293 | 342/18723 | 1.80e-03 | 8.85e-03 | 141 |
| GO:19013427 | Thyroid | ATC | regulation of vasculature development | 143/6293 | 348/18723 | 1.95e-03 | 9.44e-03 | 143 |
| GO:19040304 | Thyroid | ATC | negative regulation of cyclin-dependent protein kinase activity | 18/6293 | 33/18723 | 1.06e-02 | 3.84e-02 | 18 |
| Page: 1 2 3 4 5 6 7 8 9 |
| Pathway ID | Tissue | Disease Stage | Description | Gene Ratio | Bg Ratio | pvalue | p.adjust | qvalue | Count |
| Page: 1 |
Top |
Cell-cell communication analysis |
| Identification of potential cell-cell interactions between two cell types and their ligand-receptor pairs for different disease states |
| Ligand | Receptor | LRpair | Pathway | Tissue | Disease Stage |
| Page: 1 |
Top |
Single-cell gene regulatory network inference analysis |
| Find out the significant the regulons (TFs) and the target genes of each regulon across cell types for different disease states |
| TF | Cell Type | Tissue | Disease Stage | Target Gene | RSS | Regulon Activity |
| ∗The dot plots of a searched regulon are shown for all cell subpopulations in each disease state of each tissue based on the regulon specific score inferred using pySCENIC and by calculating the average expression. |
| Page: 1 |
Top |
Somatic mutation of malignant transformation related genes |
| Annotation of somatic variants for genes involved in malignant transformation |
| Hugo Symbol | Variant Class | Variant Classification | dbSNP RS | HGVSc | HGVSp | HGVSp Short | SWISSPROT | BIOTYPE | SIFT | PolyPhen | Tumor Sample Barcode | Tissue | Histology | Sex | Age | Stage | Therapy Types | Drugs | Outcome |
| HHEX | SNV | Missense_Mutation | c.563G>T | p.Arg188Leu | p.R188L | Q03014 | protein_coding | deleterious(0) | probably_damaging(0.996) | TCGA-C8-A131-01 | Breast | breast invasive carcinoma | Female | >=65 | III/IV | Chemotherapy | 5-fluorouracil | CR | |
| HHEX | SNV | Missense_Mutation | c.245A>G | p.His82Arg | p.H82R | Q03014 | protein_coding | tolerated(0.28) | benign(0.189) | TCGA-AD-6964-01 | Colorectum | colon adenocarcinoma | Male | <65 | III/IV | Chemotherapy | folfox | PD | |
| HHEX | SNV | Missense_Mutation | novel | c.751N>C | p.Ser251Pro | p.S251P | Q03014 | protein_coding | deleterious(0) | probably_damaging(0.96) | TCGA-CA-6717-01 | Colorectum | colon adenocarcinoma | Male | <65 | I/II | Chemotherapy | oxaliplatin | CR |
| HHEX | SNV | Missense_Mutation | c.196N>T | p.Arg66Trp | p.R66W | Q03014 | protein_coding | deleterious(0) | probably_damaging(0.981) | TCGA-CK-4951-01 | Colorectum | colon adenocarcinoma | Female | >=65 | I/II | Unknown | Unknown | PD | |
| HHEX | SNV | Missense_Mutation | c.794N>T | p.Ser265Ile | p.S265I | Q03014 | protein_coding | deleterious_low_confidence(0.01) | benign(0.058) | TCGA-AG-3892-01 | Colorectum | rectum adenocarcinoma | Female | <65 | I/II | Unknown | Unknown | SD | |
| HHEX | SNV | Missense_Mutation | novel | c.792N>C | p.Lys264Asn | p.K264N | Q03014 | protein_coding | deleterious_low_confidence(0.01) | possibly_damaging(0.725) | TCGA-AG-A002-01 | Colorectum | rectum adenocarcinoma | Male | <65 | I/II | Unknown | Unknown | SD |
| HHEX | SNV | Missense_Mutation | novel | c.484C>A | p.Leu162Ile | p.L162I | Q03014 | protein_coding | deleterious(0) | probably_damaging(0.99) | TCGA-F5-6814-01 | Colorectum | rectum adenocarcinoma | Male | <65 | I/II | Unknown | Unknown | SD |
| HHEX | SNV | Missense_Mutation | novel | c.625N>A | p.Glu209Lys | p.E209K | Q03014 | protein_coding | tolerated(0.1) | benign(0.003) | TCGA-A5-A2K5-01 | Endometrium | uterine corpus endometrioid carcinoma | Female | >=65 | I/II | Unknown | Unknown | SD |
| HHEX | SNV | Missense_Mutation | novel | c.605G>T | p.Ser202Ile | p.S202I | Q03014 | protein_coding | deleterious(0.03) | benign(0.291) | TCGA-AX-A06F-01 | Endometrium | uterine corpus endometrioid carcinoma | Female | <65 | III/IV | Chemotherapy | carboplatin | SD |
| HHEX | SNV | Missense_Mutation | rs200052261 | c.747N>T | p.Glu249Asp | p.E249D | Q03014 | protein_coding | tolerated(0.93) | benign(0.003) | TCGA-B5-A11E-01 | Endometrium | uterine corpus endometrioid carcinoma | Female | <65 | I/II | Unknown | Unknown | SD |
| Page: 1 2 |
Top |
Related drugs of malignant transformation related genes |
| Identification of chemicals and drugs interact with genes involved in malignant transfromation |
| (DGIdb 4.0) |
| Entrez ID | Symbol | Category | Interaction Types | Drug Claim Name | Drug Name | PMIDs |
| Page: 1 |

Copyright 2023-Present -The University of Texas Health Science Center at Houston |