
|
|||||
|
 | |
| |
| |
| |
| |
| |
|
Gene: GOT1 |
Gene summary for GOT1 |
| Gene information | Species | Human | Gene symbol | GOT1 | Gene ID | 2805 |
| Gene name | glutamic-oxaloacetic transaminase 1 | |
| Gene Alias | AST1 | |
| Cytomap | 10q24.2 | |
| Gene Type | protein-coding | GO ID | GO:0003254 | UniProtAcc | A0A140VK69 |
Top |
Malignant transformation analysis |
| Identification of the aberrant gene expression in precancerous and cancerous lesions by comparing the gene expression of stem-like cells in diseased tissues with normal stem cells |
| Entrez ID | Symbol | Replicates | Species | Organ | Tissue | Adj P-value | Log2FC | Malignancy |
| 2805 | GOT1 | HTA11_347_2000001011 | Human | Colorectum | AD | 2.21e-04 | 3.78e-01 | -0.1954 |
| 2805 | GOT1 | A002-C-010 | Human | Colorectum | FAP | 2.16e-02 | -1.51e-01 | 0.242 |
| 2805 | GOT1 | A001-C-207 | Human | Colorectum | FAP | 9.81e-04 | -2.77e-01 | 0.1278 |
| 2805 | GOT1 | A015-C-203 | Human | Colorectum | FAP | 6.79e-12 | -2.63e-01 | -0.1294 |
| 2805 | GOT1 | A015-C-204 | Human | Colorectum | FAP | 5.57e-08 | -3.35e-01 | -0.0228 |
| 2805 | GOT1 | A002-C-201 | Human | Colorectum | FAP | 3.26e-08 | -3.04e-01 | 0.0324 |
| 2805 | GOT1 | A002-C-203 | Human | Colorectum | FAP | 1.63e-09 | -3.02e-01 | 0.2786 |
| 2805 | GOT1 | A001-C-119 | Human | Colorectum | FAP | 1.79e-07 | -3.60e-01 | -0.1557 |
| 2805 | GOT1 | A001-C-108 | Human | Colorectum | FAP | 7.33e-08 | -2.90e-01 | -0.0272 |
| 2805 | GOT1 | A002-C-205 | Human | Colorectum | FAP | 2.31e-14 | -3.80e-01 | -0.1236 |
| 2805 | GOT1 | A001-C-104 | Human | Colorectum | FAP | 2.21e-02 | -2.97e-01 | 0.0184 |
| 2805 | GOT1 | A015-C-005 | Human | Colorectum | FAP | 3.36e-02 | -1.87e-01 | -0.0336 |
| 2805 | GOT1 | A015-C-006 | Human | Colorectum | FAP | 2.23e-07 | -3.03e-01 | -0.0994 |
| 2805 | GOT1 | A015-C-106 | Human | Colorectum | FAP | 7.52e-07 | -2.79e-01 | -0.0511 |
| 2805 | GOT1 | A002-C-114 | Human | Colorectum | FAP | 5.86e-10 | -3.21e-01 | -0.1561 |
| 2805 | GOT1 | A015-C-104 | Human | Colorectum | FAP | 4.58e-13 | -3.08e-01 | -0.1899 |
| 2805 | GOT1 | A001-C-014 | Human | Colorectum | FAP | 2.37e-08 | -3.33e-01 | 0.0135 |
| 2805 | GOT1 | A002-C-016 | Human | Colorectum | FAP | 2.56e-08 | -2.99e-01 | 0.0521 |
| 2805 | GOT1 | A015-C-002 | Human | Colorectum | FAP | 2.99e-05 | -2.80e-01 | -0.0763 |
| 2805 | GOT1 | A001-C-203 | Human | Colorectum | FAP | 3.66e-07 | -2.94e-01 | -0.0481 |
| Page: 1 2 3 4 5 6 7 |
| Tissue | Expression Dynamics | Abbreviation |
| Colorectum (GSE201348) |  | FAP: Familial adenomatous polyposis |
| CRC: Colorectal cancer | ||
| Colorectum (HTA11) |  | AD: Adenomas |
| SER: Sessile serrated lesions | ||
| MSI-H: Microsatellite-high colorectal cancer | ||
| MSS: Microsatellite stable colorectal cancer | ||
| Esophagus | 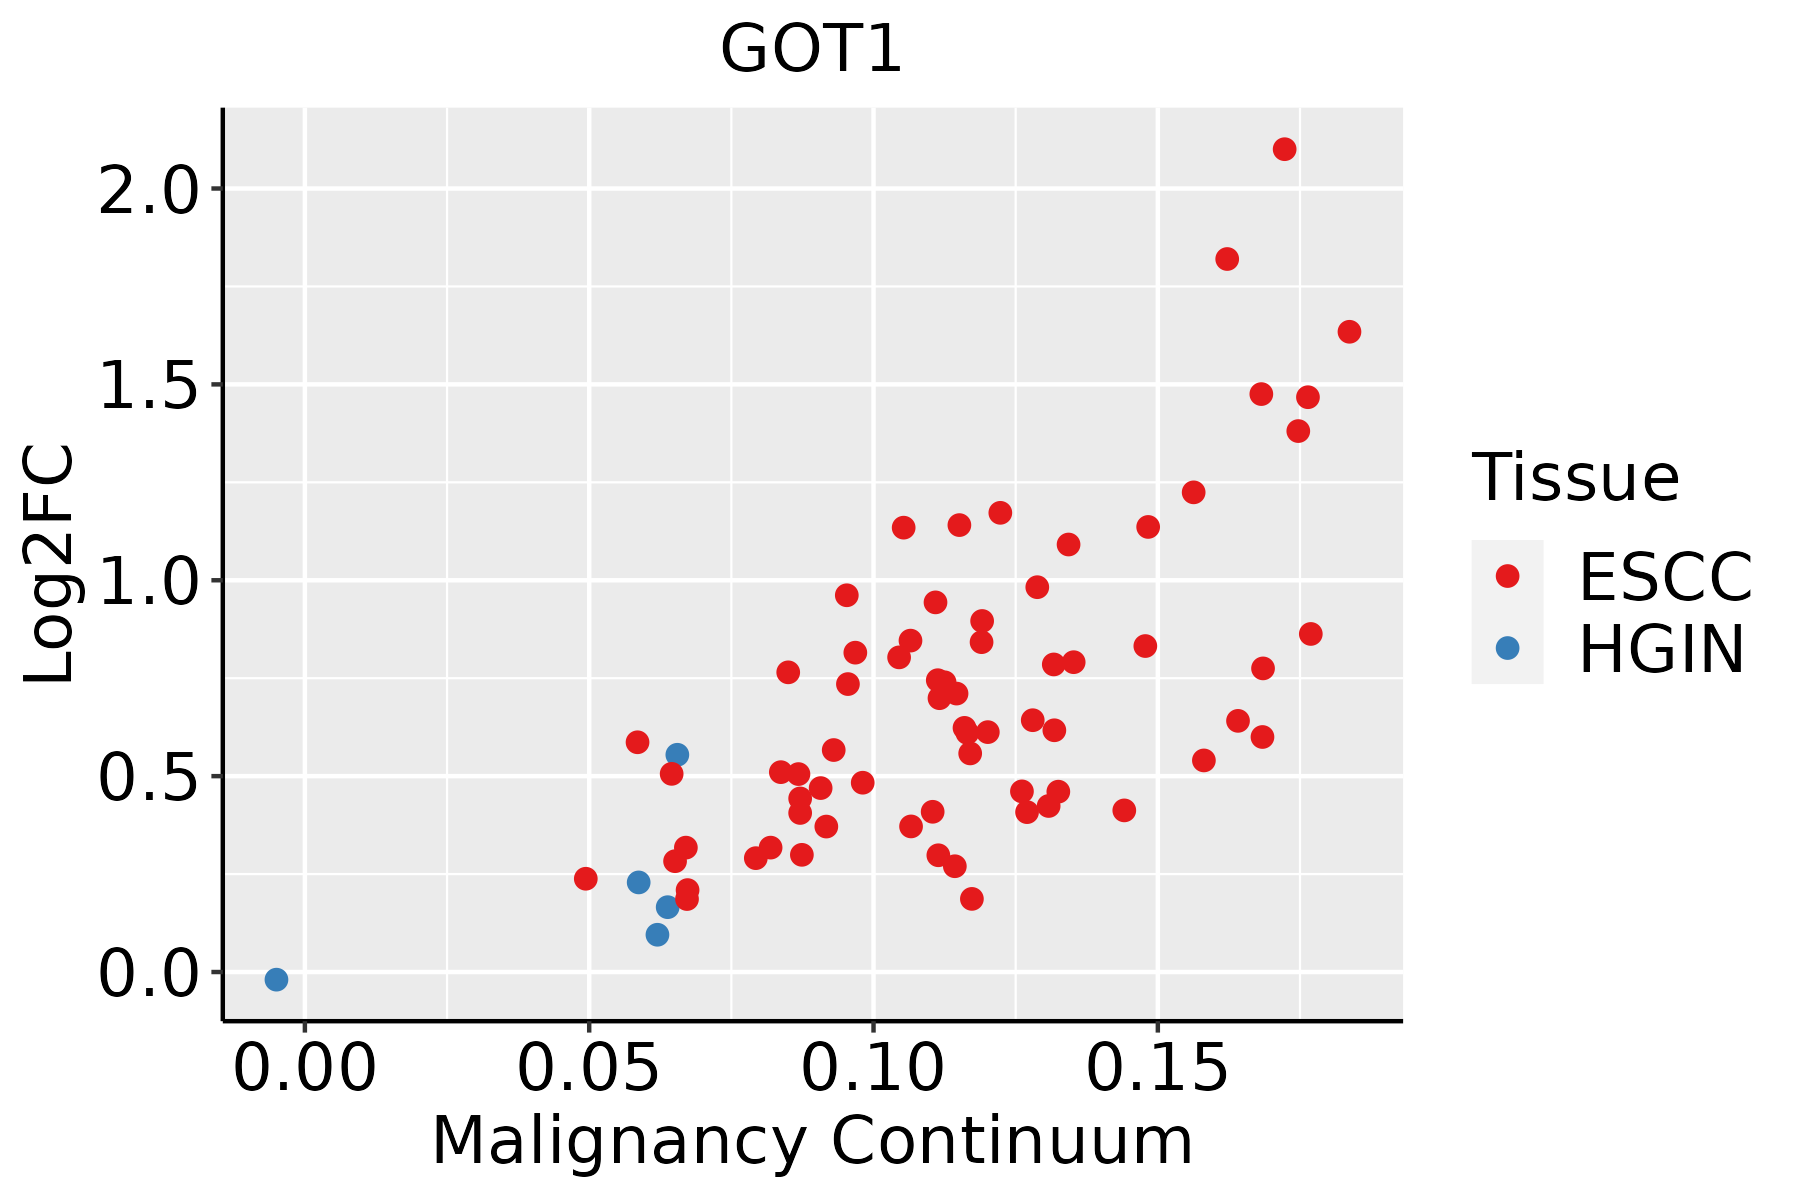 | ESCC: Esophageal squamous cell carcinoma |
| HGIN: High-grade intraepithelial neoplasias | ||
| LGIN: Low-grade intraepithelial neoplasias | ||
| Liver |  | HCC: Hepatocellular carcinoma |
| NAFLD: Non-alcoholic fatty liver disease | ||
| Oral Cavity | 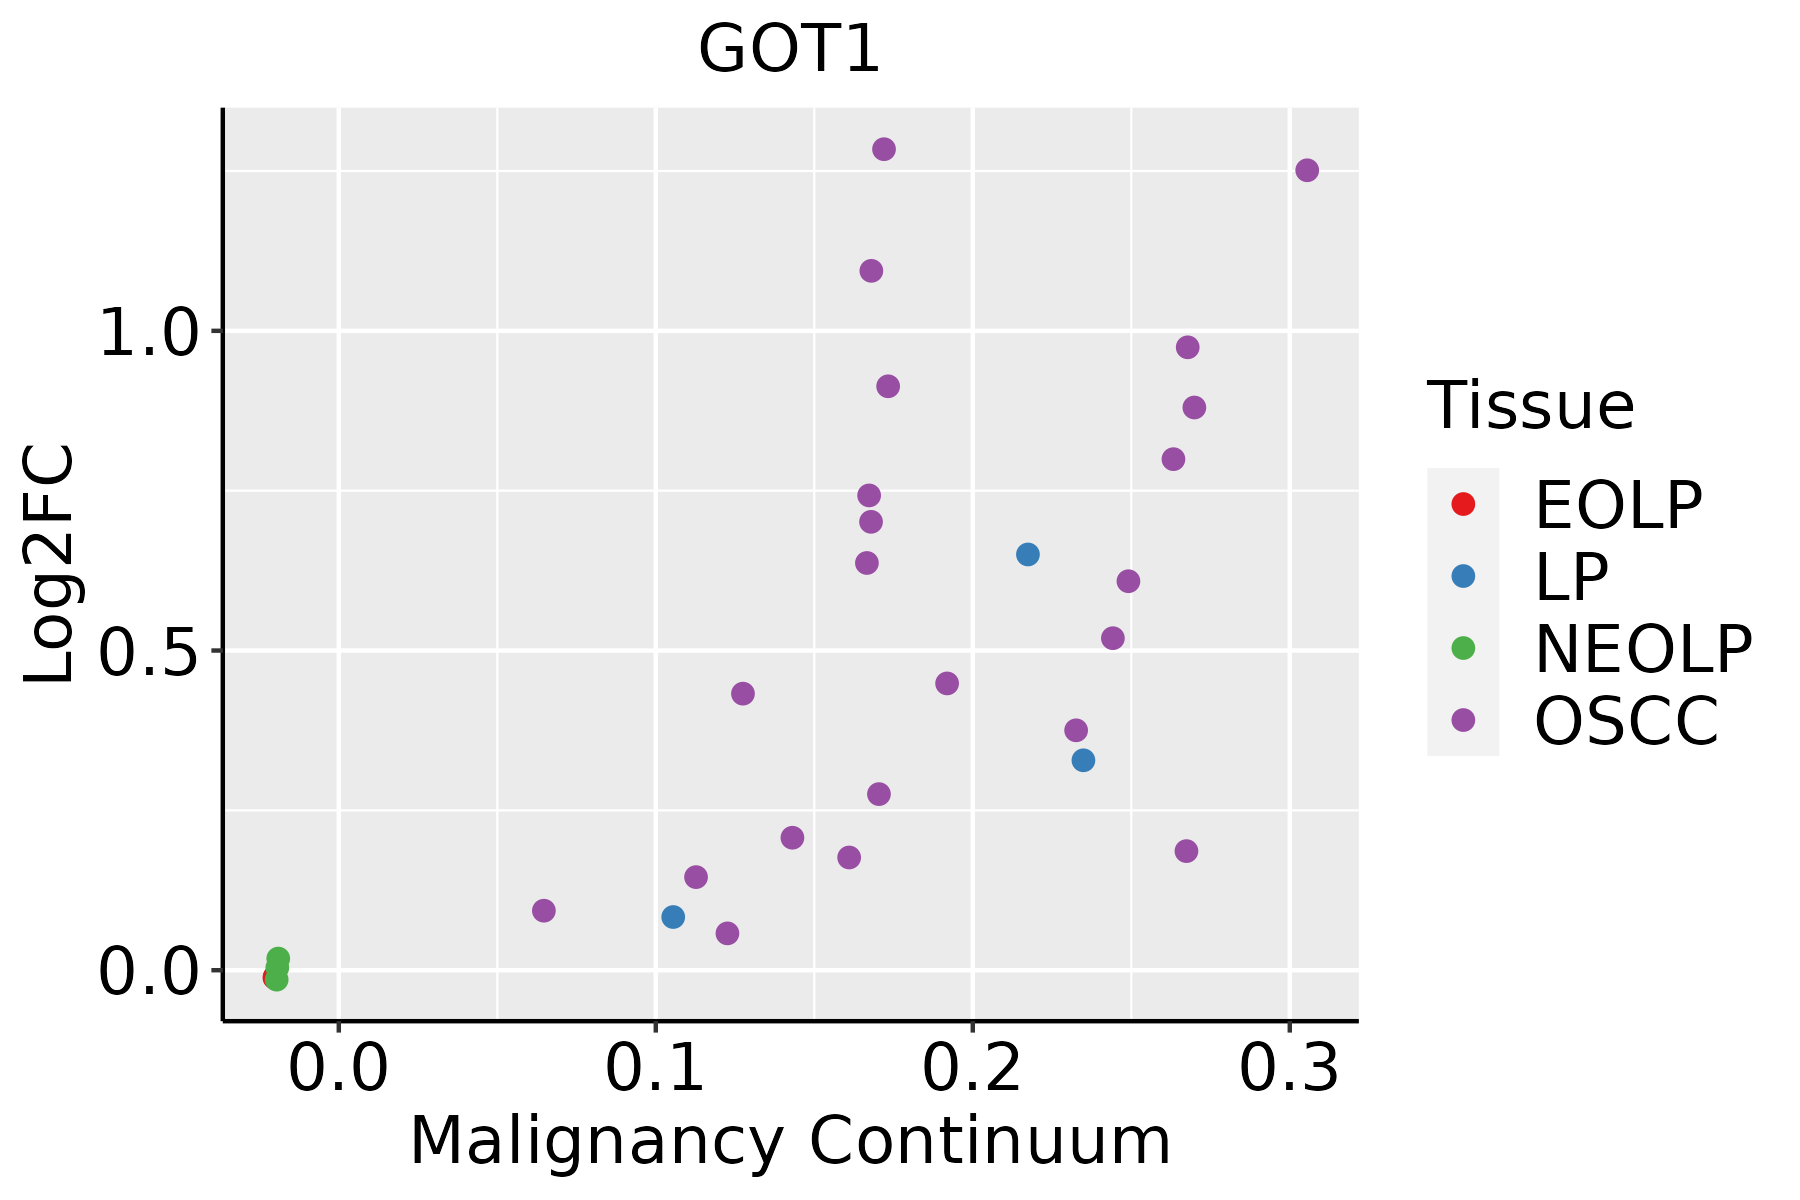 | EOLP: Erosive Oral lichen planus |
| LP: leukoplakia | ||
| NEOLP: Non-erosive oral lichen planus | ||
| OSCC: Oral squamous cell carcinoma | ||
| Skin | 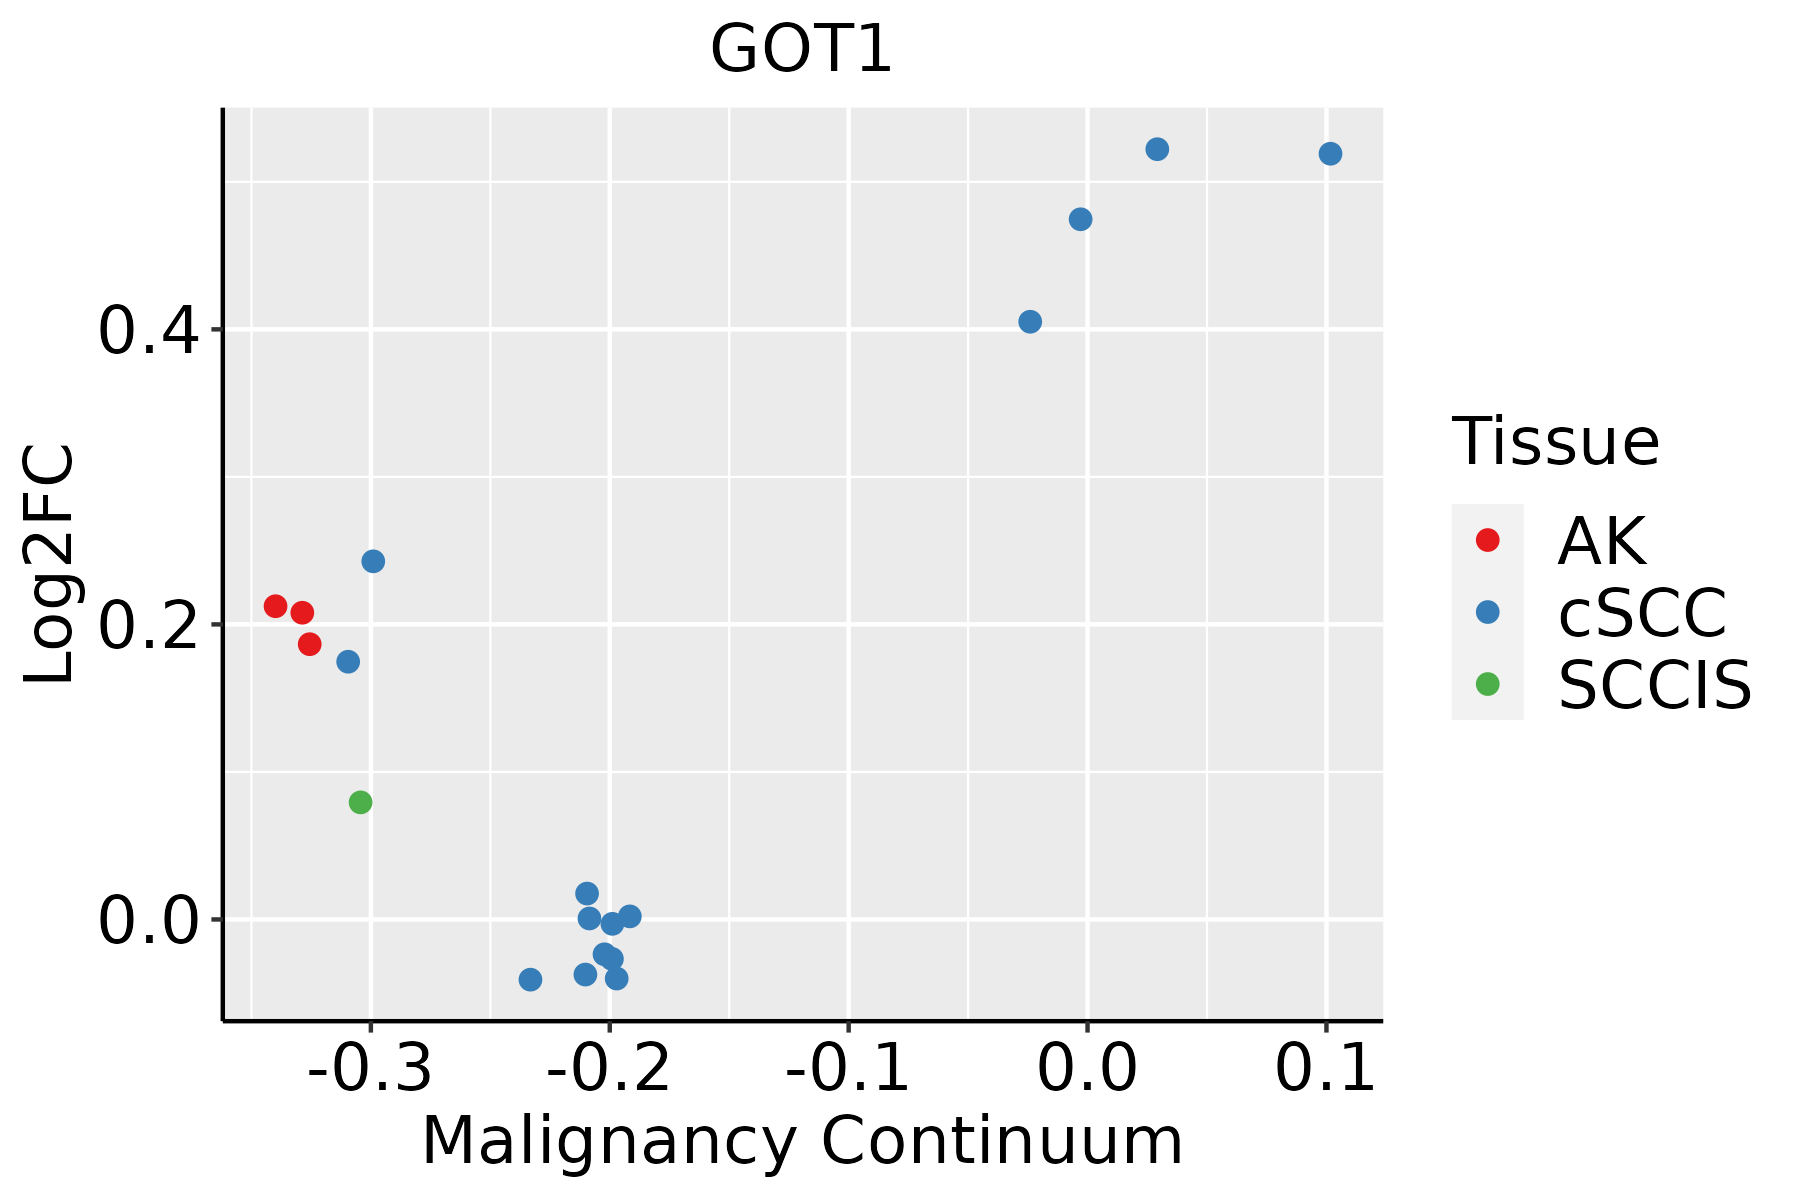 | AK: Actinic keratosis |
| cSCC: Cutaneous squamous cell carcinoma | ||
| SCCIS:squamous cell carcinoma in situ |
| ∗log2FC in expression of this searched gene in stem-like cells from each diseased tissue sample relative to stem-like cells in normal samples in each tissue plotted against the malignancy continuum. Samples are colored based on if they are from different disease stage. |
Top |
Malignant transformation related pathway analysis |
| Find out the enriched GO biological processes and KEGG pathways involved in transition from healthy to precancer to cancer |
| Tissue | Disease Stage | Enriched GO biological Processes |
| Colorectum | AD |  |
| Colorectum | SER |  |
| Colorectum | MSS |  |
| Colorectum | MSI-H |  |
| Colorectum | FAP |  |
| ∗Top 15 enriched GO BP terms are showed in the bar plot of each disease state in each tissue. Each row represents a significant GO biological process which is colored according to the -log10(p.adjust). |
| Page: 1 2 3 4 5 6 7 8 9 |
| GO ID | Tissue | Disease Stage | Description | Gene Ratio | Bg Ratio | pvalue | p.adjust | Count |
| GO:001605312 | Liver | Cirrhotic | organic acid biosynthetic process | 139/4634 | 316/18723 | 4.28e-14 | 3.83e-12 | 139 |
| GO:004854512 | Liver | Cirrhotic | response to steroid hormone | 146/4634 | 339/18723 | 7.87e-14 | 6.76e-12 | 146 |
| GO:004639412 | Liver | Cirrhotic | carboxylic acid biosynthetic process | 137/4634 | 314/18723 | 1.40e-13 | 1.14e-11 | 137 |
| GO:004428211 | Liver | Cirrhotic | small molecule catabolic process | 151/4634 | 376/18723 | 2.20e-11 | 1.34e-09 | 151 |
| GO:001003812 | Liver | Cirrhotic | response to metal ion | 150/4634 | 373/18723 | 2.27e-11 | 1.37e-09 | 150 |
| GO:000606612 | Liver | Cirrhotic | alcohol metabolic process | 141/4634 | 353/18723 | 1.57e-10 | 8.03e-09 | 141 |
| GO:001605411 | Liver | Cirrhotic | organic acid catabolic process | 104/4634 | 240/18723 | 1.91e-10 | 9.53e-09 | 104 |
| GO:004639511 | Liver | Cirrhotic | carboxylic acid catabolic process | 102/4634 | 236/18723 | 3.41e-10 | 1.63e-08 | 102 |
| GO:005508811 | Liver | Cirrhotic | lipid homeostasis | 74/4634 | 167/18723 | 2.46e-08 | 8.51e-07 | 74 |
| GO:007149612 | Liver | Cirrhotic | cellular response to external stimulus | 123/4634 | 320/18723 | 3.27e-08 | 1.10e-06 | 123 |
| GO:000974312 | Liver | Cirrhotic | response to carbohydrate | 101/4634 | 253/18723 | 6.24e-08 | 1.92e-06 | 101 |
| GO:19016051 | Liver | Cirrhotic | alpha-amino acid metabolic process | 82/4634 | 195/18723 | 7.72e-08 | 2.30e-06 | 82 |
| GO:004343412 | Liver | Cirrhotic | response to peptide hormone | 149/4634 | 414/18723 | 1.70e-07 | 4.49e-06 | 149 |
| GO:005138411 | Liver | Cirrhotic | response to glucocorticoid | 65/4634 | 148/18723 | 2.53e-07 | 6.41e-06 | 65 |
| GO:007137511 | Liver | Cirrhotic | cellular response to peptide hormone stimulus | 110/4634 | 290/18723 | 3.73e-07 | 8.82e-06 | 110 |
| GO:003196011 | Liver | Cirrhotic | response to corticosteroid | 70/4634 | 167/18723 | 7.73e-07 | 1.62e-05 | 70 |
| GO:190165311 | Liver | Cirrhotic | cellular response to peptide | 129/4634 | 359/18723 | 1.23e-06 | 2.49e-05 | 129 |
| GO:003286911 | Liver | Cirrhotic | cellular response to insulin stimulus | 80/4634 | 203/18723 | 2.55e-06 | 4.63e-05 | 80 |
| GO:007155911 | Liver | Cirrhotic | response to transforming growth factor beta | 96/4634 | 256/18723 | 3.55e-06 | 6.09e-05 | 96 |
| GO:00090631 | Liver | Cirrhotic | cellular amino acid catabolic process | 49/4634 | 110/18723 | 4.47e-06 | 7.42e-05 | 49 |
| Page: 1 2 3 4 5 6 7 8 9 10 11 12 13 14 15 16 17 |
| Pathway ID | Tissue | Disease Stage | Description | Gene Ratio | Bg Ratio | pvalue | p.adjust | qvalue | Count |
| hsa01200 | Colorectum | AD | Carbon metabolism | 55/2092 | 115/8465 | 5.53e-08 | 8.42e-07 | 5.37e-07 | 55 |
| hsa00330 | Colorectum | AD | Arginine and proline metabolism | 23/2092 | 50/8465 | 8.27e-04 | 5.90e-03 | 3.76e-03 | 23 |
| hsa01230 | Colorectum | AD | Biosynthesis of amino acids | 28/2092 | 75/8465 | 9.99e-03 | 3.89e-02 | 2.48e-02 | 28 |
| hsa012001 | Colorectum | AD | Carbon metabolism | 55/2092 | 115/8465 | 5.53e-08 | 8.42e-07 | 5.37e-07 | 55 |
| hsa003301 | Colorectum | AD | Arginine and proline metabolism | 23/2092 | 50/8465 | 8.27e-04 | 5.90e-03 | 3.76e-03 | 23 |
| hsa012301 | Colorectum | AD | Biosynthesis of amino acids | 28/2092 | 75/8465 | 9.99e-03 | 3.89e-02 | 2.48e-02 | 28 |
| hsa012006 | Colorectum | FAP | Carbon metabolism | 38/1404 | 115/8465 | 1.04e-05 | 1.44e-04 | 8.76e-05 | 38 |
| hsa003306 | Colorectum | FAP | Arginine and proline metabolism | 16/1404 | 50/8465 | 5.33e-03 | 2.10e-02 | 1.27e-02 | 16 |
| hsa012007 | Colorectum | FAP | Carbon metabolism | 38/1404 | 115/8465 | 1.04e-05 | 1.44e-04 | 8.76e-05 | 38 |
| hsa003307 | Colorectum | FAP | Arginine and proline metabolism | 16/1404 | 50/8465 | 5.33e-03 | 2.10e-02 | 1.27e-02 | 16 |
| hsa012008 | Colorectum | CRC | Carbon metabolism | 28/1091 | 115/8465 | 5.43e-04 | 5.48e-03 | 3.72e-03 | 28 |
| hsa012009 | Colorectum | CRC | Carbon metabolism | 28/1091 | 115/8465 | 5.43e-04 | 5.48e-03 | 3.72e-03 | 28 |
| hsa0120016 | Esophagus | HGIN | Carbon metabolism | 31/1383 | 115/8465 | 2.51e-03 | 2.10e-02 | 1.67e-02 | 31 |
| hsa012306 | Esophagus | HGIN | Biosynthesis of amino acids | 21/1383 | 75/8465 | 7.38e-03 | 4.63e-02 | 3.68e-02 | 21 |
| hsa0120017 | Esophagus | HGIN | Carbon metabolism | 31/1383 | 115/8465 | 2.51e-03 | 2.10e-02 | 1.67e-02 | 31 |
| hsa0123013 | Esophagus | HGIN | Biosynthesis of amino acids | 21/1383 | 75/8465 | 7.38e-03 | 4.63e-02 | 3.68e-02 | 21 |
| hsa0120023 | Esophagus | ESCC | Carbon metabolism | 79/4205 | 115/8465 | 2.50e-05 | 1.21e-04 | 6.22e-05 | 79 |
| hsa0123023 | Esophagus | ESCC | Biosynthesis of amino acids | 49/4205 | 75/8465 | 4.35e-03 | 1.12e-02 | 5.74e-03 | 49 |
| hsa0120033 | Esophagus | ESCC | Carbon metabolism | 79/4205 | 115/8465 | 2.50e-05 | 1.21e-04 | 6.22e-05 | 79 |
| hsa0123033 | Esophagus | ESCC | Biosynthesis of amino acids | 49/4205 | 75/8465 | 4.35e-03 | 1.12e-02 | 5.74e-03 | 49 |
| Page: 1 2 3 |
Top |
Cell-cell communication analysis |
| Identification of potential cell-cell interactions between two cell types and their ligand-receptor pairs for different disease states |
| Ligand | Receptor | LRpair | Pathway | Tissue | Disease Stage |
| Page: 1 |
Top |
Single-cell gene regulatory network inference analysis |
| Find out the significant the regulons (TFs) and the target genes of each regulon across cell types for different disease states |
| TF | Cell Type | Tissue | Disease Stage | Target Gene | RSS | Regulon Activity |
| ∗The dot plots of a searched regulon are shown for all cell subpopulations in each disease state of each tissue based on the regulon specific score inferred using pySCENIC and by calculating the average expression. |
| Page: 1 |
Top |
Somatic mutation of malignant transformation related genes |
| Annotation of somatic variants for genes involved in malignant transformation |
| Hugo Symbol | Variant Class | Variant Classification | dbSNP RS | HGVSc | HGVSp | HGVSp Short | SWISSPROT | BIOTYPE | SIFT | PolyPhen | Tumor Sample Barcode | Tissue | Histology | Sex | Age | Stage | Therapy Types | Drugs | Outcome |
| GOT1 | SNV | Missense_Mutation | novel | c.955G>A | p.Glu319Lys | p.E319K | P17174 | protein_coding | deleterious(0.01) | benign(0.333) | TCGA-2W-A8YY-01 | Cervix | cervical & endocervical cancer | Female | <65 | I/II | Chemotherapy | cisplatin | CR |
| GOT1 | SNV | Missense_Mutation | novel | c.508G>A | p.Asp170Asn | p.D170N | P17174 | protein_coding | tolerated(0.17) | benign(0.089) | TCGA-2W-A8YY-01 | Cervix | cervical & endocervical cancer | Female | <65 | I/II | Chemotherapy | cisplatin | CR |
| GOT1 | SNV | Missense_Mutation | rs776949680 | c.1002N>A | p.Met334Ile | p.M334I | P17174 | protein_coding | deleterious(0) | possibly_damaging(0.688) | TCGA-VS-A94X-01 | Cervix | cervical & endocervical cancer | Female | <65 | I/II | Chemotherapy | cisplatin | PD |
| GOT1 | SNV | Missense_Mutation | c.1172N>A | p.Ser391Asn | p.S391N | P17174 | protein_coding | deleterious(0) | benign(0.3) | TCGA-A6-5659-01 | Colorectum | colon adenocarcinoma | Male | >=65 | I/II | Unknown | Unknown | SD | |
| GOT1 | SNV | Missense_Mutation | c.253N>G | p.Ser85Ala | p.S85A | P17174 | protein_coding | tolerated(1) | benign(0.003) | TCGA-AA-3811-01 | Colorectum | colon adenocarcinoma | Female | >=65 | III/IV | Unknown | Unknown | PD | |
| GOT1 | SNV | Missense_Mutation | c.535N>A | p.Glu179Lys | p.E179K | P17174 | protein_coding | tolerated(0.69) | benign(0.007) | TCGA-AA-A010-01 | Colorectum | colon adenocarcinoma | Female | <65 | I/II | Chemotherapy | folinic | CR | |
| GOT1 | SNV | Missense_Mutation | c.687N>A | p.Phe229Leu | p.F229L | P17174 | protein_coding | deleterious(0.03) | benign(0.321) | TCGA-CK-4951-01 | Colorectum | colon adenocarcinoma | Female | >=65 | I/II | Unknown | Unknown | PD | |
| GOT1 | SNV | Missense_Mutation | rs769200718 | c.914N>A | p.Arg305Gln | p.R305Q | P17174 | protein_coding | deleterious(0.01) | possibly_damaging(0.74) | TCGA-EI-6917-01 | Colorectum | rectum adenocarcinoma | Male | <65 | III/IV | Chemotherapy | 5fluorouracil+oxaciplatina+l-folinian | SD |
| GOT1 | SNV | Missense_Mutation | novel | c.125N>A | p.Arg42His | p.R42H | P17174 | protein_coding | deleterious(0) | probably_damaging(0.998) | TCGA-EI-6917-01 | Colorectum | rectum adenocarcinoma | Male | <65 | III/IV | Chemotherapy | 5fluorouracil+oxaciplatina+l-folinian | SD |
| GOT1 | SNV | Missense_Mutation | rs772704095 | c.688G>A | p.Ala230Thr | p.A230T | P17174 | protein_coding | deleterious(0) | possibly_damaging(0.649) | TCGA-F5-6814-01 | Colorectum | rectum adenocarcinoma | Male | <65 | I/II | Unknown | Unknown | SD |
| Page: 1 2 3 4 5 |
Top |
Related drugs of malignant transformation related genes |
| Identification of chemicals and drugs interact with genes involved in malignant transfromation |
| (DGIdb 4.0) |
| Entrez ID | Symbol | Category | Interaction Types | Drug Claim Name | Drug Name | PMIDs |
| Page: 1 |

Copyright 2023-Present -The University of Texas Health Science Center at Houston |