Schematic overview of the cellular and molecular mechanisms involved in the cancer progression, including the proposed cellular and molecular mechanisms in cancer cells trajectory. AT1: alveolar type 1 cells; AT2: alveolar type 2 cells; AAH: atypical adenomatous hyperplasia; AIS: adenocarcinoma in situ; MIA: minimally invasive adenocarcinoma; IA: invasive adenocarcinoma; EMT: epithelial-mesenchymal transition

Home

Download

Statistics

Help

Contact

Center for Computational Systems Medicine
leaf

Gene summary

leaf

Malignant transformation analysis

leaf

Malignant transformation related pathway analysis

leaf

Cell-cell communication analysis

leaf

Single-cell gene regulatory network inference analysis

leaf

Somatic mutation of malignant transformation related genes

leaf

Related drugs of malignant transformation related genes

Gene: GOPC

Gene summary for GOPC

check button Gene summary.

Gene informationSpeciesHuman
Gene symbol

GOPC

Gene ID

57120

Gene namegolgi associated PDZ and coiled-coil motif containing
Gene AliasCAL
Cytomap6q22.1
Gene Typeprotein-coding
GO ID

GO:0006810

UniProtAcc

Q9HD26


Top

Malignant transformation analysis

check button Identification of the aberrant gene expression in precancerous and cancerous lesions by comparing the gene expression of stem-like cells in diseased tissues with normal stem cells
check button Malignant transformation involving gene list.
Entrez IDSymbolReplicatesSpeciesOrganTissueAdj P-valueLog2FCMalignancy
57120GOPCLZE2THumanEsophagusESCC2.43e-035.90e-010.082
57120GOPCLZE4THumanEsophagusESCC4.23e-195.10e-010.0811
57120GOPCLZE7THumanEsophagusESCC1.39e-053.86e-010.0667
57120GOPCLZE8THumanEsophagusESCC1.38e-103.93e-010.067
57120GOPCLZE20THumanEsophagusESCC4.17e-072.66e-010.0662
57120GOPCLZE22THumanEsophagusESCC2.61e-045.25e-010.068
57120GOPCLZE24THumanEsophagusESCC9.96e-196.18e-010.0596
57120GOPCLZE21THumanEsophagusESCC1.18e-063.03e-010.0655
57120GOPCLZE6THumanEsophagusESCC5.38e-045.10e-010.0845
57120GOPCP1T-EHumanEsophagusESCC6.08e-107.33e-010.0875
57120GOPCP2T-EHumanEsophagusESCC4.17e-578.73e-010.1177
57120GOPCP4T-EHumanEsophagusESCC1.11e-431.03e+000.1323
57120GOPCP5T-EHumanEsophagusESCC1.78e-397.26e-010.1327
57120GOPCP8T-EHumanEsophagusESCC1.93e-367.99e-010.0889
57120GOPCP9T-EHumanEsophagusESCC2.89e-133.85e-010.1131
57120GOPCP10T-EHumanEsophagusESCC4.18e-488.53e-010.116
57120GOPCP11T-EHumanEsophagusESCC2.06e-197.60e-010.1426
57120GOPCP12T-EHumanEsophagusESCC2.38e-589.48e-010.1122
57120GOPCP15T-EHumanEsophagusESCC7.90e-368.69e-010.1149
57120GOPCP16T-EHumanEsophagusESCC2.67e-511.07e+000.1153
Page: 1 2 3 4 5 6 7 

check button Transcriptomic changes along malignancy continuum.
TissueExpression DynamicsAbbreviation
EsophagusThe image shows the transcriptomic changes along malignancy continuum.log2FC in expression of this searched gene in stem-like cells from each diseased tissue sample relative to stem-like cells in normal samples in each tissue plotted against the malignancy continuum. Samples are colored based on if they are from different disease stage.
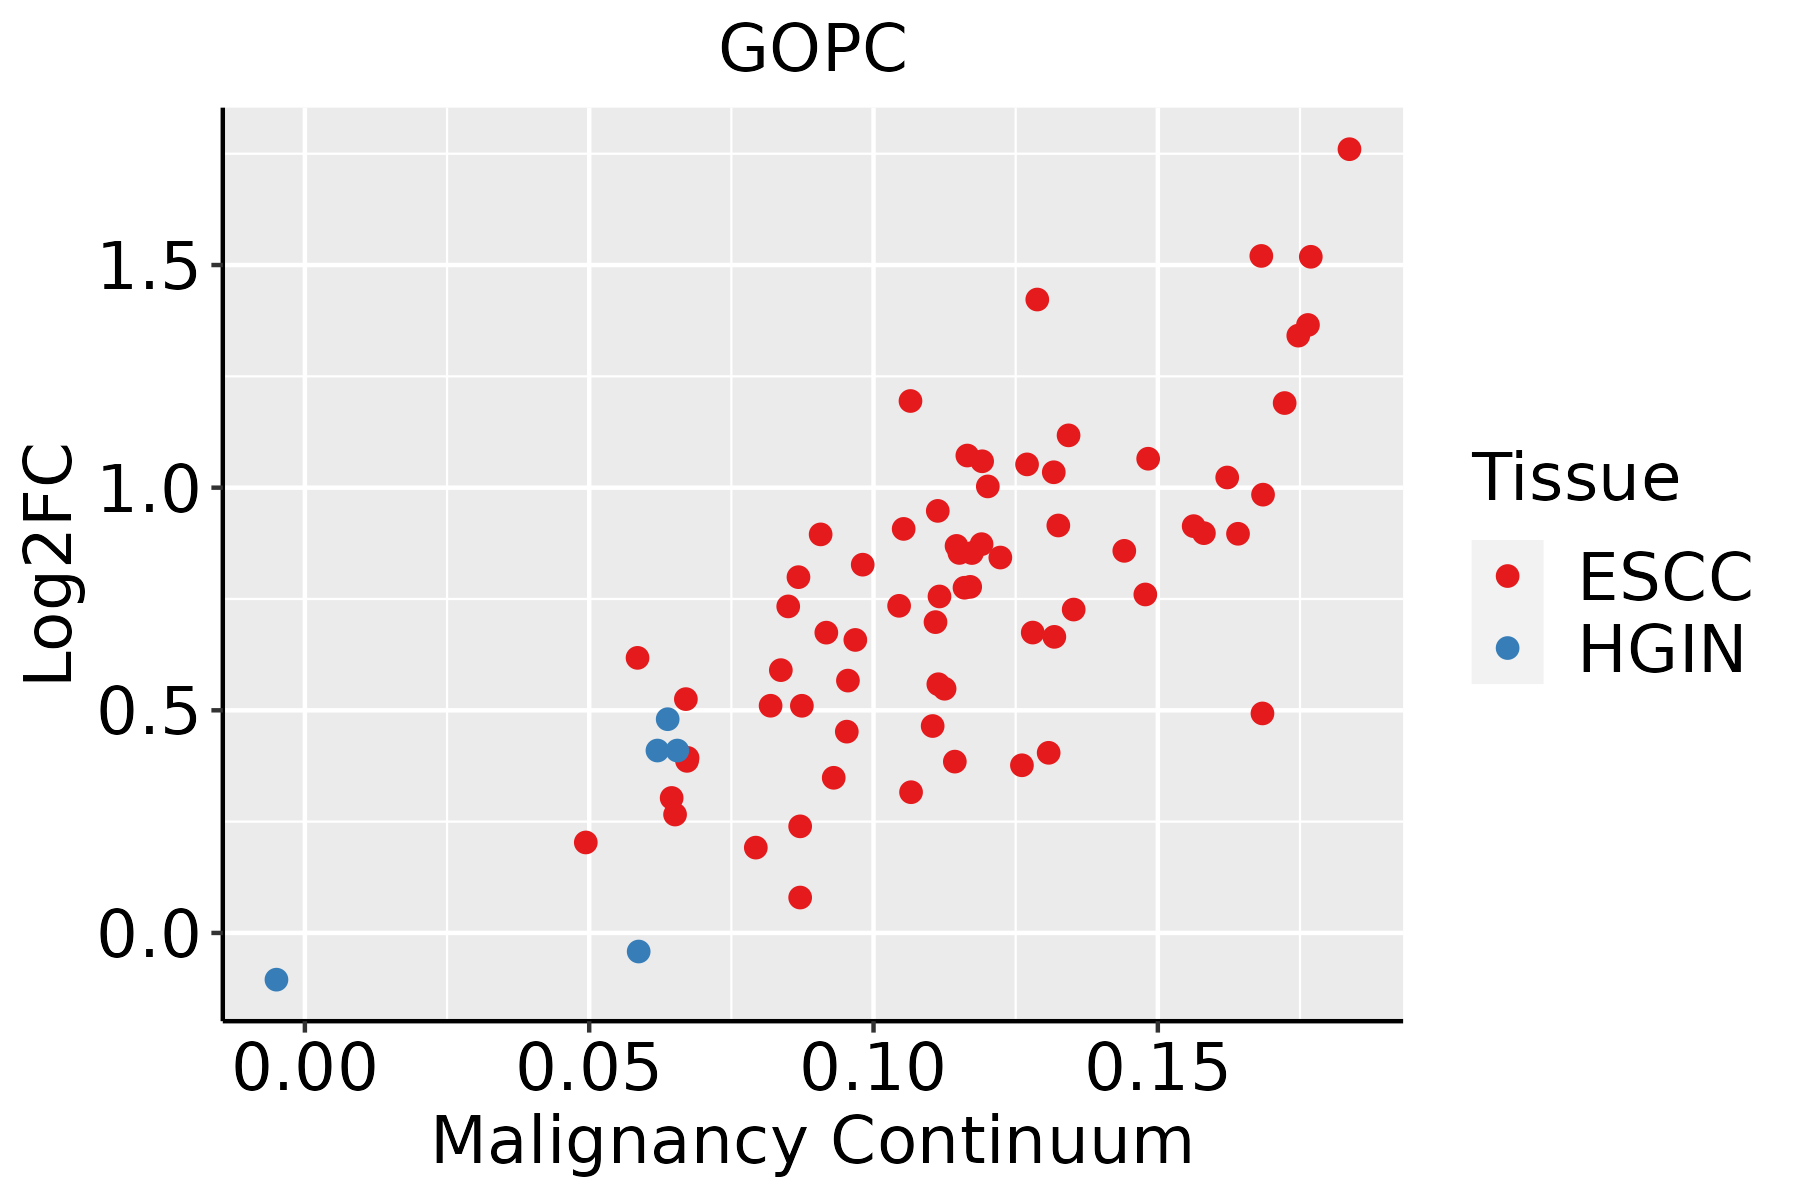
ESCC: Esophageal squamous cell carcinoma
HGIN: High-grade intraepithelial neoplasias
LGIN: Low-grade intraepithelial neoplasias
LiverThe image shows the transcriptomic changes along malignancy continuum.log2FC in expression of this searched gene in stem-like cells from each diseased tissue sample relative to stem-like cells in normal samples in each tissue plotted against the malignancy continuum. Samples are colored based on if they are from different disease stage.
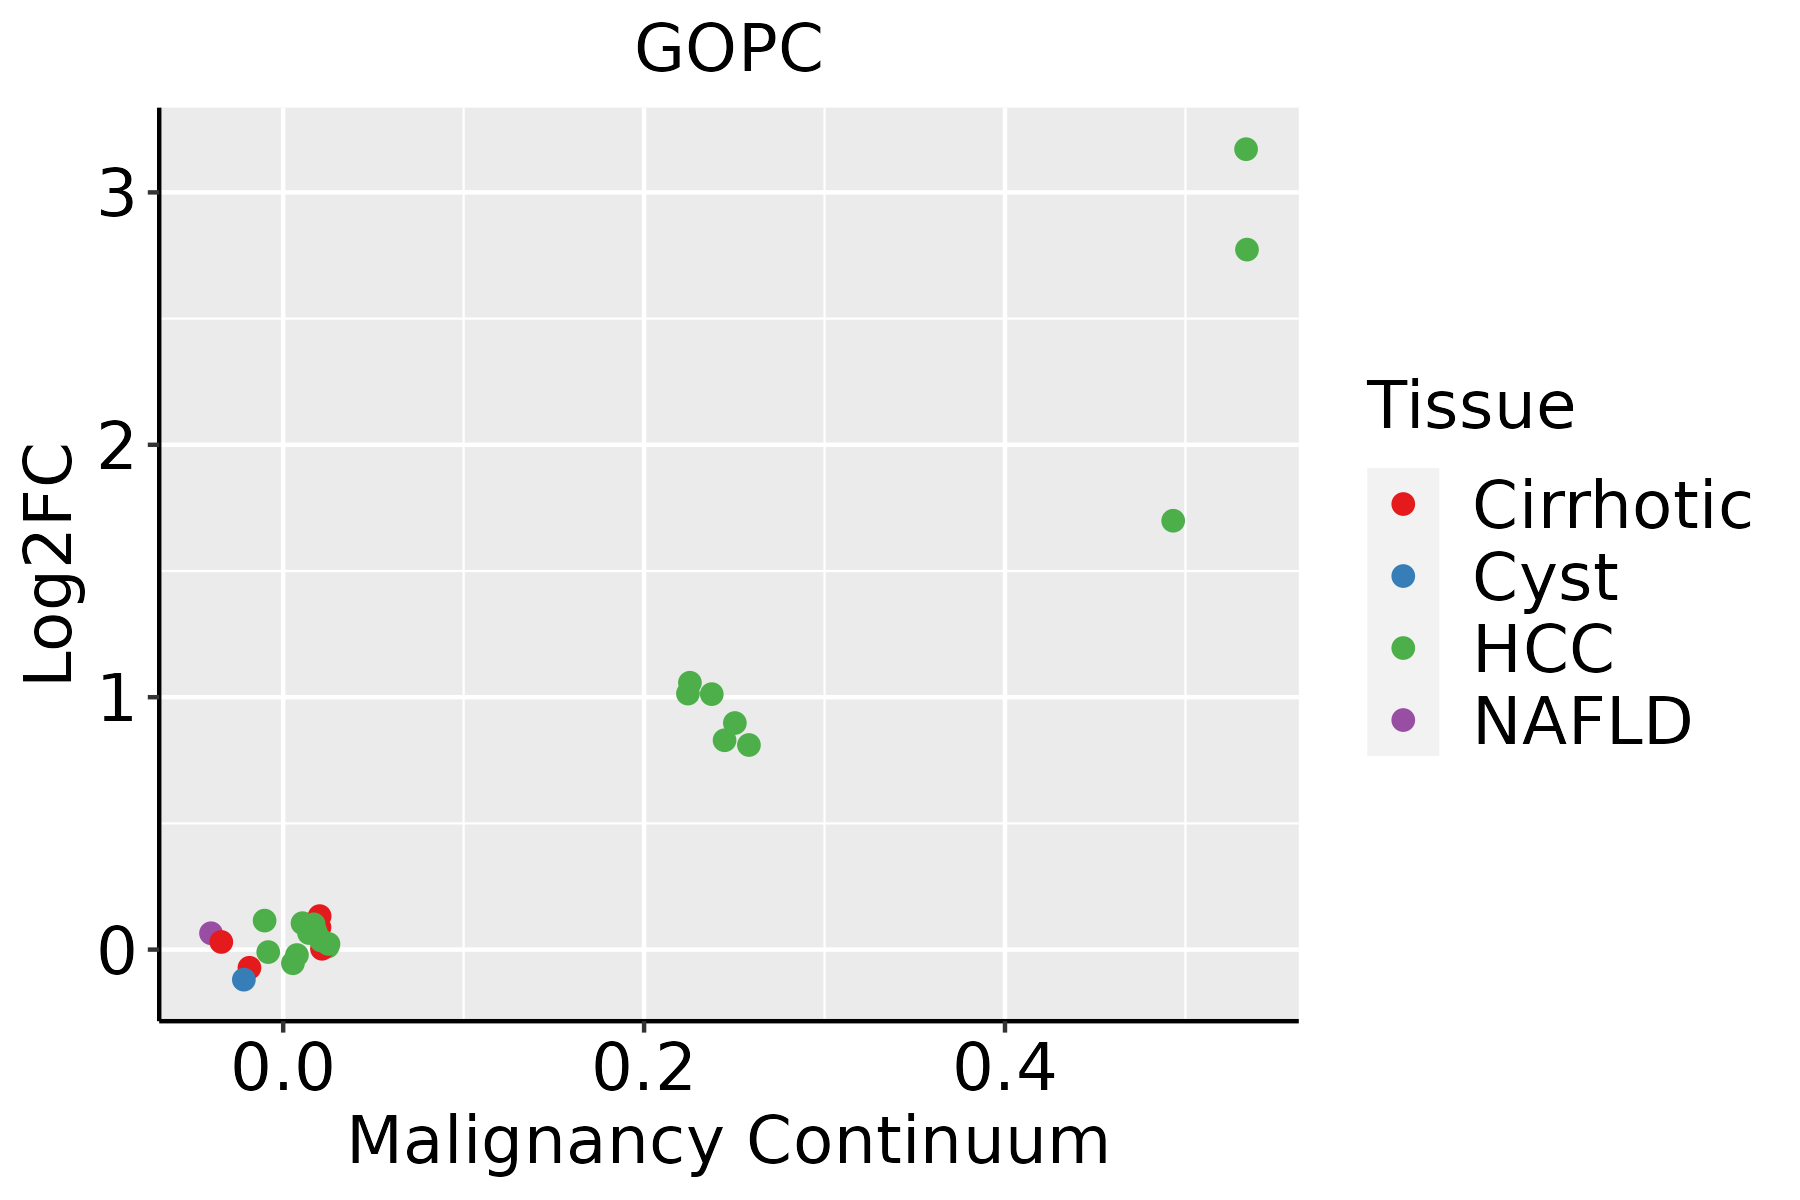
HCC: Hepatocellular carcinoma
NAFLD: Non-alcoholic fatty liver disease
Oral CavityThe image shows the transcriptomic changes along malignancy continuum.log2FC in expression of this searched gene in stem-like cells from each diseased tissue sample relative to stem-like cells in normal samples in each tissue plotted against the malignancy continuum. Samples are colored based on if they are from different disease stage.
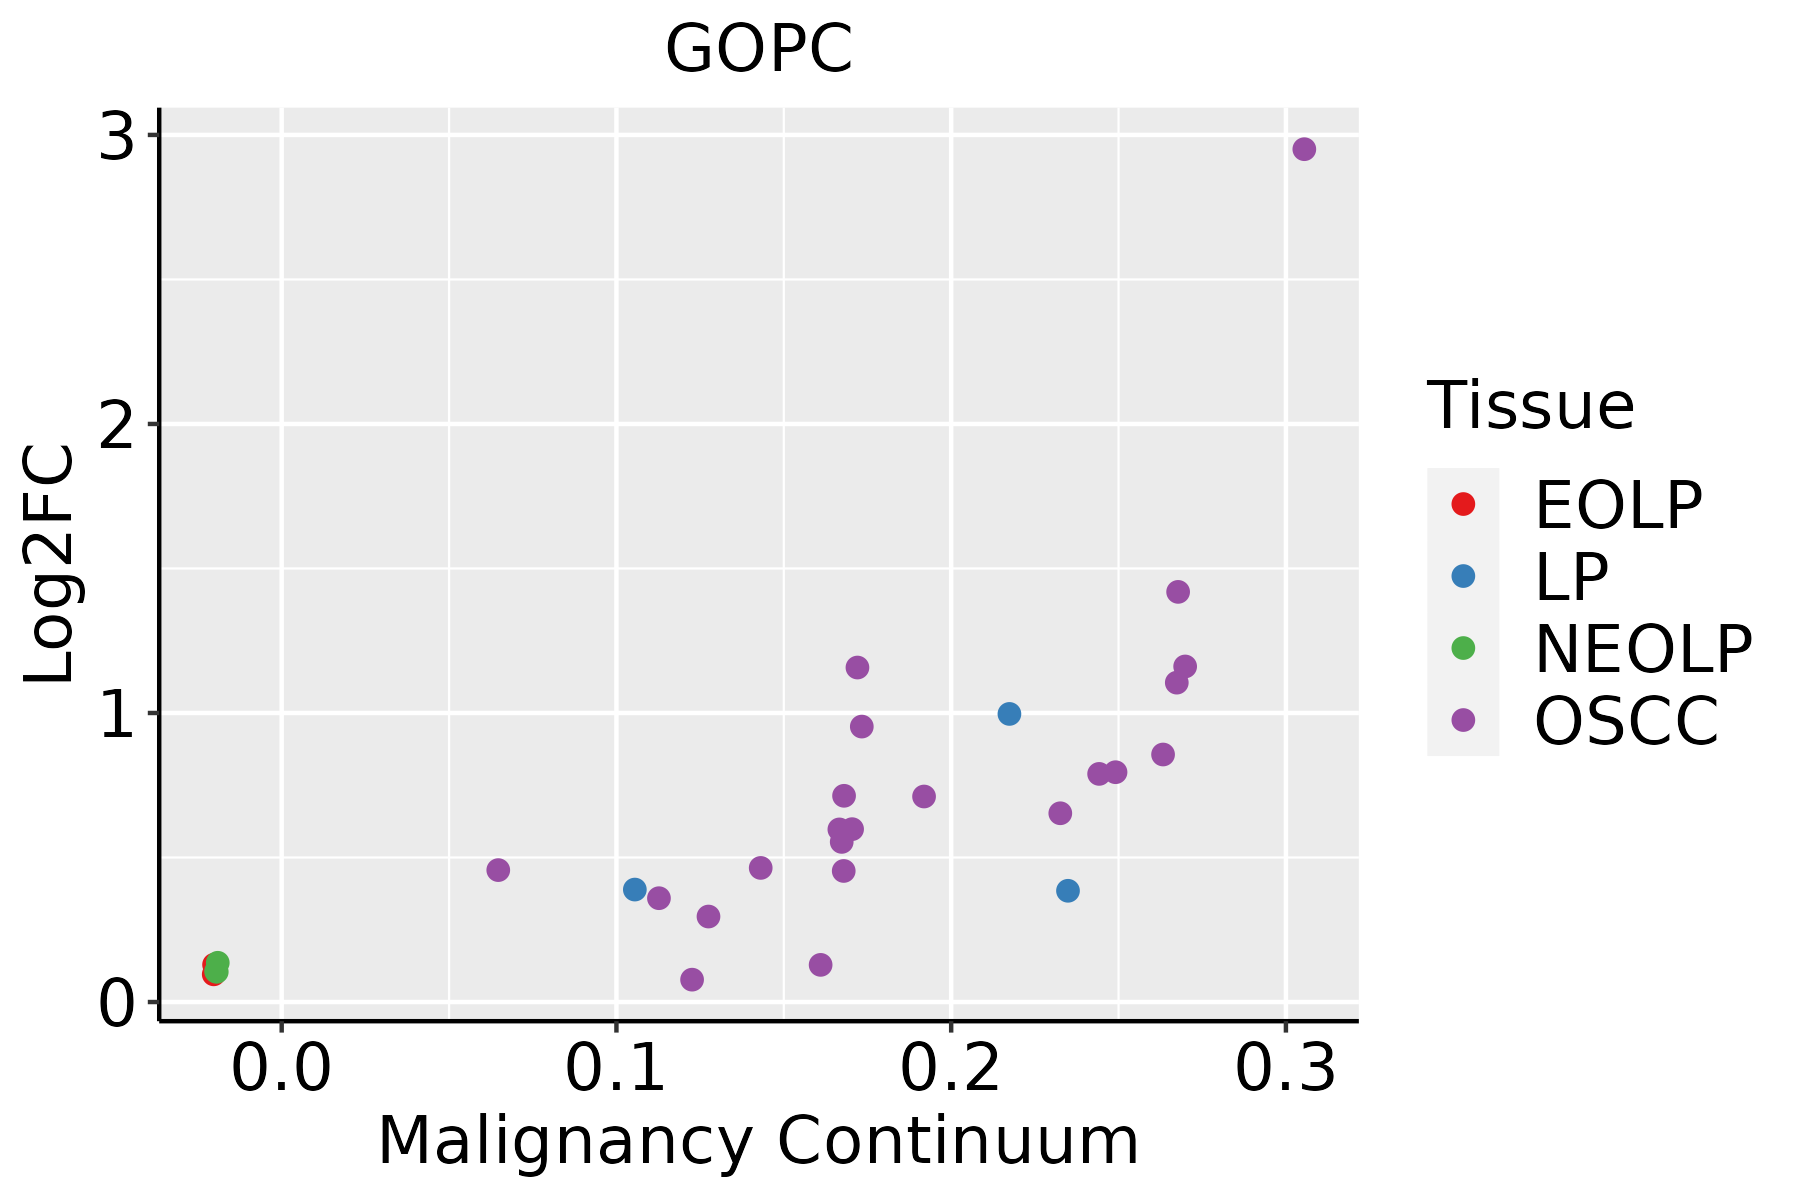
EOLP: Erosive Oral lichen planus
LP: leukoplakia
NEOLP: Non-erosive oral lichen planus
OSCC: Oral squamous cell carcinoma
SkinThe image shows the transcriptomic changes along malignancy continuum.log2FC in expression of this searched gene in stem-like cells from each diseased tissue sample relative to stem-like cells in normal samples in each tissue plotted against the malignancy continuum. Samples are colored based on if they are from different disease stage.AK: Actinic keratosis
cSCC: Cutaneous squamous cell carcinoma
SCCIS:squamous cell carcinoma in situ
ThyroidThe image shows the transcriptomic changes along malignancy continuum.log2FC in expression of this searched gene in stem-like cells from each diseased tissue sample relative to stem-like cells in normal samples in each tissue plotted against the malignancy continuum. Samples are colored based on if they are from different disease stage.ATC: Anaplastic thyroid cancer
HT: Hashimoto's thyroiditis
PTC: Papillary thyroid cancer
∗log2FC in expression of this searched gene in stem-like cells from each diseased tissue sample relative to stem-like cells in normal samples in each tissue plotted against the malignancy continuum. Samples are colored based on if they are from different disease stage.

Top

Malignant transformation related pathway analysis

check buttonFind out the enriched GO biological processes and KEGG pathways involved in transition from healthy to precancer to cancer
check button Figure of enriched GO biological processes.
TissueDisease StageEnriched GO biological Processes
ColorectumADGO analysis - Figure of enriched GO biological processes: Top 15 enriched GO BP terms are showed in the bar plot of each disease state in each tissue. Each row represents a significant GO biological process which is colored according to the -log10(p.adjust).
ColorectumSERGO analysis - Figure of enriched GO biological processes: Top 15 enriched GO BP terms are showed in the bar plot of each disease state in each tissue. Each row represents a significant GO biological process which is colored according to the -log10(p.adjust).
ColorectumMSSGO analysis - Figure of enriched GO biological processes: Top 15 enriched GO BP terms are showed in the bar plot of each disease state in each tissue. Each row represents a significant GO biological process which is colored according to the -log10(p.adjust).
ColorectumMSI-HGO analysis - Figure of enriched GO biological processes: Top 15 enriched GO BP terms are showed in the bar plot of each disease state in each tissue. Each row represents a significant GO biological process which is colored according to the -log10(p.adjust).
ColorectumFAPGO analysis - Figure of enriched GO biological processes: Top 15 enriched GO BP terms are showed in the bar plot of each disease state in each tissue. Each row represents a significant GO biological process which is colored according to the -log10(p.adjust).
∗Top 15 enriched GO BP terms are showed in the bar plot of each disease state in each tissue. Each row represents a significant GO biological process which is colored according to the -log10(p.adjust).
Page: 1 2 3 4 5 6 7 8 9 

check button Enriched GO biological processes.
GO IDTissueDisease StageDescriptionGene RatioBg Ratiopvaluep.adjustCount
GO:000688823ThyroidATCendoplasmic reticulum to Golgi vesicle-mediated transport84/6293130/187234.40e-131.97e-1184
GO:004518532ThyroidATCmaintenance of protein location64/629394/187238.44e-123.16e-1064
GO:000689219ThyroidATCpost-Golgi vesicle-mediated transport68/6293104/187233.30e-111.10e-0968
GO:000689318ThyroidATCGolgi to plasma membrane transport43/629360/187231.85e-094.53e-0843
GO:190437526ThyroidATCregulation of protein localization to cell periphery74/6293125/187233.78e-098.66e-0874
GO:1905475111ThyroidATCregulation of protein localization to membrane96/6293175/187235.55e-091.22e-0796
GO:009887619ThyroidATCvesicle-mediated transport to the plasma membrane77/6293136/187232.86e-085.43e-0777
GO:006195123ThyroidATCestablishment of protein localization to plasma membrane41/629360/187234.02e-087.37e-0741
GO:004300117ThyroidATCGolgi to plasma membrane protein transport30/629340/187231.01e-071.71e-0630
GO:190382816ThyroidATCnegative regulation of cellular protein localization67/6293117/187231.23e-072.06e-0667
GO:190307627ThyroidATCregulation of protein localization to plasma membrane61/6293104/187231.38e-072.26e-0661
GO:005123532ThyroidATCmaintenance of location152/6293327/187237.84e-071.04e-05152
GO:190307713ThyroidATCnegative regulation of protein localization to plasma membrane17/629324/187232.14e-041.41e-0317
GO:190437612ThyroidATCnegative regulation of protein localization to cell periphery17/629326/187239.13e-044.92e-0317
GO:005122014ThyroidATCcytoplasmic sequestering of protein15/629322/187239.63e-045.13e-0315
GO:190495013ThyroidATCnegative regulation of establishment of protein localization61/6293131/187231.38e-037.16e-0361
GO:005122413ThyroidATCnegative regulation of protein transport59/6293127/187231.75e-038.71e-0359
GO:190547613ThyroidATCnegative regulation of protein localization to membrane19/629332/187232.46e-031.14e-0219
GO:005105114ThyroidATCnegative regulation of transport183/6293470/187238.12e-033.13e-02183
Page: 1 2 3 4 5 6 7 8 9 

check button Enriched KEGG pathways.
Pathway IDTissueDisease StageDescriptionGene RatioBg Ratiopvaluep.adjustqvalueCount
Page: 1 

Top

Cell-cell communication analysis

check buttonIdentification of potential cell-cell interactions between two cell types and their ligand-receptor pairs for different disease states
LigandReceptorLRpairPathwayTissueDisease Stage
Page: 1 

Top

Single-cell gene regulatory network inference analysis

check buttonFind out the significant the regulons (TFs) and the target genes of each regulon across cell types for different disease states
TFCell TypeTissueDisease StageTarget GeneRSSRegulon Activity
∗The dot plots of a searched regulon are shown for all cell subpopulations in each disease state of each tissue based on the regulon specific score inferred using pySCENIC and by calculating the average expression.
Page: 1 

Top

Somatic mutation of malignant transformation related genes

check buttonAnnotation of somatic variants for genes involved in malignant transformation
Hugo SymbolVariant ClassVariant ClassificationdbSNP RSHGVScHGVSpHGVSp ShortSWISSPROTBIOTYPESIFTPolyPhenTumor Sample BarcodeTissueHistologySexAgeStageTherapy TypesDrugsOutcome
GOPCSNVMissense_Mutationc.853N>Ap.Pro285Thrp.P285TQ9HD26protein_codingtolerated(0.37)benign(0.428)TCGA-BH-A209-01Breastbreast invasive carcinomaFemale>=65I/IIUnknownUnknownSD
GOPCSNVMissense_Mutationc.684N>Ap.Met228Ilep.M228IQ9HD26protein_codingtolerated(0.08)benign(0.085)TCGA-D8-A1JC-01Breastbreast invasive carcinomaFemale<65III/IVChemotherapyadriamycinSD
GOPCSNVMissense_Mutationc.294N>Cp.Leu98Phep.L98FQ9HD26protein_codingtolerated(0.06)probably_damaging(0.94)TCGA-D8-A1XQ-01Breastbreast invasive carcinomaFemale>=65I/IIUnknownUnknownSD
GOPCinsertionIn_Frame_Insnovelc.625_626insCATp.Lys208_Tyr209insSerp.K208_Y209insSQ9HD26protein_codingTCGA-AN-A0AJ-01Breastbreast invasive carcinomaFemale>=65I/IIUnknownUnknownSD
GOPCinsertionNonsense_Mutationnovelc.623_624insATTCCCGTATTTTTCTAAAGAAAATTAAACCTGAGGCCCCTp.Tyr209PhefsTer9p.Y209Ffs*9Q9HD26protein_codingTCGA-AN-A0AJ-01Breastbreast invasive carcinomaFemale>=65I/IIUnknownUnknownSD
GOPCinsertionFrame_Shift_Insnovelc.1192_1193insAp.Leu398TyrfsTer6p.L398Yfs*6Q9HD26protein_codingTCGA-AR-A0TU-01Breastbreast invasive carcinomaFemale<65I/IIUnspecificDoxorubicinSD
GOPCSNVMissense_Mutationnovelc.112N>Cp.Glu38Glnp.E38QQ9HD26protein_codingdeleterious(0)probably_damaging(0.998)TCGA-VS-A8EI-01Cervixcervical & endocervical cancerFemale<65I/IIChemotherapycisplatinCR
GOPCinsertionFrame_Shift_Insnovelc.501dupAp.Glu168ArgfsTer9p.E168Rfs*9Q9HD26protein_codingTCGA-2W-A8YY-01Cervixcervical & endocervical cancerFemale<65I/IIChemotherapycisplatinCR
GOPCSNVMissense_Mutationnovelc.1044N>Tp.Lys348Asnp.K348NQ9HD26protein_codingdeleterious(0.01)probably_damaging(0.978)TCGA-AA-3947-01Colorectumcolon adenocarcinomaFemale<65I/IIUnknownUnknownSD
GOPCSNVMissense_Mutationc.608C>Tp.Ala203Valp.A203VQ9HD26protein_codingdeleterious(0.01)probably_damaging(0.999)TCGA-AA-A00N-01Colorectumcolon adenocarcinomaMale>=65I/IIUnknownUnknownPD
Page: 1 2 3 4 5 6 

Top

Related drugs of malignant transformation related genes

check buttonIdentification of chemicals and drugs interact with genes involved in malignant transfromation
(DGIdb 4.0)
Entrez IDSymbolCategoryInteraction TypesDrug Claim NameDrug NamePMIDs
Page: 1