
|
|||||
|
 | |
| |
| |
| |
| |
| |
|
Gene: GIPC1 |
Gene summary for GIPC1 |
| Gene information | Species | Human | Gene symbol | GIPC1 | Gene ID | 10755 |
| Gene name | GIPC PDZ domain containing family member 1 | |
| Gene Alias | C19orf3 | |
| Cytomap | 19p13.12 | |
| Gene Type | protein-coding | GO ID | GO:0000910 | UniProtAcc | A0A024R7I0 |
Top |
Malignant transformation analysis |
| Identification of the aberrant gene expression in precancerous and cancerous lesions by comparing the gene expression of stem-like cells in diseased tissues with normal stem cells |
| Entrez ID | Symbol | Replicates | Species | Organ | Tissue | Adj P-value | Log2FC | Malignancy |
| 10755 | GIPC1 | GSM4909282 | Human | Breast | IDC | 5.61e-33 | 6.94e-01 | -0.0288 |
| 10755 | GIPC1 | GSM4909285 | Human | Breast | IDC | 1.06e-09 | 4.33e-01 | 0.21 |
| 10755 | GIPC1 | GSM4909287 | Human | Breast | IDC | 4.82e-04 | 2.94e-01 | 0.2057 |
| 10755 | GIPC1 | GSM4909296 | Human | Breast | IDC | 4.24e-05 | -1.04e-01 | 0.1524 |
| 10755 | GIPC1 | GSM4909297 | Human | Breast | IDC | 1.88e-03 | -1.28e-01 | 0.1517 |
| 10755 | GIPC1 | GSM4909311 | Human | Breast | IDC | 7.03e-21 | -2.00e-01 | 0.1534 |
| 10755 | GIPC1 | GSM4909312 | Human | Breast | IDC | 1.38e-06 | -1.03e-01 | 0.1552 |
| 10755 | GIPC1 | GSM4909317 | Human | Breast | IDC | 2.92e-03 | 2.92e-01 | 0.1355 |
| 10755 | GIPC1 | GSM4909319 | Human | Breast | IDC | 1.30e-22 | -1.38e-01 | 0.1563 |
| 10755 | GIPC1 | GSM4909320 | Human | Breast | IDC | 2.38e-02 | -2.17e-01 | 0.1575 |
| 10755 | GIPC1 | GSM4909321 | Human | Breast | IDC | 2.87e-07 | -8.39e-02 | 0.1559 |
| 10755 | GIPC1 | brca1 | Human | Breast | Precancer | 4.72e-36 | 7.80e-01 | -0.0338 |
| 10755 | GIPC1 | brca2 | Human | Breast | Precancer | 8.88e-05 | 2.85e-01 | -0.024 |
| 10755 | GIPC1 | M2 | Human | Breast | IDC | 4.73e-02 | 1.11e-01 | 0.21 |
| 10755 | GIPC1 | NCCBC14 | Human | Breast | DCIS | 8.51e-05 | 3.35e-02 | 0.2021 |
| 10755 | GIPC1 | NCCBC5 | Human | Breast | DCIS | 1.56e-07 | -2.48e-01 | 0.2046 |
| 10755 | GIPC1 | P1 | Human | Breast | IDC | 1.41e-10 | -1.42e-01 | 0.1527 |
| 10755 | GIPC1 | DCIS2 | Human | Breast | DCIS | 3.64e-45 | 1.59e-01 | 0.0085 |
| 10755 | GIPC1 | CA_HPV_3 | Human | Cervix | CC | 2.59e-04 | 4.20e-02 | 0.0414 |
| 10755 | GIPC1 | Tumor | Human | Cervix | CC | 7.13e-27 | 5.78e-01 | 0.1241 |
| Page: 1 2 3 4 5 6 7 8 9 |
| Tissue | Expression Dynamics | Abbreviation |
| Breast | 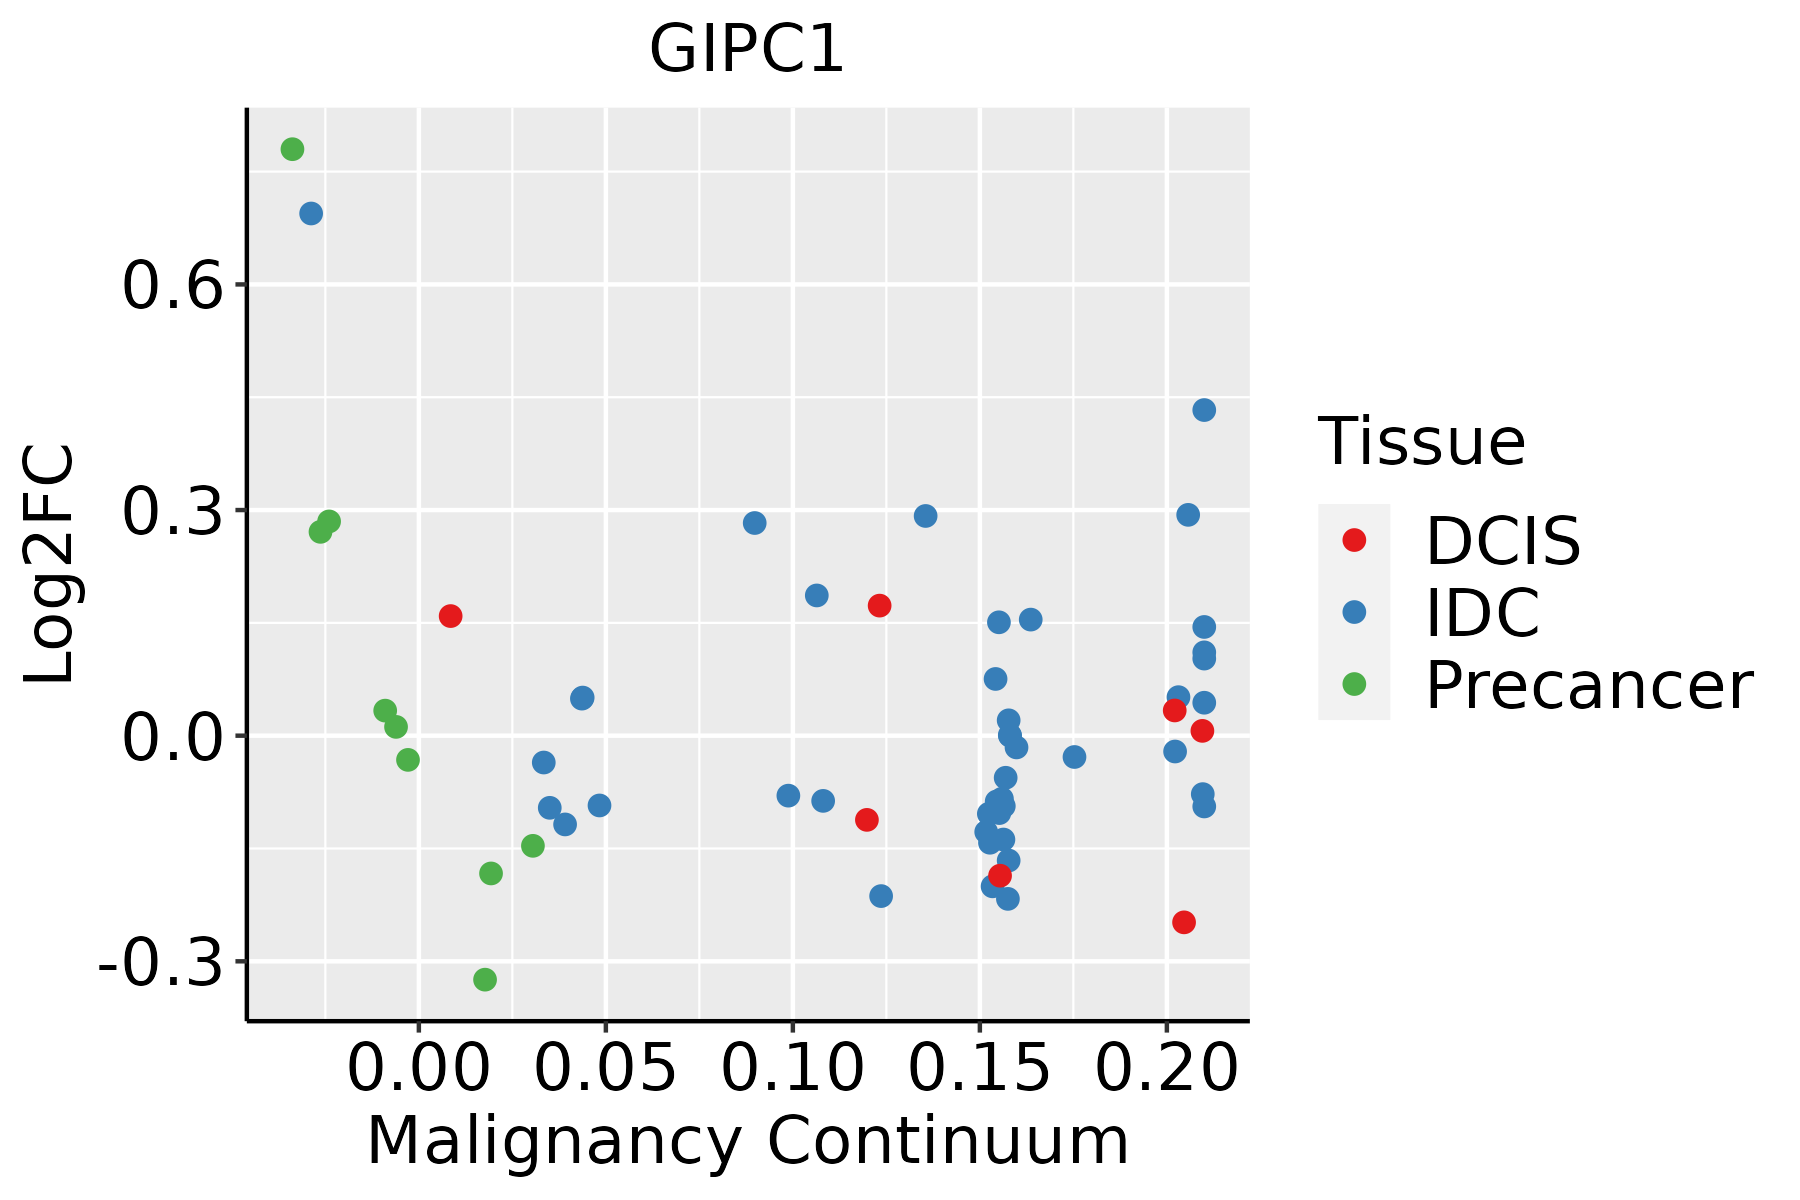 | IDC: Invasive ductal carcinoma |
| DCIS: Ductal carcinoma in situ | ||
| Precancer(BRCA1-mut): Precancerous lesion from BRCA1 mutation carriers | ||
| Cervix | 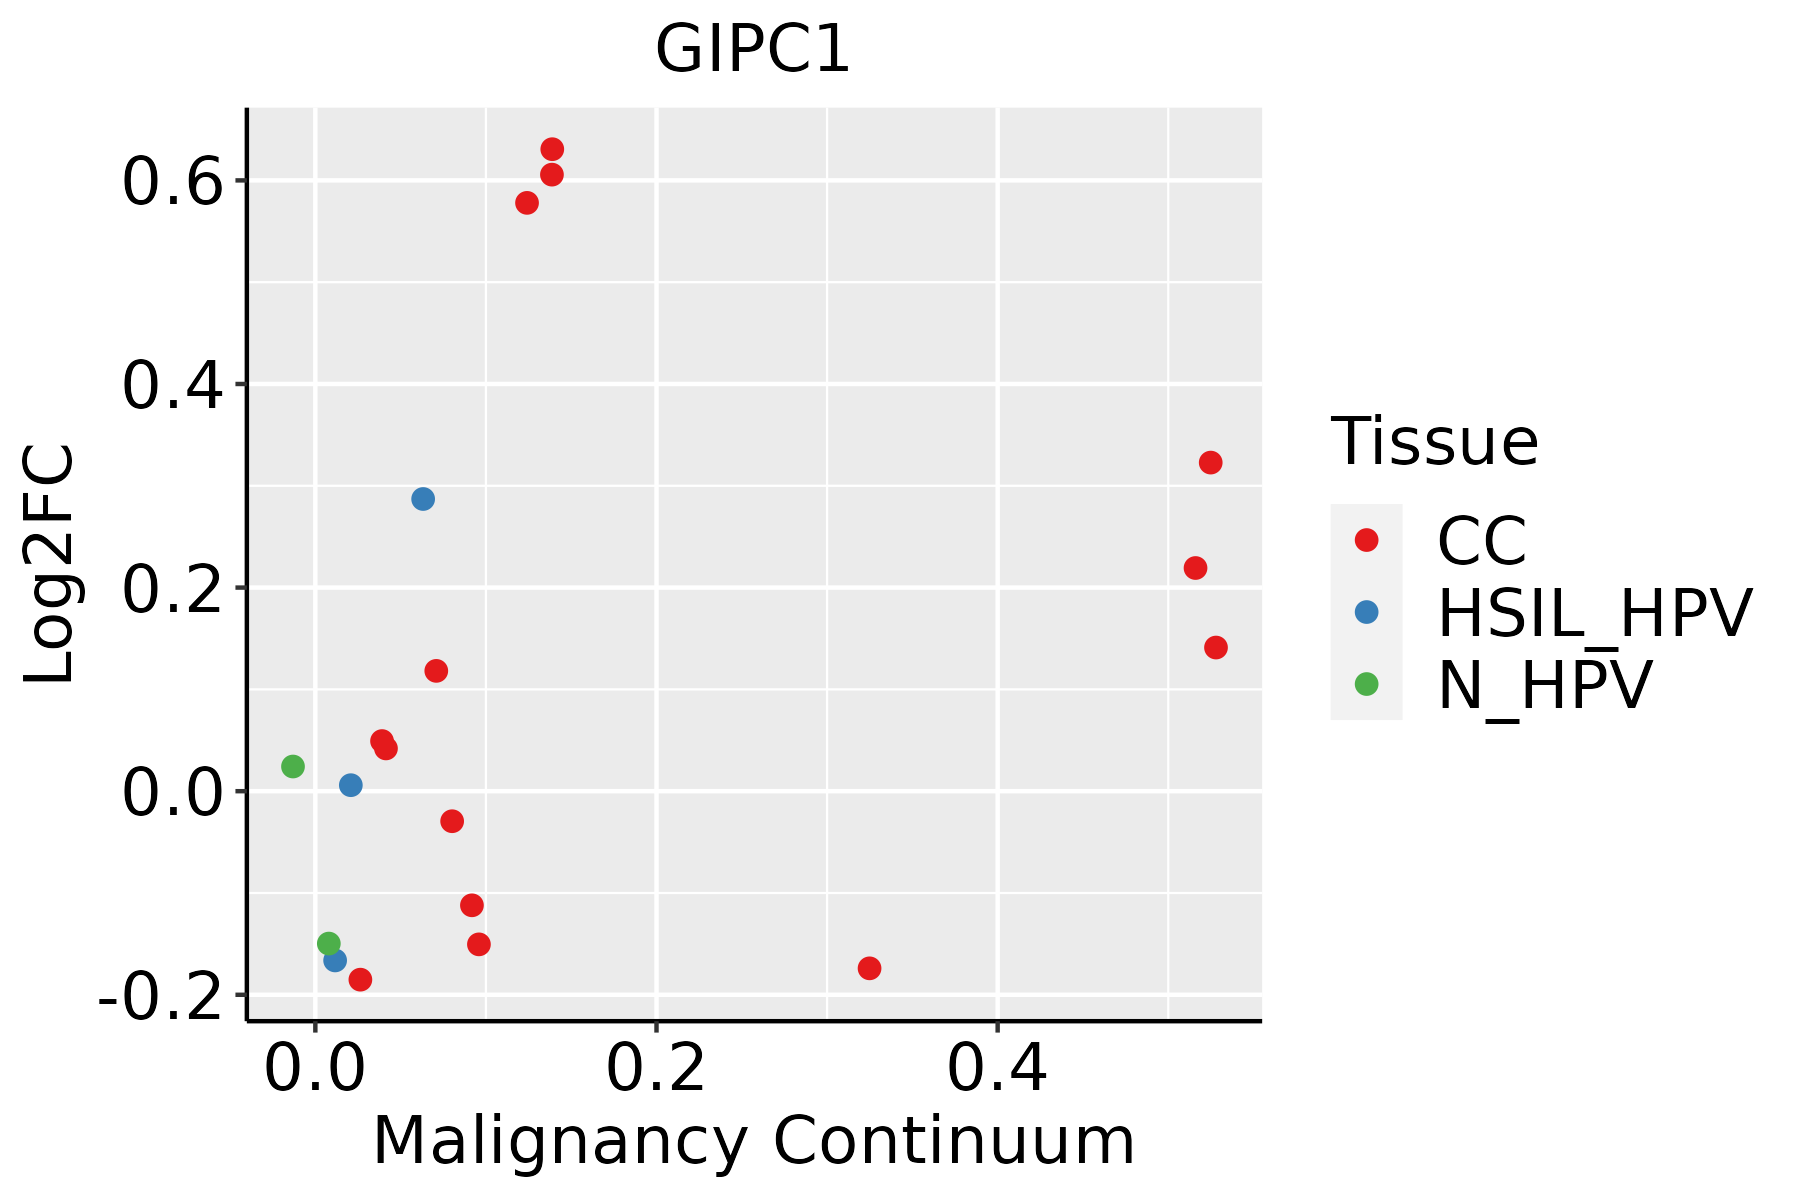 | CC: Cervix cancer |
| HSIL_HPV: HPV-infected high-grade squamous intraepithelial lesions | ||
| N_HPV: HPV-infected normal cervix | ||
| Colorectum (GSE201348) |  | FAP: Familial adenomatous polyposis |
| CRC: Colorectal cancer | ||
| Colorectum (HTA11) |  | AD: Adenomas |
| SER: Sessile serrated lesions | ||
| MSI-H: Microsatellite-high colorectal cancer | ||
| MSS: Microsatellite stable colorectal cancer | ||
| Esophagus | 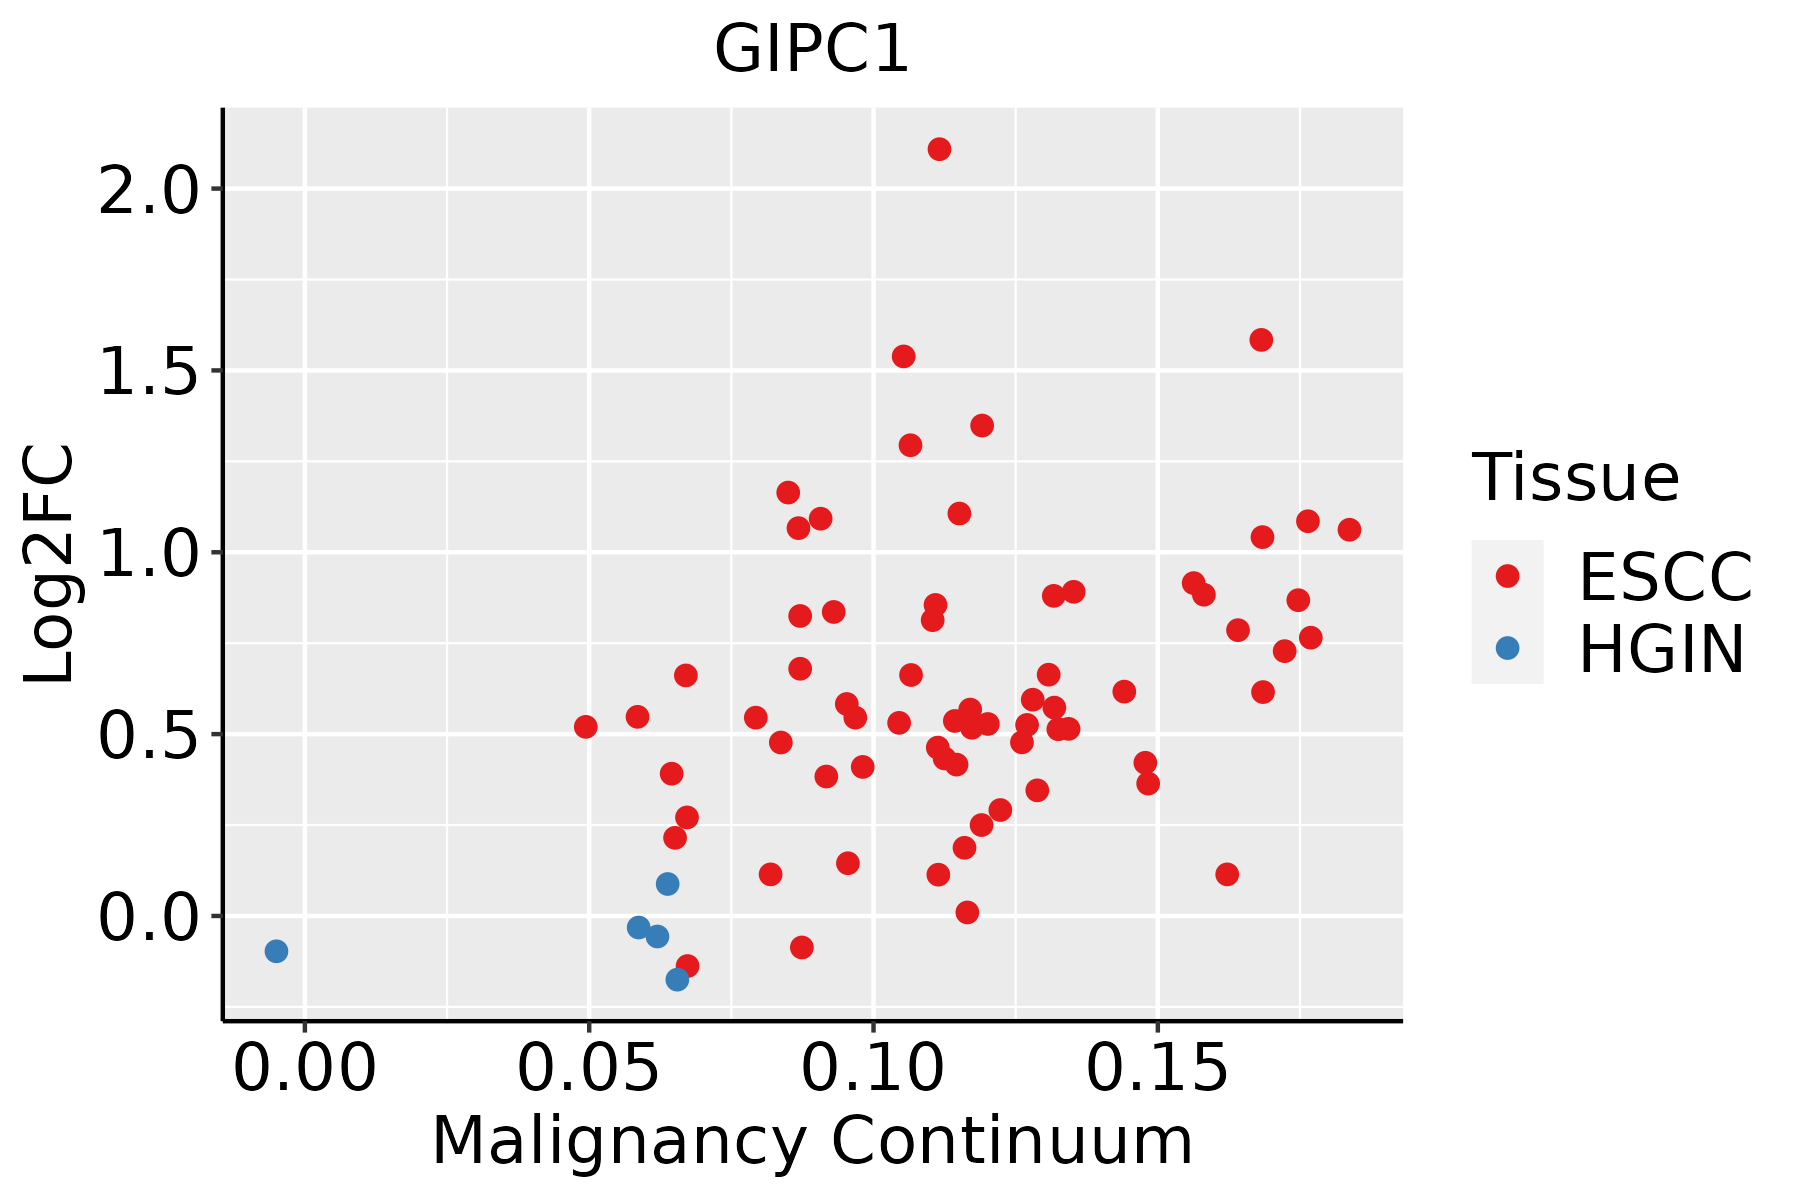 | ESCC: Esophageal squamous cell carcinoma |
| HGIN: High-grade intraepithelial neoplasias | ||
| LGIN: Low-grade intraepithelial neoplasias | ||
| Liver | 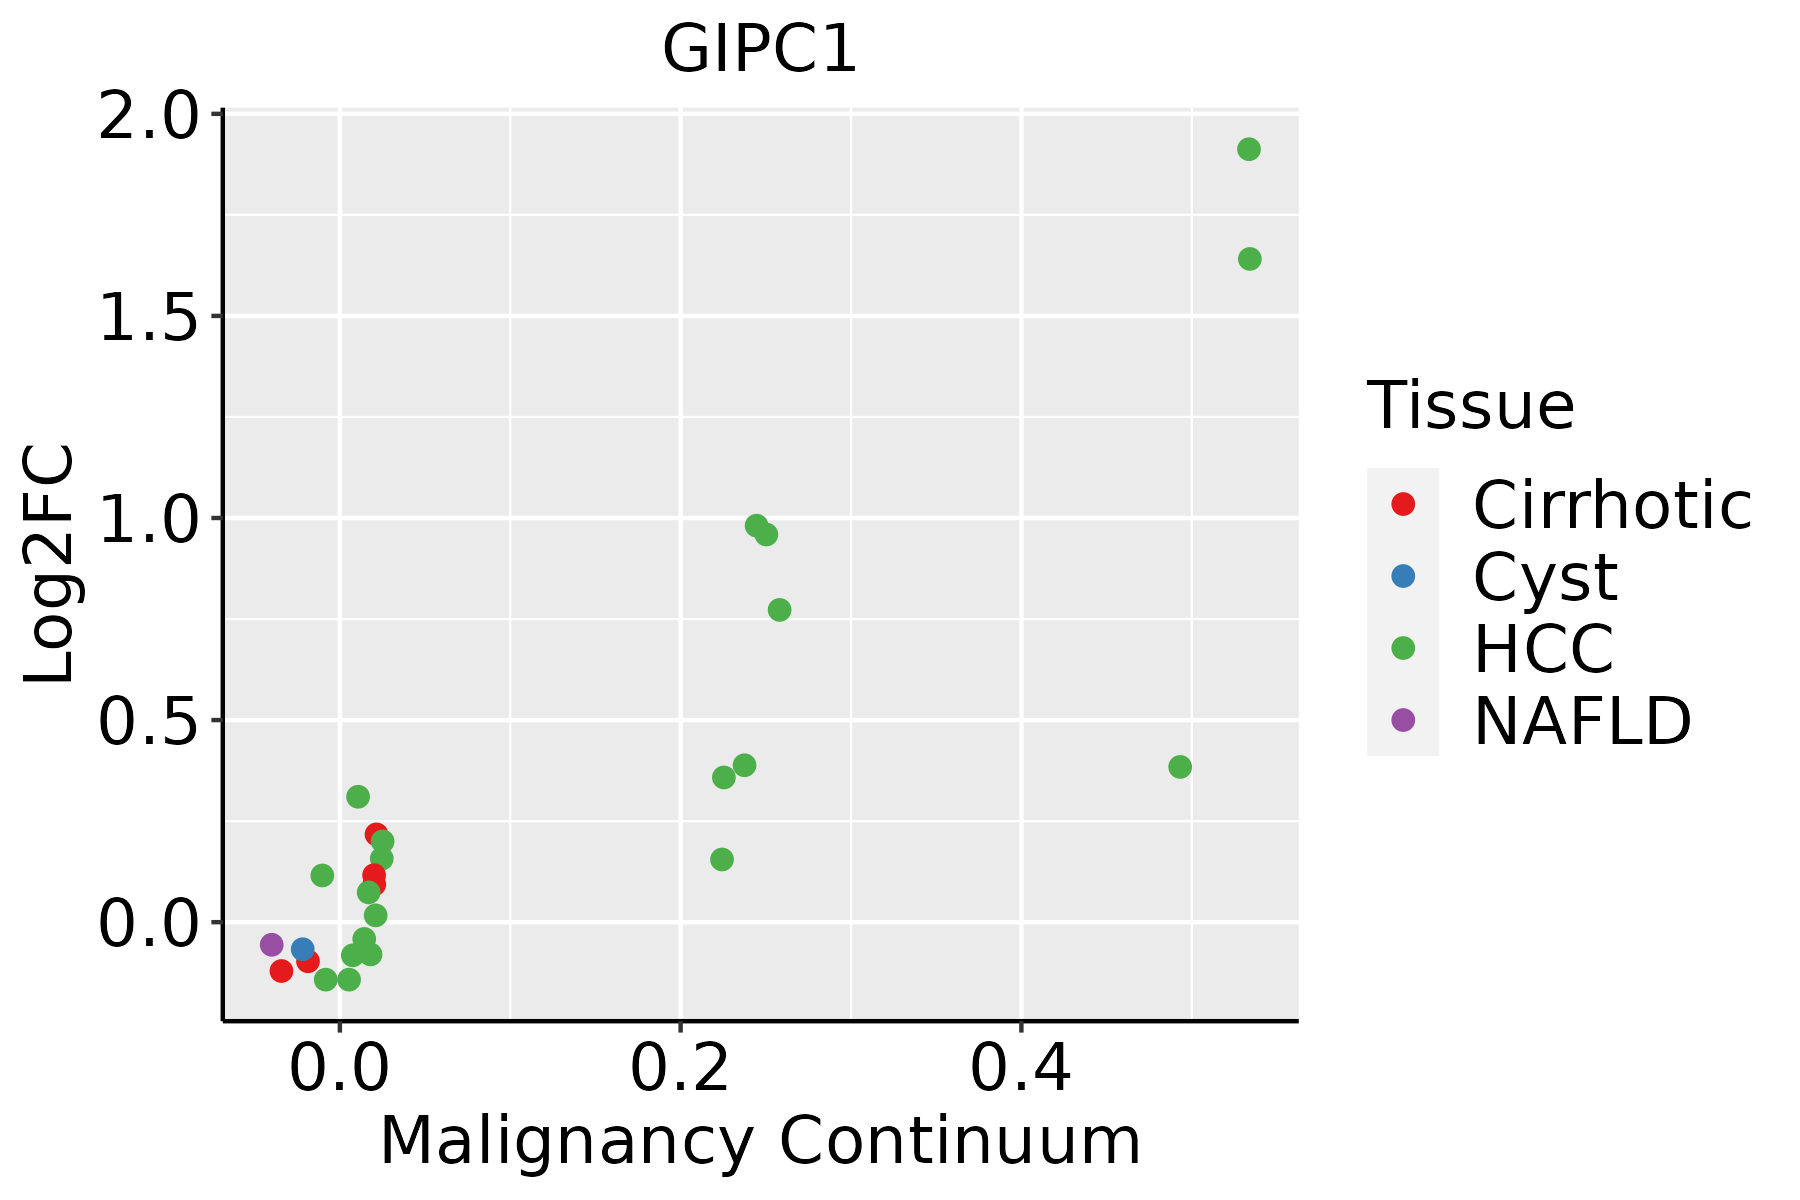 | HCC: Hepatocellular carcinoma |
| NAFLD: Non-alcoholic fatty liver disease | ||
| Oral Cavity |  | EOLP: Erosive Oral lichen planus |
| LP: leukoplakia | ||
| NEOLP: Non-erosive oral lichen planus | ||
| OSCC: Oral squamous cell carcinoma | ||
| Skin | 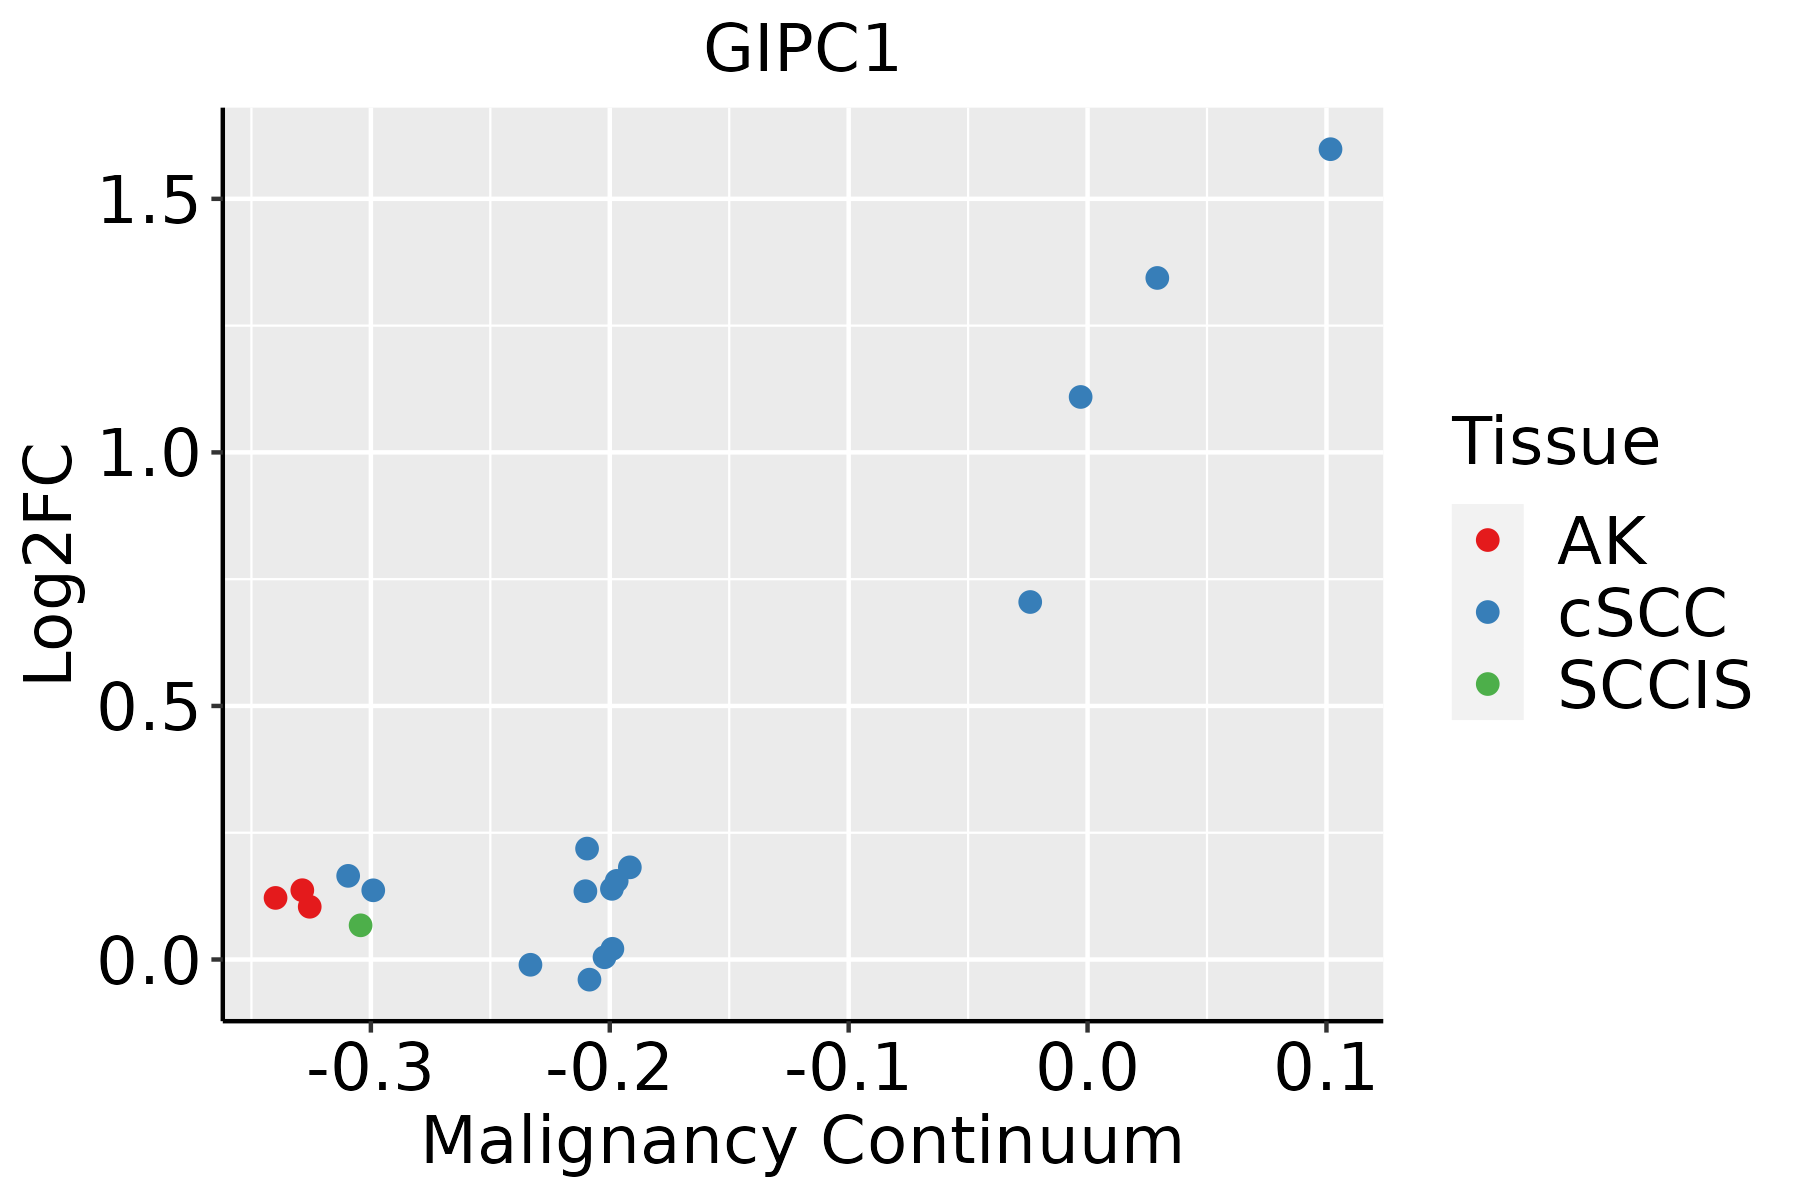 | AK: Actinic keratosis |
| cSCC: Cutaneous squamous cell carcinoma | ||
| SCCIS:squamous cell carcinoma in situ | ||
| Thyroid | 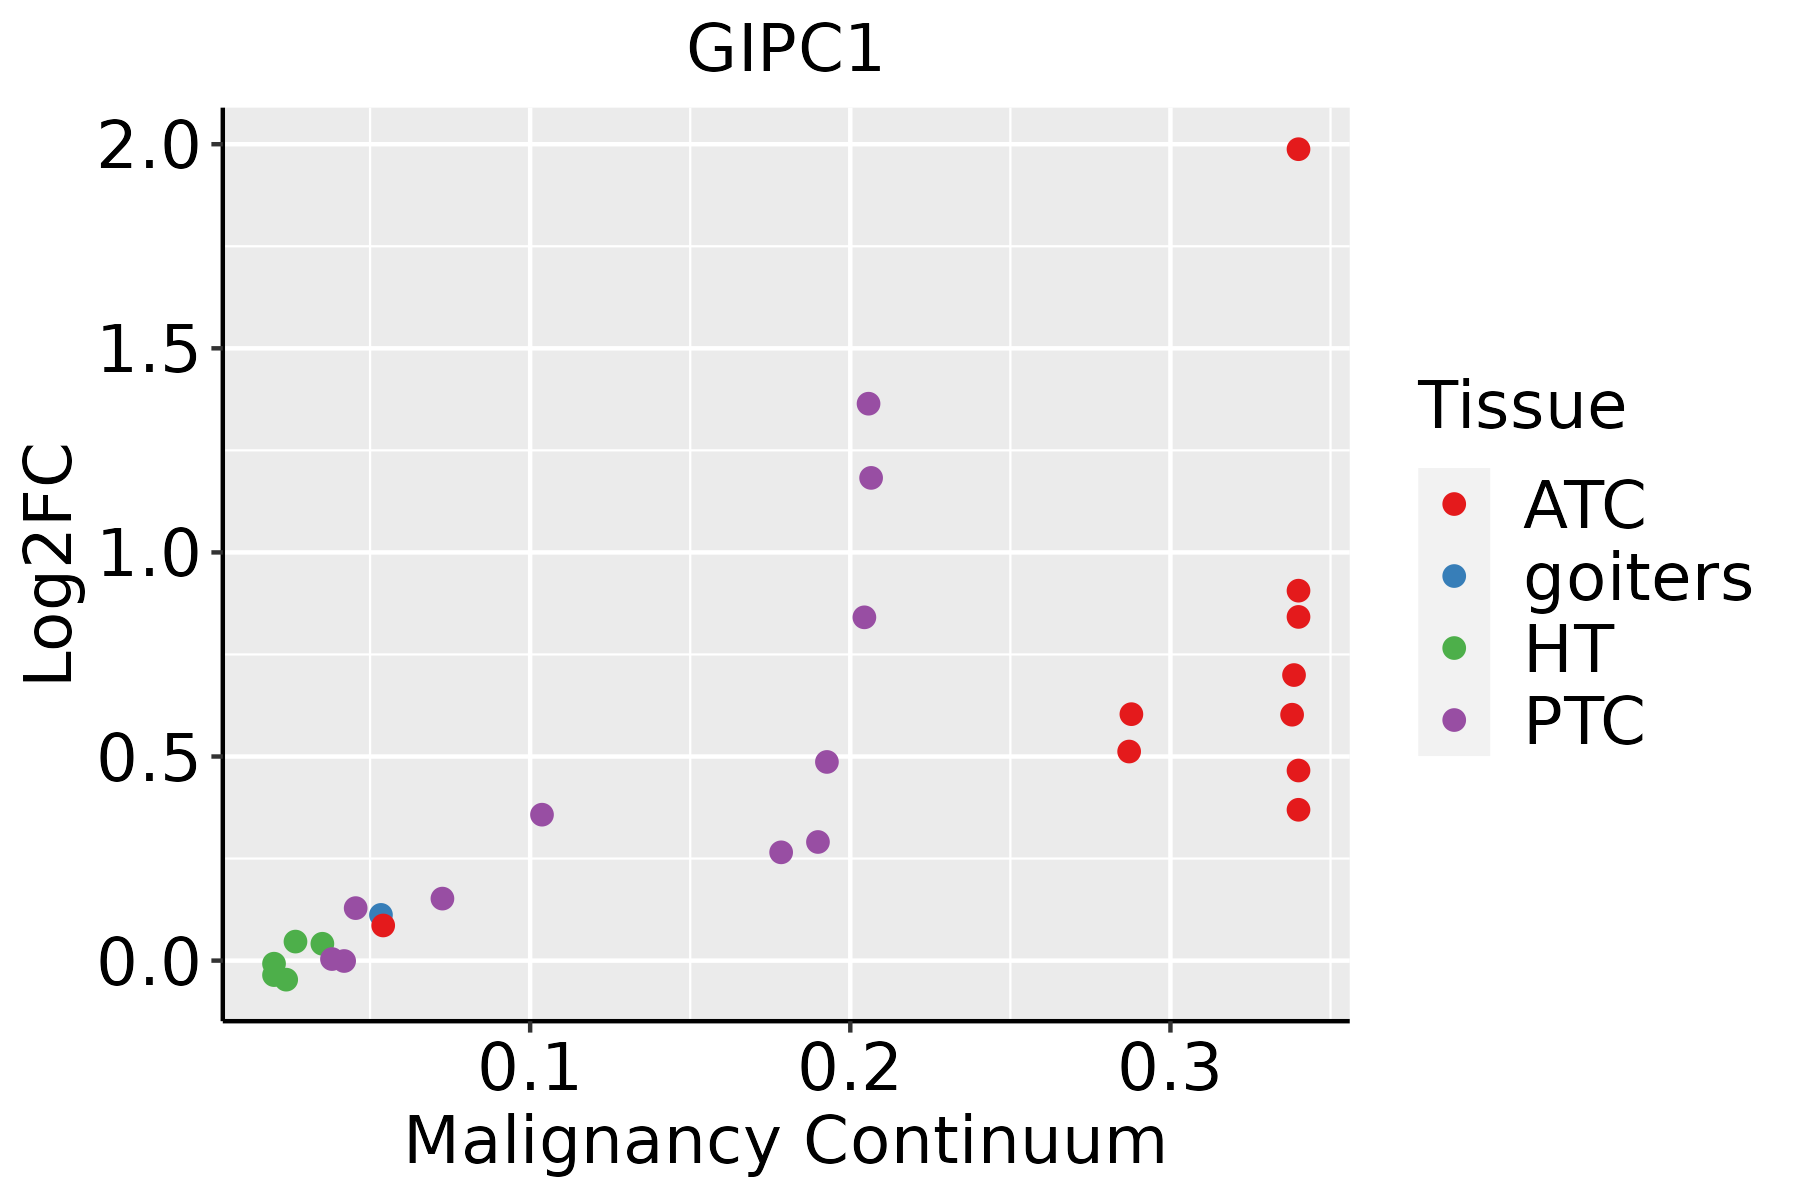 | ATC: Anaplastic thyroid cancer |
| HT: Hashimoto's thyroiditis | ||
| PTC: Papillary thyroid cancer |
| ∗log2FC in expression of this searched gene in stem-like cells from each diseased tissue sample relative to stem-like cells in normal samples in each tissue plotted against the malignancy continuum. Samples are colored based on if they are from different disease stage. |
Top |
Malignant transformation related pathway analysis |
| Find out the enriched GO biological processes and KEGG pathways involved in transition from healthy to precancer to cancer |
| Tissue | Disease Stage | Enriched GO biological Processes |
| Colorectum | AD |  |
| Colorectum | SER |  |
| Colorectum | MSS |  |
| Colorectum | MSI-H |  |
| Colorectum | FAP |  |
| ∗Top 15 enriched GO BP terms are showed in the bar plot of each disease state in each tissue. Each row represents a significant GO biological process which is colored according to the -log10(p.adjust). |
| Page: 1 2 3 4 5 6 7 8 9 |
| GO ID | Tissue | Disease Stage | Description | Gene Ratio | Bg Ratio | pvalue | p.adjust | Count |
| GO:0017157 | Colorectum | AD | regulation of exocytosis | 59/3918 | 202/18723 | 3.20e-03 | 2.36e-02 | 59 |
| GO:0045787 | Colorectum | AD | positive regulation of cell cycle | 85/3918 | 313/18723 | 4.76e-03 | 3.22e-02 | 85 |
| GO:0099003 | Colorectum | AD | vesicle-mediated transport in synapse | 57/3918 | 200/18723 | 6.53e-03 | 4.06e-02 | 57 |
| GO:00421761 | Colorectum | SER | regulation of protein catabolic process | 126/2897 | 391/18723 | 5.33e-17 | 2.52e-14 | 126 |
| GO:19033621 | Colorectum | SER | regulation of cellular protein catabolic process | 91/2897 | 255/18723 | 1.22e-15 | 5.36e-13 | 91 |
| GO:19030501 | Colorectum | SER | regulation of proteolysis involved in cellular protein catabolic process | 77/2897 | 221/18723 | 7.85e-13 | 2.00e-10 | 77 |
| GO:00104981 | Colorectum | SER | proteasomal protein catabolic process | 132/2897 | 490/18723 | 3.08e-11 | 5.55e-09 | 132 |
| GO:20000581 | Colorectum | SER | regulation of ubiquitin-dependent protein catabolic process | 57/2897 | 164/18723 | 7.98e-10 | 8.74e-08 | 57 |
| GO:00611361 | Colorectum | SER | regulation of proteasomal protein catabolic process | 62/2897 | 187/18723 | 1.28e-09 | 1.31e-07 | 62 |
| GO:00316471 | Colorectum | SER | regulation of protein stability | 86/2897 | 298/18723 | 2.56e-09 | 2.42e-07 | 86 |
| GO:00431611 | Colorectum | SER | proteasome-mediated ubiquitin-dependent protein catabolic process | 105/2897 | 412/18723 | 7.48e-08 | 4.70e-06 | 105 |
| GO:00324341 | Colorectum | SER | regulation of proteasomal ubiquitin-dependent protein catabolic process | 45/2897 | 134/18723 | 1.48e-07 | 8.67e-06 | 45 |
| GO:00098951 | Colorectum | SER | negative regulation of catabolic process | 84/2897 | 320/18723 | 3.93e-07 | 2.06e-05 | 84 |
| GO:00458611 | Colorectum | SER | negative regulation of proteolysis | 88/2897 | 351/18723 | 1.74e-06 | 7.50e-05 | 88 |
| GO:00313301 | Colorectum | SER | negative regulation of cellular catabolic process | 70/2897 | 262/18723 | 1.79e-06 | 7.70e-05 | 70 |
| GO:19033631 | Colorectum | SER | negative regulation of cellular protein catabolic process | 28/2897 | 75/18723 | 3.17e-06 | 1.25e-04 | 28 |
| GO:00421771 | Colorectum | SER | negative regulation of protein catabolic process | 38/2897 | 121/18723 | 8.20e-06 | 2.76e-04 | 38 |
| GO:00066051 | Colorectum | SER | protein targeting | 76/2897 | 314/18723 | 3.19e-05 | 8.47e-04 | 76 |
| GO:19030511 | Colorectum | SER | negative regulation of proteolysis involved in cellular protein catabolic process | 23/2897 | 64/18723 | 4.75e-05 | 1.18e-03 | 23 |
| GO:00016671 | Colorectum | SER | ameboidal-type cell migration | 105/2897 | 475/18723 | 6.97e-05 | 1.59e-03 | 105 |
| Page: 1 2 3 4 5 6 7 8 9 10 11 12 13 14 15 16 17 18 19 20 21 22 23 24 25 26 27 28 |
| Pathway ID | Tissue | Disease Stage | Description | Gene Ratio | Bg Ratio | pvalue | p.adjust | qvalue | Count |
| Page: 1 |
Top |
Cell-cell communication analysis |
| Identification of potential cell-cell interactions between two cell types and their ligand-receptor pairs for different disease states |
| Ligand | Receptor | LRpair | Pathway | Tissue | Disease Stage |
| Page: 1 |
Top |
Single-cell gene regulatory network inference analysis |
| Find out the significant the regulons (TFs) and the target genes of each regulon across cell types for different disease states |
| TF | Cell Type | Tissue | Disease Stage | Target Gene | RSS | Regulon Activity |
| ∗The dot plots of a searched regulon are shown for all cell subpopulations in each disease state of each tissue based on the regulon specific score inferred using pySCENIC and by calculating the average expression. |
| Page: 1 |
Top |
Somatic mutation of malignant transformation related genes |
| Annotation of somatic variants for genes involved in malignant transformation |
| Hugo Symbol | Variant Class | Variant Classification | dbSNP RS | HGVSc | HGVSp | HGVSp Short | SWISSPROT | BIOTYPE | SIFT | PolyPhen | Tumor Sample Barcode | Tissue | Histology | Sex | Age | Stage | Therapy Types | Drugs | Outcome |
| GIPC1 | SNV | Missense_Mutation | c.926N>A | p.Gly309Asp | p.G309D | O14908 | protein_coding | tolerated(0.06) | possibly_damaging(0.463) | TCGA-BH-A0BZ-01 | Breast | breast invasive carcinoma | Female | <65 | III/IV | Chemotherapy | doxorubicin | CR | |
| GIPC1 | insertion | Frame_Shift_Ins | novel | c.829_830insAGCTGGGAAAGGACAAAAGGAACCC | p.Gly277GlufsTer31 | p.G277Efs*31 | O14908 | protein_coding | TCGA-AQ-A04J-01 | Breast | breast invasive carcinoma | Female | <65 | I/II | Chemotherapy | cytoxan | SD | ||
| GIPC1 | SNV | Missense_Mutation | c.766N>G | p.Leu256Val | p.L256V | O14908 | protein_coding | tolerated(1) | benign(0) | TCGA-IR-A3LK-01 | Cervix | cervical & endocervical cancer | Female | >=65 | I/II | Chemotherapy | cisplatin | PD | |
| GIPC1 | SNV | Missense_Mutation | novel | c.916G>A | p.Glu306Lys | p.E306K | O14908 | protein_coding | tolerated(0.19) | benign(0.027) | TCGA-VS-A8QM-01 | Cervix | cervical & endocervical cancer | Female | <65 | I/II | Chemotherapy | cisplatin | PD |
| GIPC1 | SNV | Missense_Mutation | rs199560632 | c.22N>T | p.Arg8Trp | p.R8W | O14908 | protein_coding | tolerated_low_confidence(0.1) | probably_damaging(0.973) | TCGA-CM-4743-01 | Colorectum | colon adenocarcinoma | Male | >=65 | I/II | Chemotherapy | capecitabine | SD |
| GIPC1 | SNV | Missense_Mutation | novel | c.634N>G | p.Thr212Ala | p.T212A | O14908 | protein_coding | deleterious(0) | benign(0.055) | TCGA-CM-5861-01 | Colorectum | colon adenocarcinoma | Female | <65 | I/II | Unknown | Unknown | PD |
| GIPC1 | SNV | Missense_Mutation | c.272N>A | p.Arg91His | p.R91H | O14908 | protein_coding | tolerated(0.1) | benign(0) | TCGA-D5-6928-01 | Colorectum | colon adenocarcinoma | Male | >=65 | I/II | Unknown | Unknown | SD | |
| GIPC1 | deletion | Frame_Shift_Del | c.344delG | p.Gly115AlafsTer13 | p.G115Afs*13 | O14908 | protein_coding | TCGA-AA-3672-01 | Colorectum | colon adenocarcinoma | Female | >=65 | III/IV | Unknown | Unknown | SD | |||
| GIPC1 | SNV | Missense_Mutation | rs766409659 | c.644G>A | p.Arg215His | p.R215H | O14908 | protein_coding | tolerated(0.05) | benign(0.012) | TCGA-AJ-A2QM-01 | Endometrium | uterine corpus endometrioid carcinoma | Female | >=65 | I/II | Chemotherapy | carboplatin | CR |
| GIPC1 | SNV | Missense_Mutation | novel | c.578N>T | p.Glu193Val | p.E193V | O14908 | protein_coding | deleterious(0) | probably_damaging(0.98) | TCGA-AP-A051-01 | Endometrium | uterine corpus endometrioid carcinoma | Female | >=65 | I/II | Unknown | Unknown | SD |
| Page: 1 2 3 4 |
Top |
Related drugs of malignant transformation related genes |
| Identification of chemicals and drugs interact with genes involved in malignant transfromation |
| (DGIdb 4.0) |
| Entrez ID | Symbol | Category | Interaction Types | Drug Claim Name | Drug Name | PMIDs |
| Page: 1 |

Copyright 2023-Present -The University of Texas Health Science Center at Houston |