
|
|||||
|
 | |
| |
| |
| |
| |
| |
|
Gene: FLNB |
Gene summary for FLNB |
| Gene information | Species | Human | Gene symbol | FLNB | Gene ID | 2317 |
| Gene name | filamin B | |
| Gene Alias | ABP-278 | |
| Cytomap | 3p14.3 | |
| Gene Type | protein-coding | GO ID | GO:0000902 | UniProtAcc | O75369 |
Top |
Malignant transformation analysis |
| Identification of the aberrant gene expression in precancerous and cancerous lesions by comparing the gene expression of stem-like cells in diseased tissues with normal stem cells |
| Entrez ID | Symbol | Replicates | Species | Organ | Tissue | Adj P-value | Log2FC | Malignancy |
| 2317 | FLNB | GSM4909281 | Human | Breast | IDC | 2.52e-14 | 4.93e-01 | 0.21 |
| 2317 | FLNB | GSM4909296 | Human | Breast | IDC | 5.82e-03 | -1.20e-01 | 0.1524 |
| 2317 | FLNB | GSM4909297 | Human | Breast | IDC | 2.00e-02 | -9.20e-02 | 0.1517 |
| 2317 | FLNB | GSM4909298 | Human | Breast | IDC | 1.72e-09 | 3.35e-01 | 0.1551 |
| 2317 | FLNB | GSM4909301 | Human | Breast | IDC | 2.85e-27 | 7.38e-01 | 0.1577 |
| 2317 | FLNB | GSM4909304 | Human | Breast | IDC | 1.03e-14 | 5.06e-01 | 0.1636 |
| 2317 | FLNB | GSM4909311 | Human | Breast | IDC | 1.84e-19 | 1.27e-01 | 0.1534 |
| 2317 | FLNB | GSM4909312 | Human | Breast | IDC | 4.41e-02 | -1.42e-02 | 0.1552 |
| 2317 | FLNB | GSM4909319 | Human | Breast | IDC | 7.46e-16 | -7.51e-02 | 0.1563 |
| 2317 | FLNB | GSM4909320 | Human | Breast | IDC | 1.37e-06 | 3.32e-01 | 0.1575 |
| 2317 | FLNB | GSM4909321 | Human | Breast | IDC | 1.33e-09 | 1.60e-01 | 0.1559 |
| 2317 | FLNB | brca3 | Human | Breast | Precancer | 3.75e-04 | 2.39e-01 | -0.0263 |
| 2317 | FLNB | M1 | Human | Breast | IDC | 1.27e-14 | 6.30e-01 | 0.1577 |
| 2317 | FLNB | NCCBC14 | Human | Breast | DCIS | 1.09e-05 | -7.28e-02 | 0.2021 |
| 2317 | FLNB | NCCBC2 | Human | Breast | DCIS | 7.91e-12 | 6.93e-01 | 0.1554 |
| 2317 | FLNB | NCCBC5 | Human | Breast | DCIS | 3.00e-06 | -1.09e-01 | 0.2046 |
| 2317 | FLNB | P1 | Human | Breast | IDC | 3.17e-08 | 1.52e-01 | 0.1527 |
| 2317 | FLNB | P3 | Human | Breast | IDC | 1.00e-09 | 8.24e-01 | 0.1542 |
| 2317 | FLNB | DCIS2 | Human | Breast | DCIS | 1.69e-40 | 6.47e-02 | 0.0085 |
| 2317 | FLNB | CCI_1 | Human | Cervix | CC | 4.47e-12 | 1.38e+00 | 0.528 |
| Page: 1 2 3 4 5 6 7 8 9 10 11 12 13 14 |
| Tissue | Expression Dynamics | Abbreviation |
| Breast | 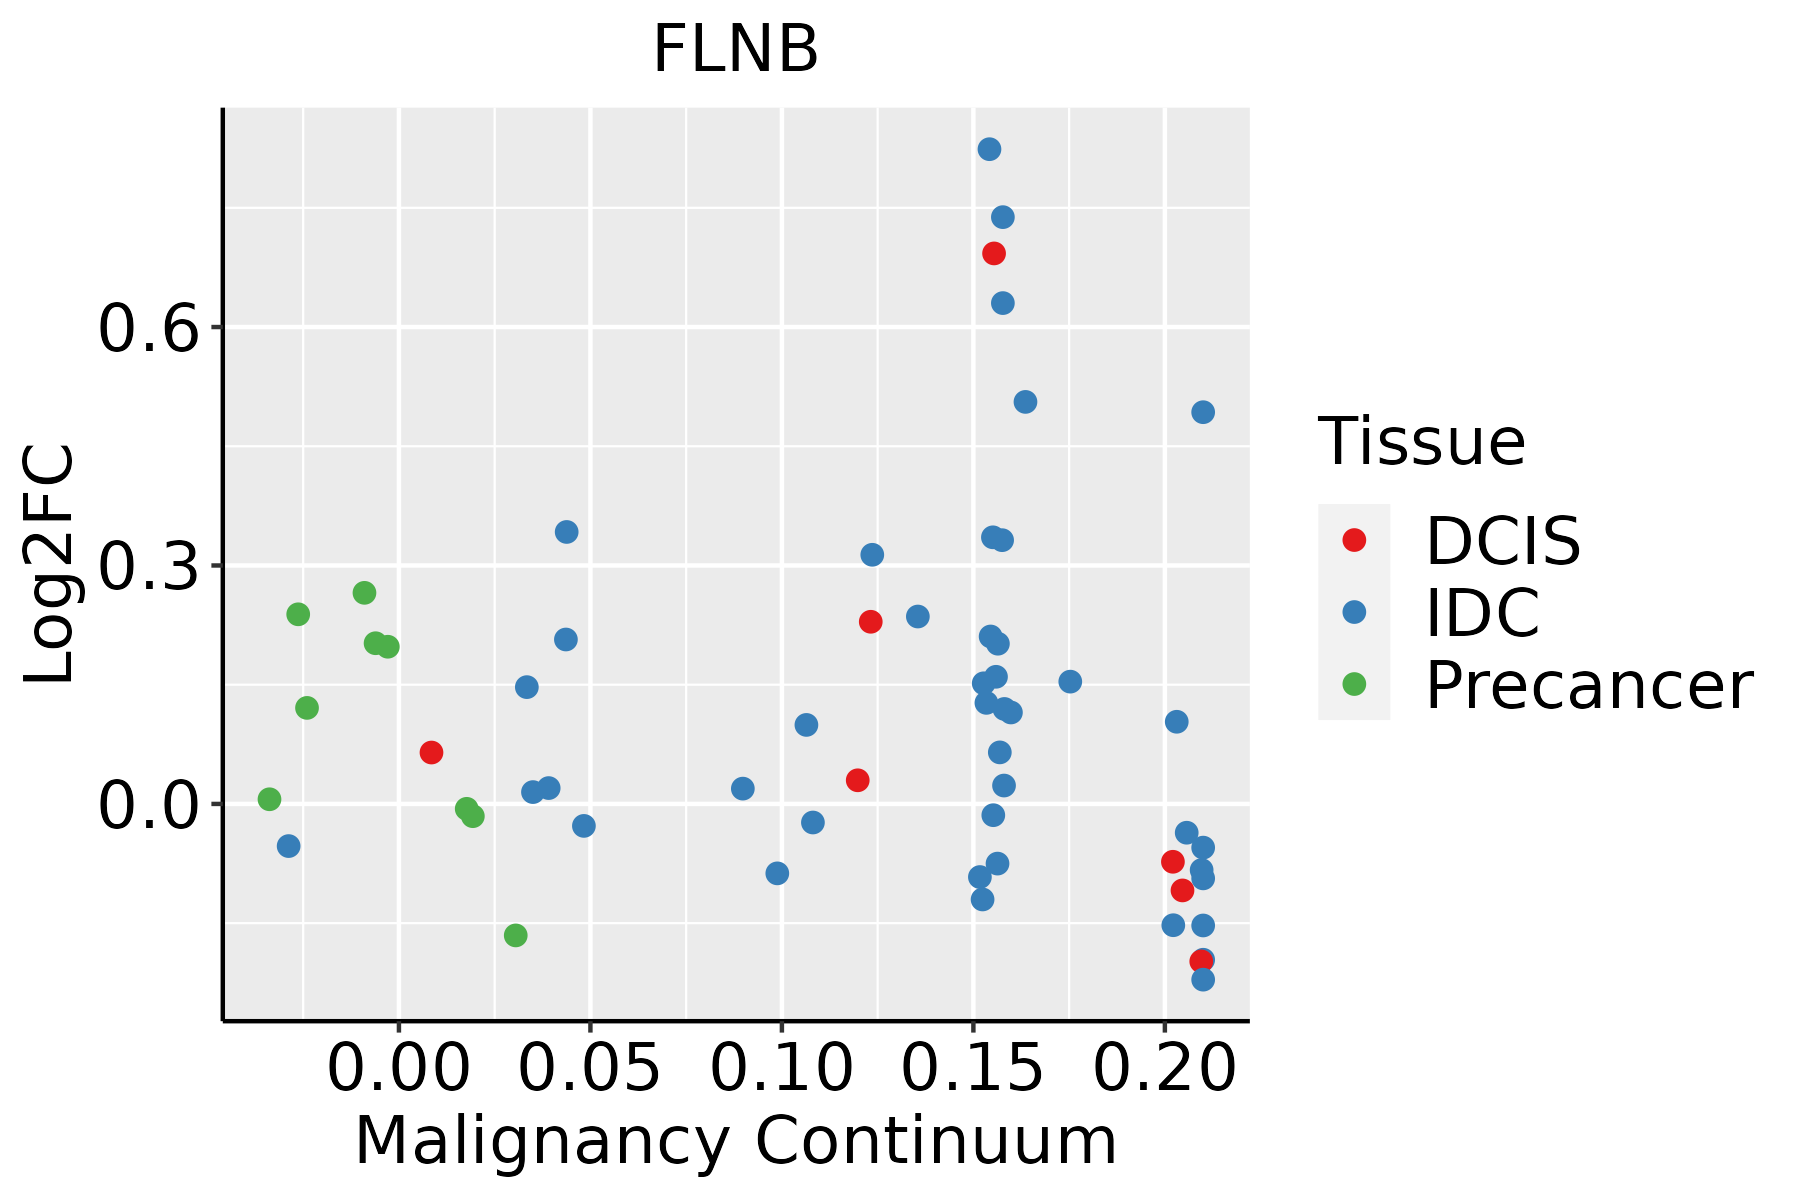 | IDC: Invasive ductal carcinoma |
| DCIS: Ductal carcinoma in situ | ||
| Precancer(BRCA1-mut): Precancerous lesion from BRCA1 mutation carriers | ||
| Cervix |  | CC: Cervix cancer |
| HSIL_HPV: HPV-infected high-grade squamous intraepithelial lesions | ||
| N_HPV: HPV-infected normal cervix | ||
| Colorectum (GSE201348) |  | FAP: Familial adenomatous polyposis |
| CRC: Colorectal cancer | ||
| Colorectum (HTA11) | 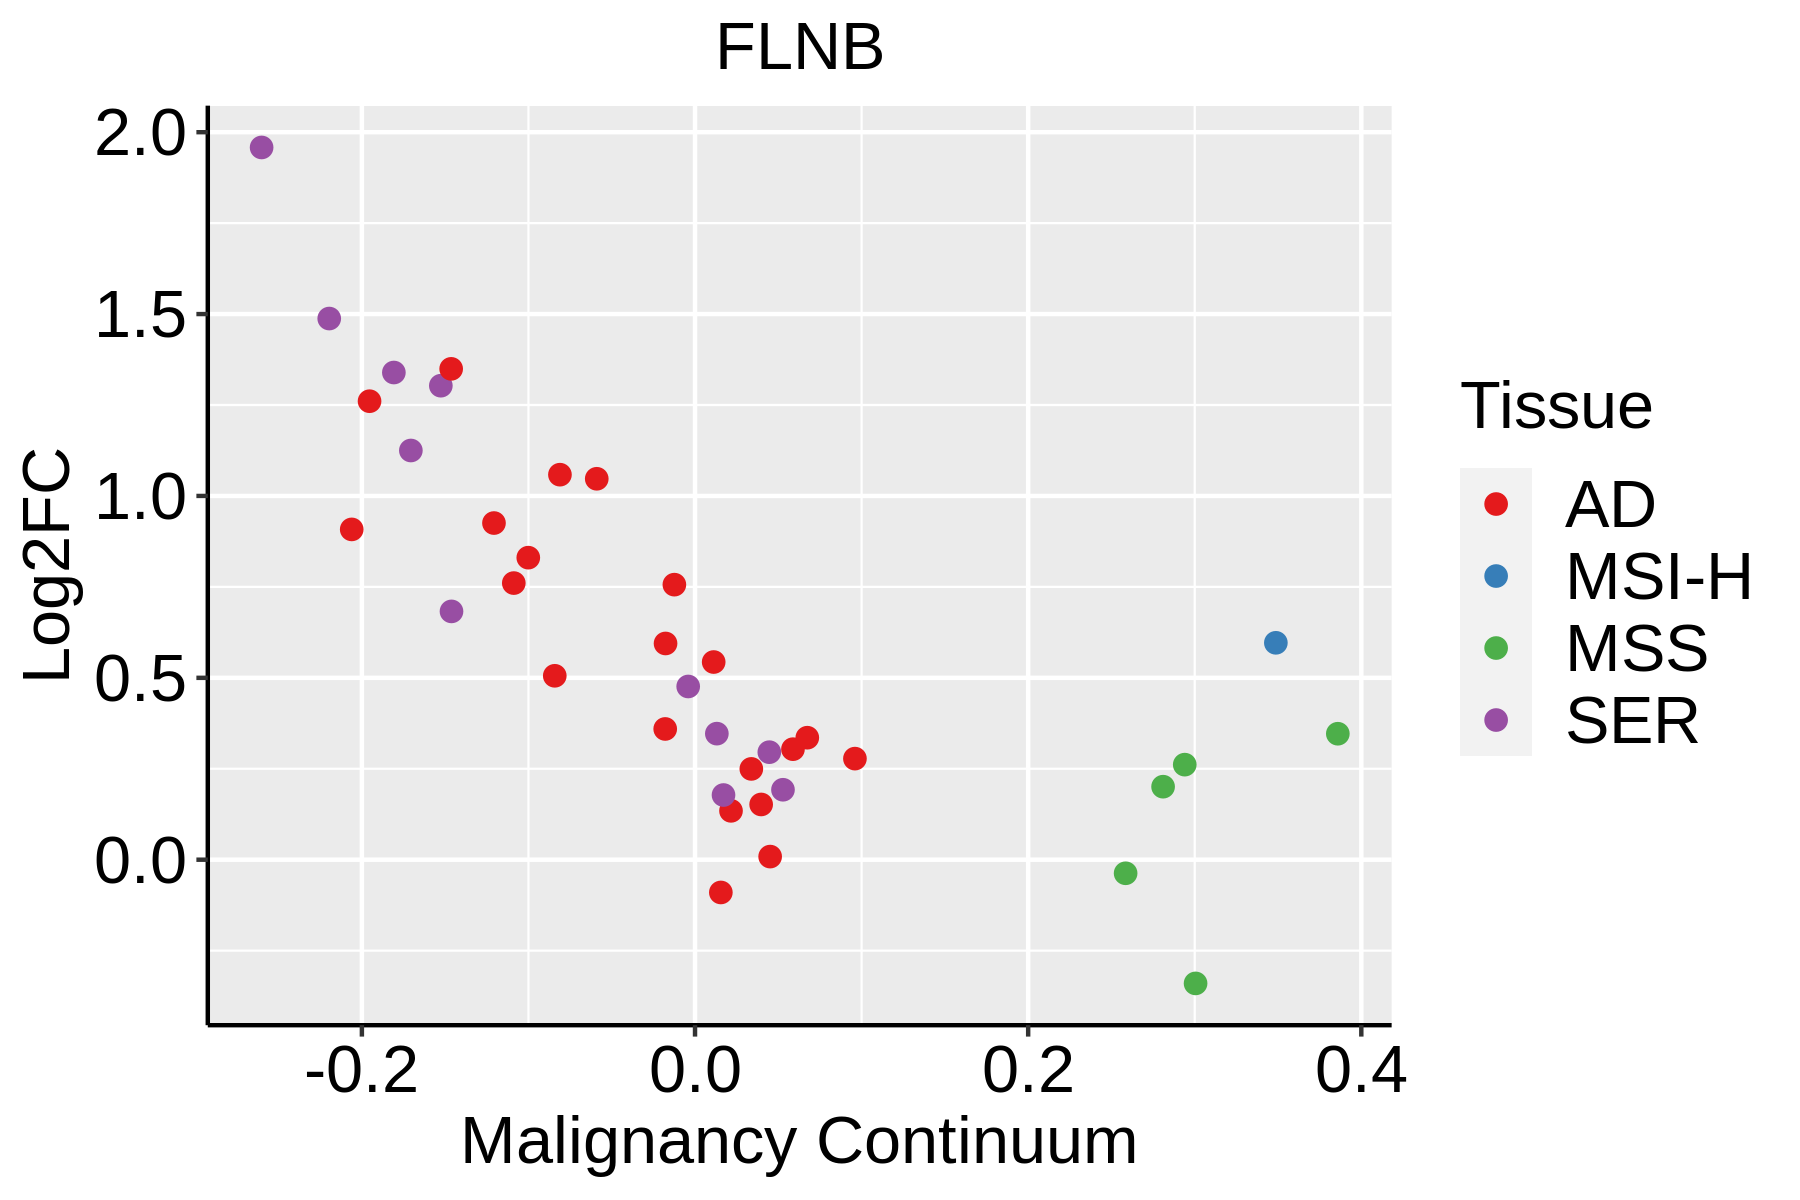 | AD: Adenomas |
| SER: Sessile serrated lesions | ||
| MSI-H: Microsatellite-high colorectal cancer | ||
| MSS: Microsatellite stable colorectal cancer | ||
| Endometrium | 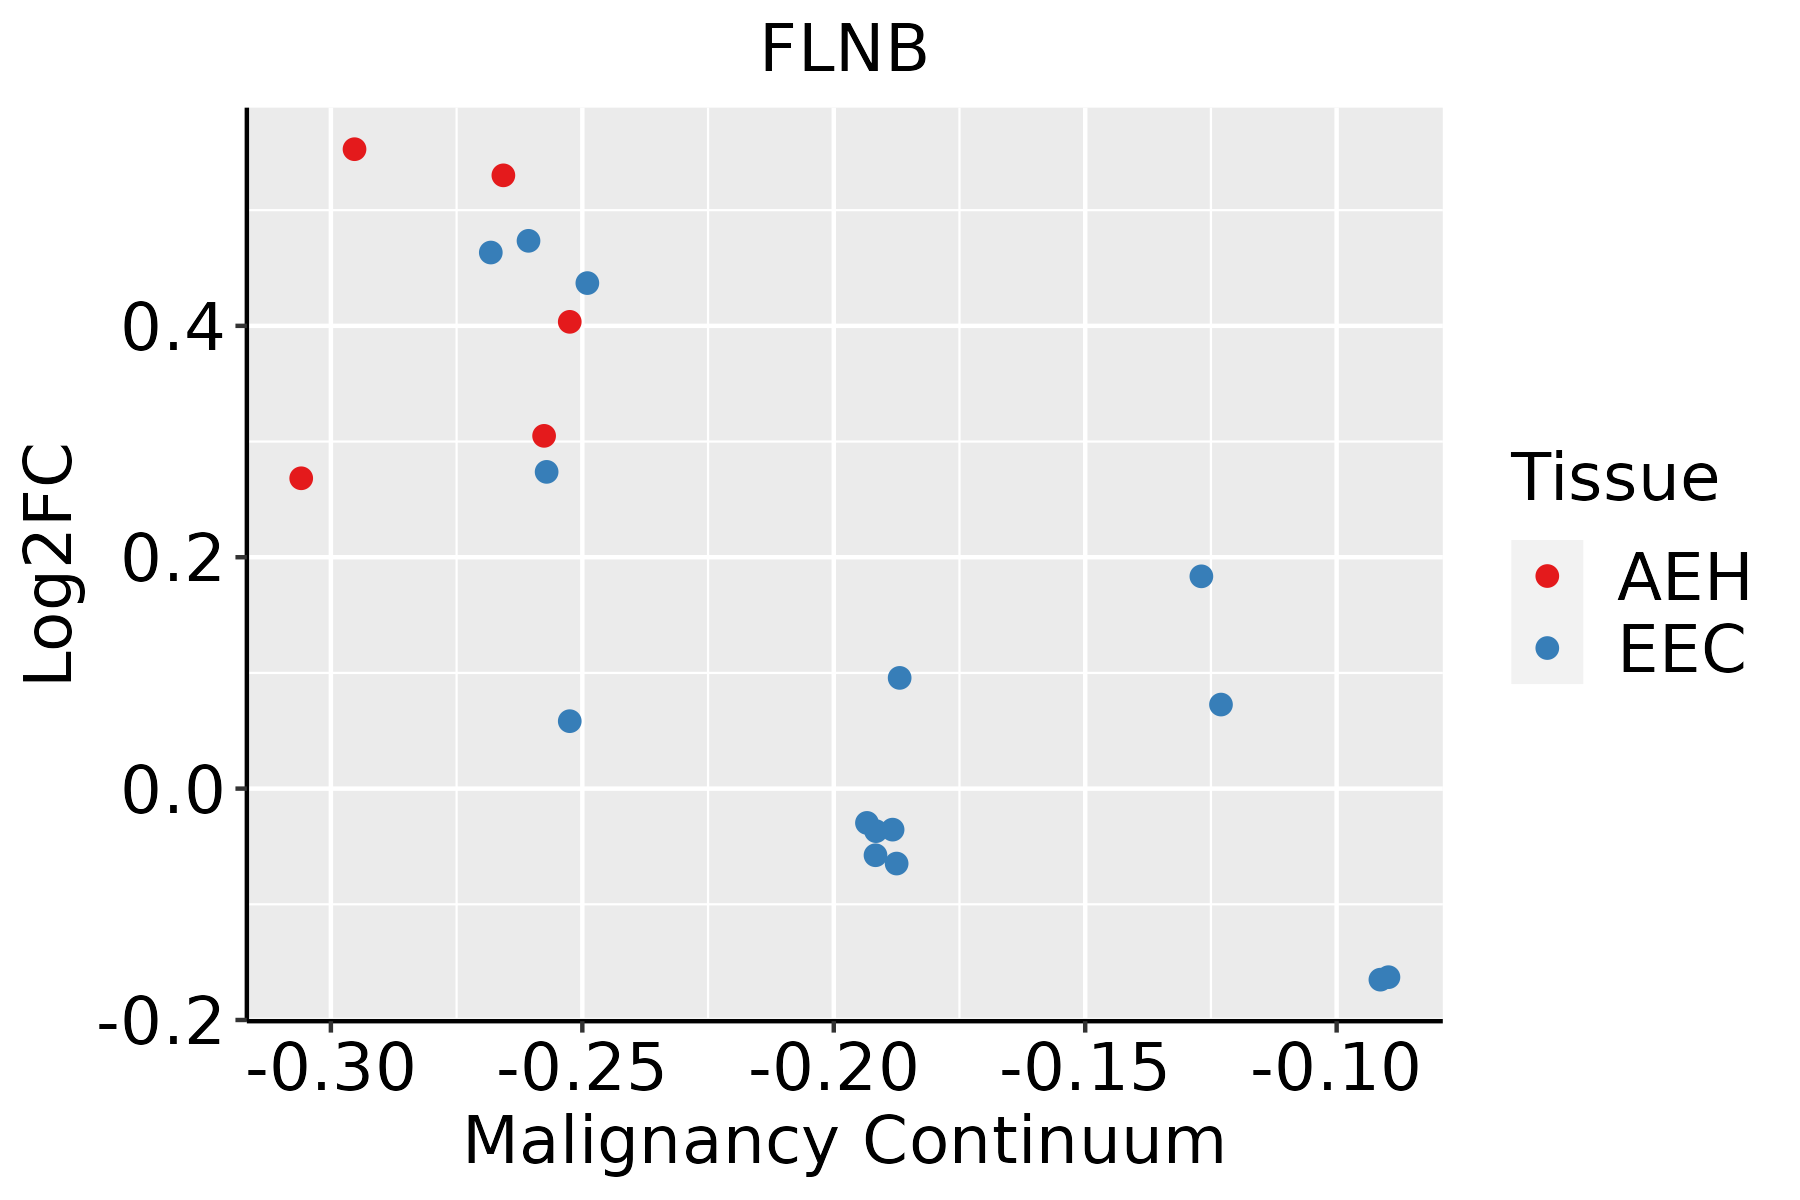 | AEH: Atypical endometrial hyperplasia |
| EEC: Endometrioid Cancer | ||
| Esophagus | 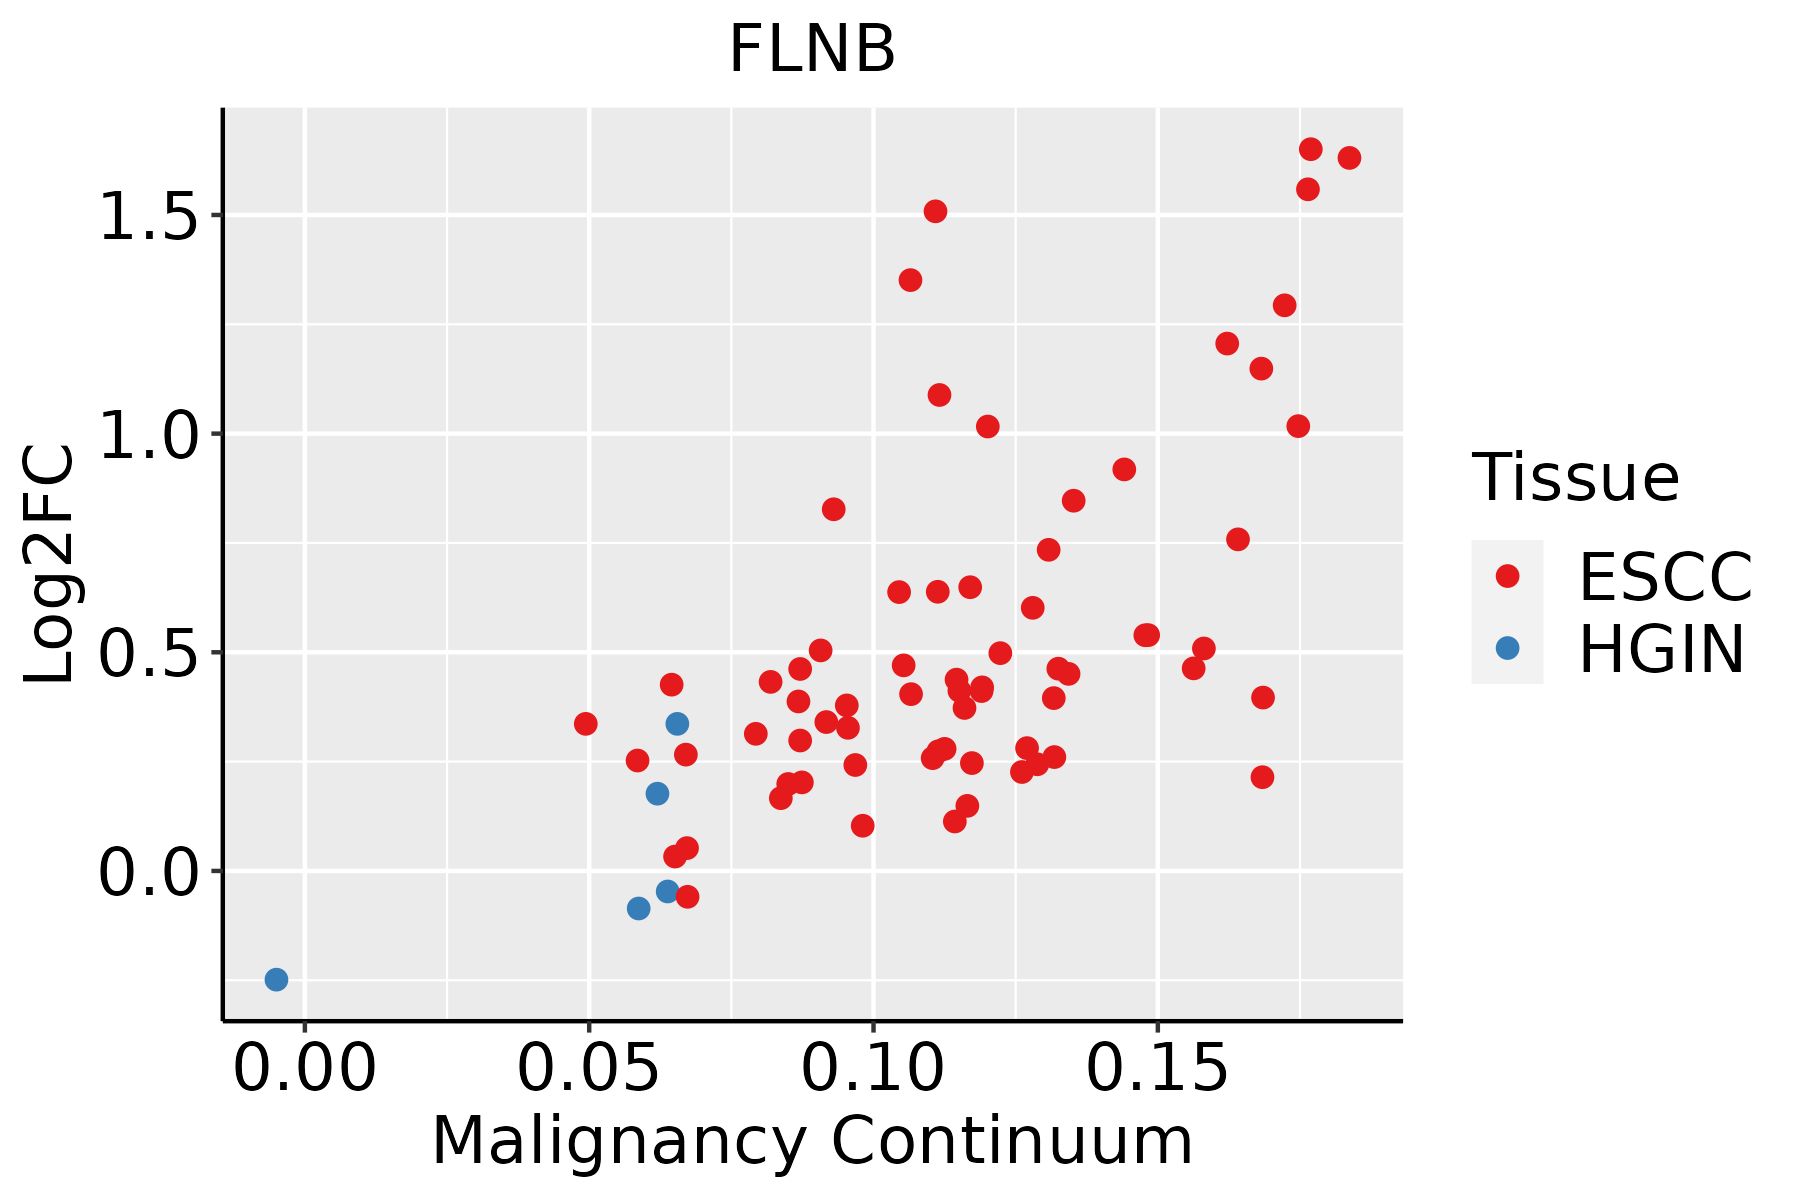 | ESCC: Esophageal squamous cell carcinoma |
| HGIN: High-grade intraepithelial neoplasias | ||
| LGIN: Low-grade intraepithelial neoplasias | ||
| GC | 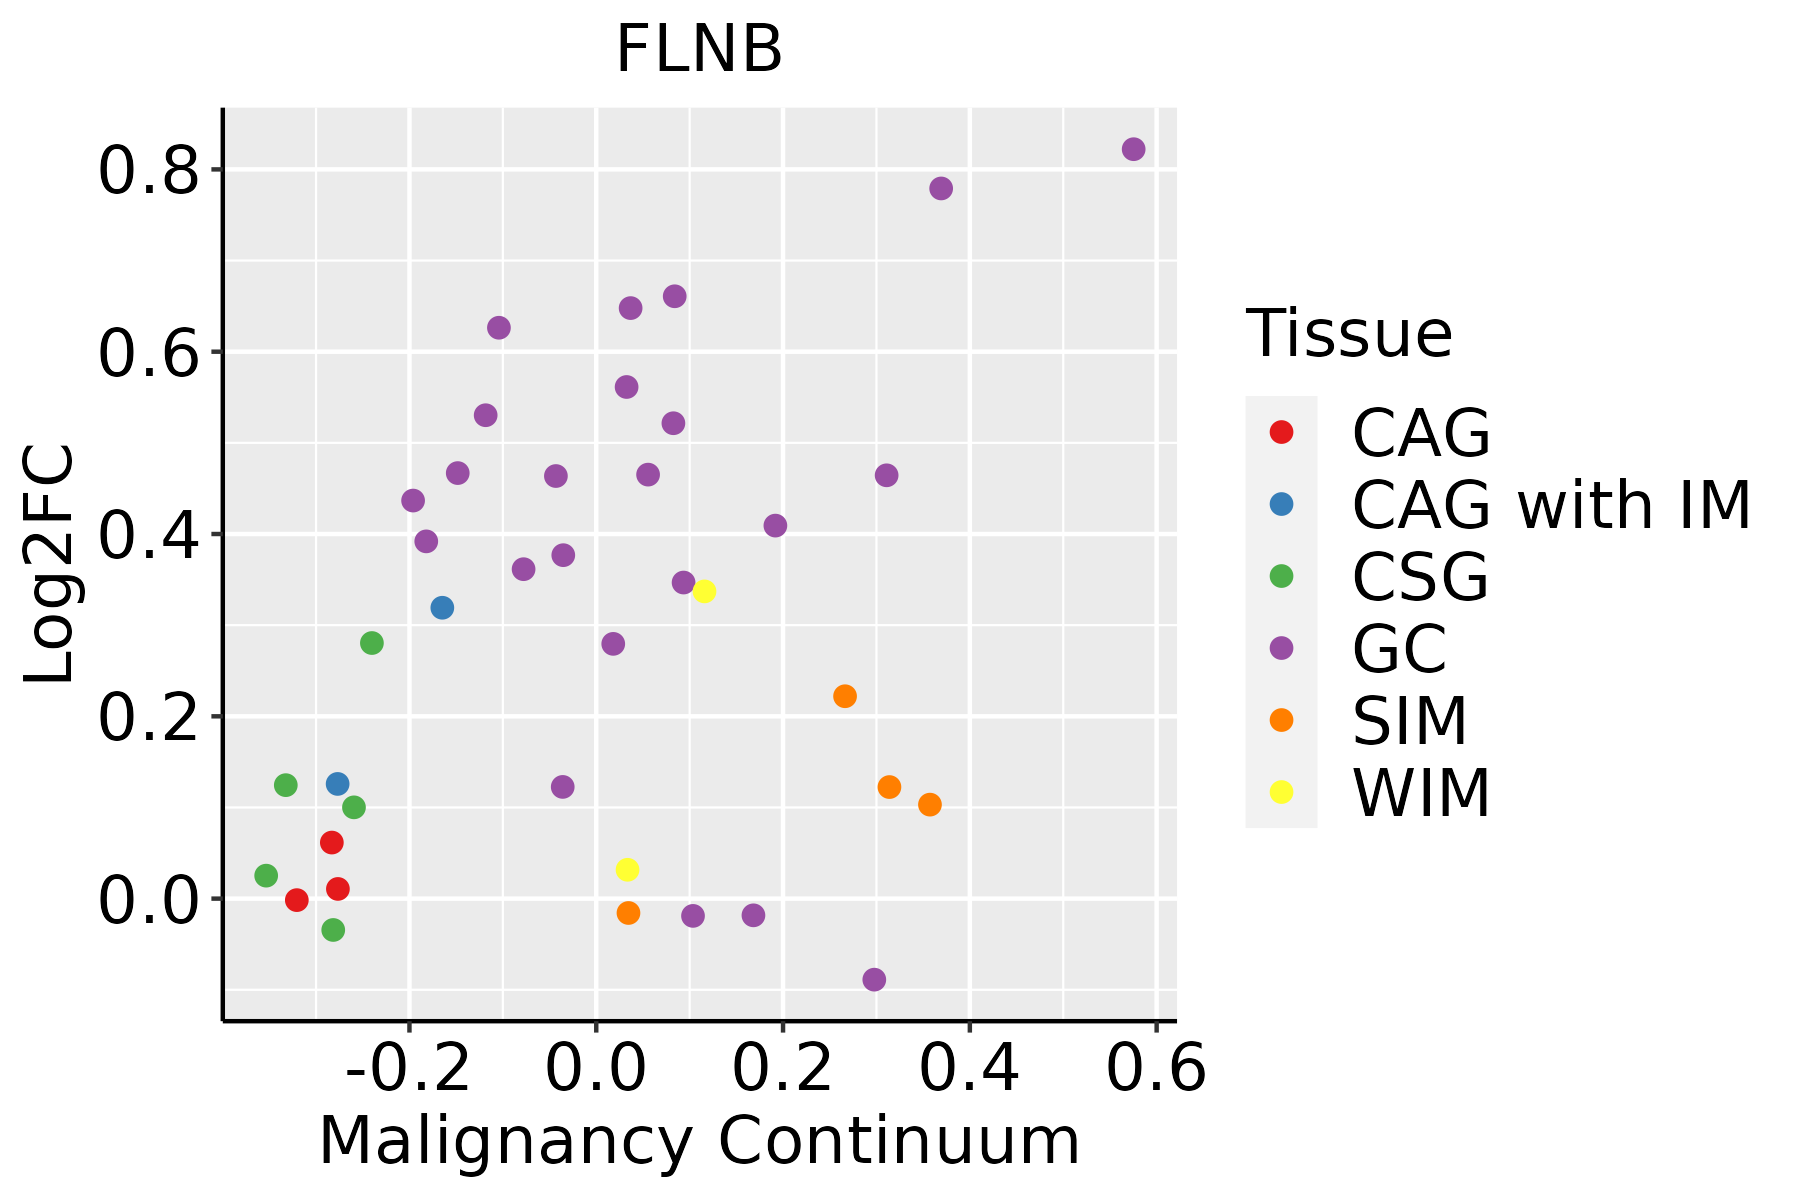 | CAG: Chronic atrophic gastritis |
| CAG with IM: Chronic atrophic gastritis with intestinal metaplasia | ||
| CSG: Chronic superficial gastritis | ||
| GC: Gastric cancer | ||
| SIM: Severe intestinal metaplasia | ||
| WIM: Wild intestinal metaplasia | ||
| Liver | 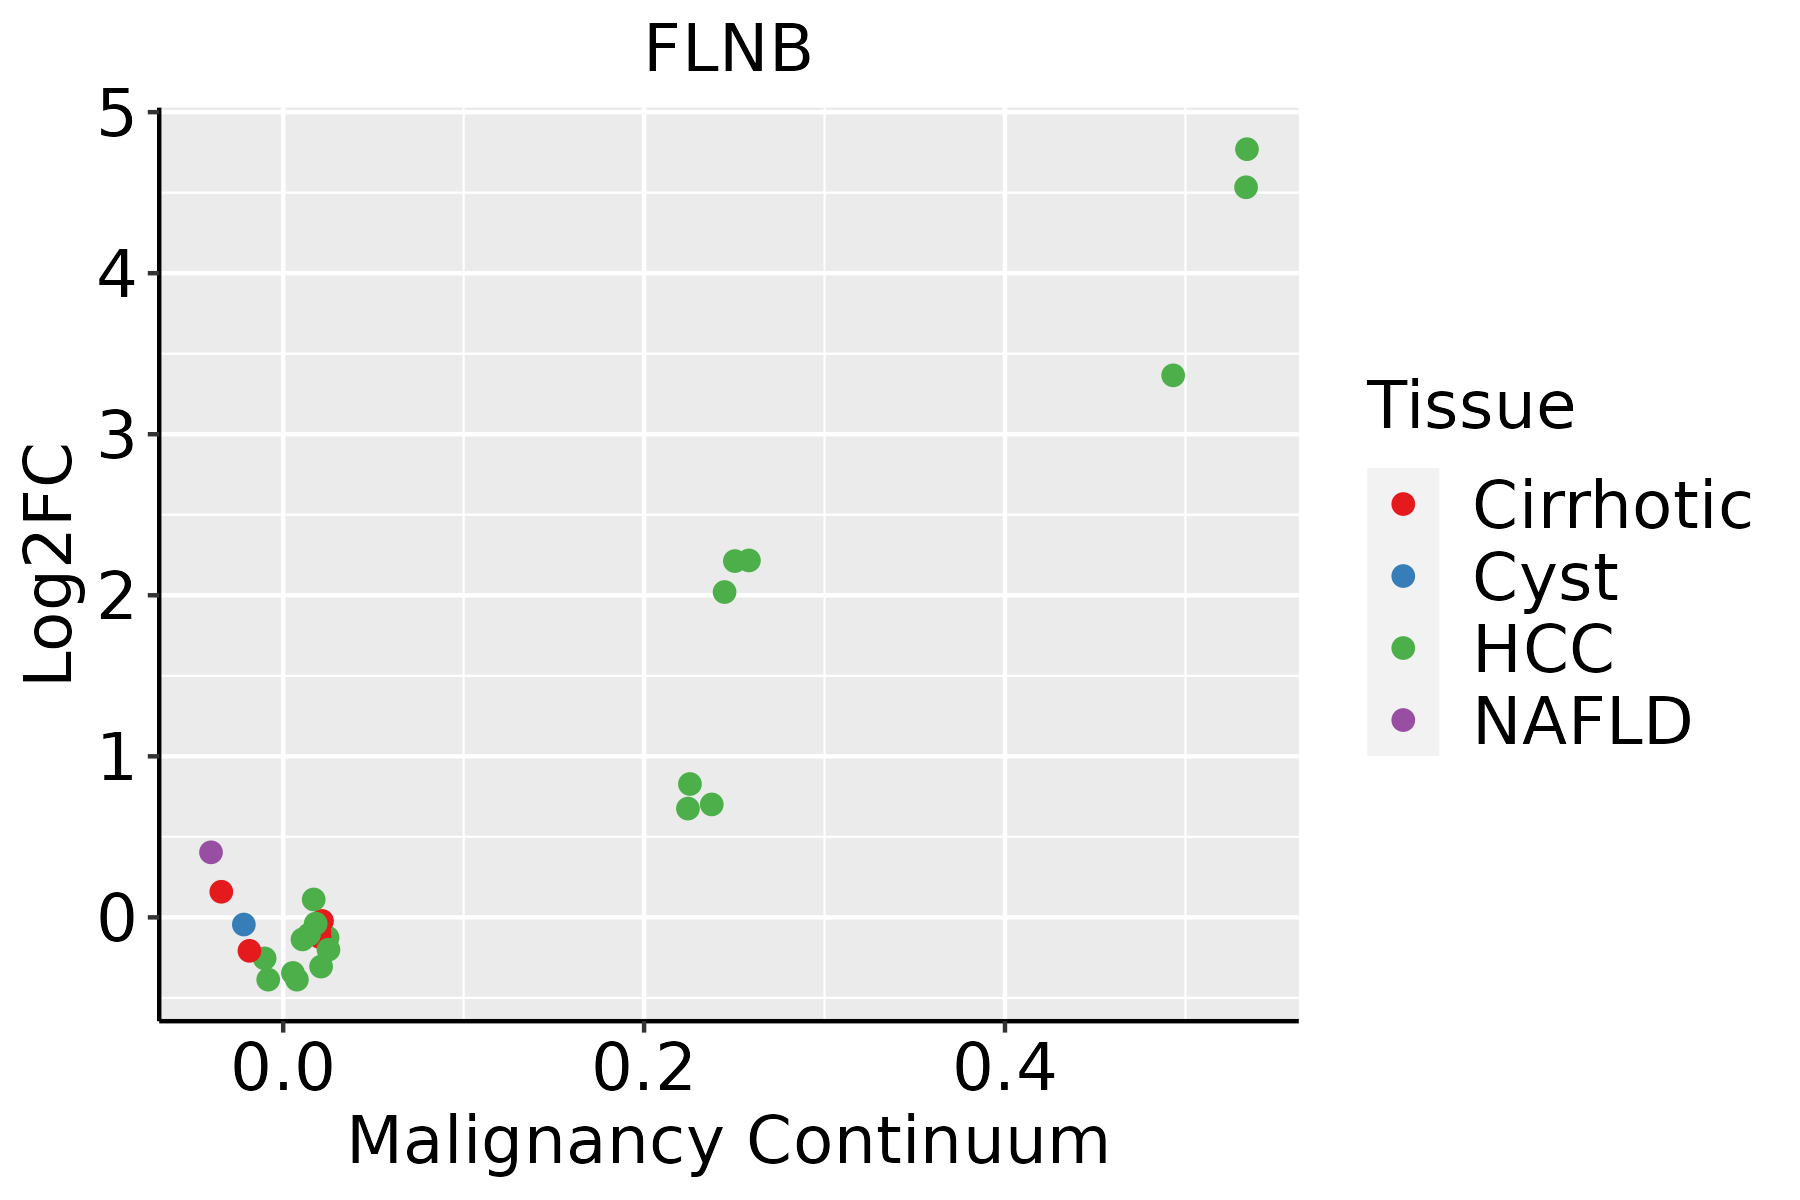 | HCC: Hepatocellular carcinoma |
| NAFLD: Non-alcoholic fatty liver disease | ||
| Lung | 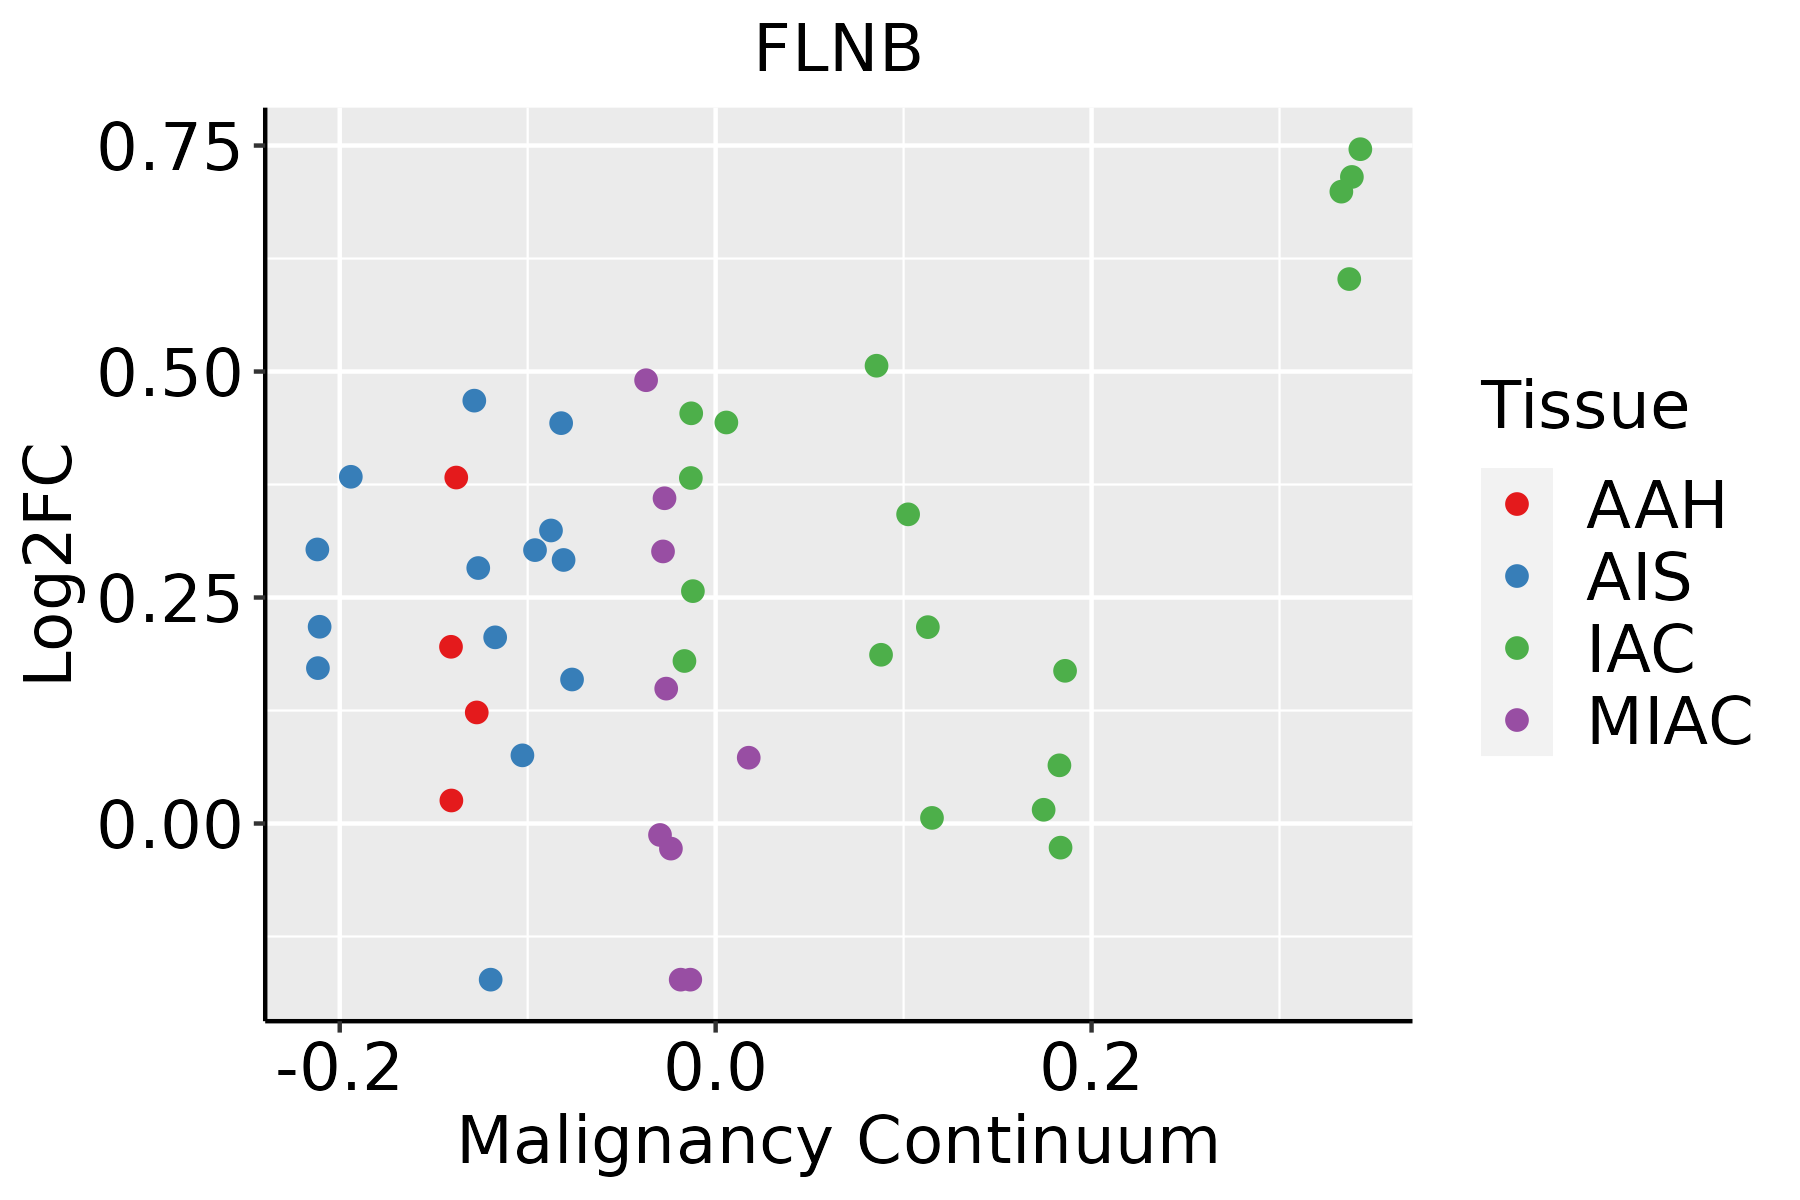 | AAH: Atypical adenomatous hyperplasia |
| AIS: Adenocarcinoma in situ | ||
| IAC: Invasive lung adenocarcinoma | ||
| MIA: Minimally invasive adenocarcinoma | ||
| Oral Cavity | 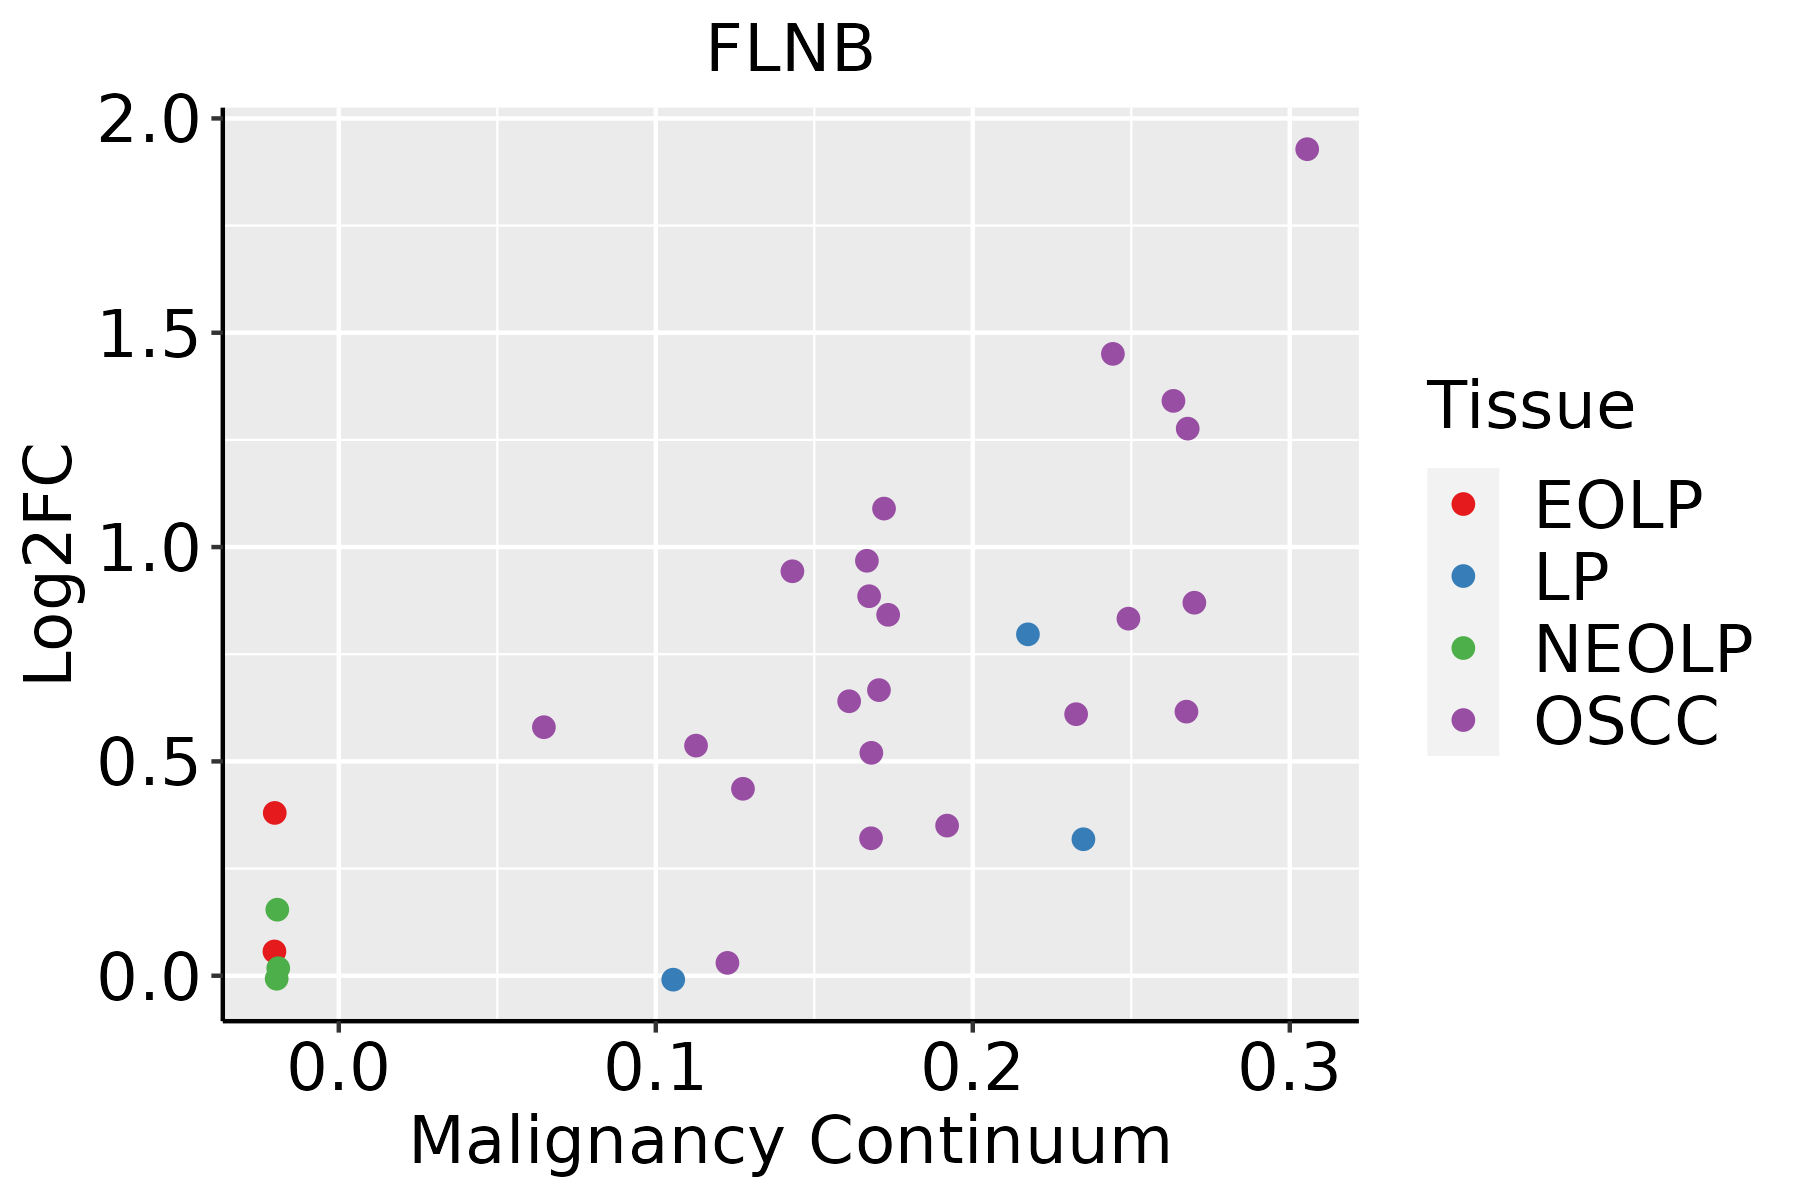 | EOLP: Erosive Oral lichen planus |
| LP: leukoplakia | ||
| NEOLP: Non-erosive oral lichen planus | ||
| OSCC: Oral squamous cell carcinoma | ||
| Prostate |  | BPH: Benign Prostatic Hyperplasia |
| Skin | 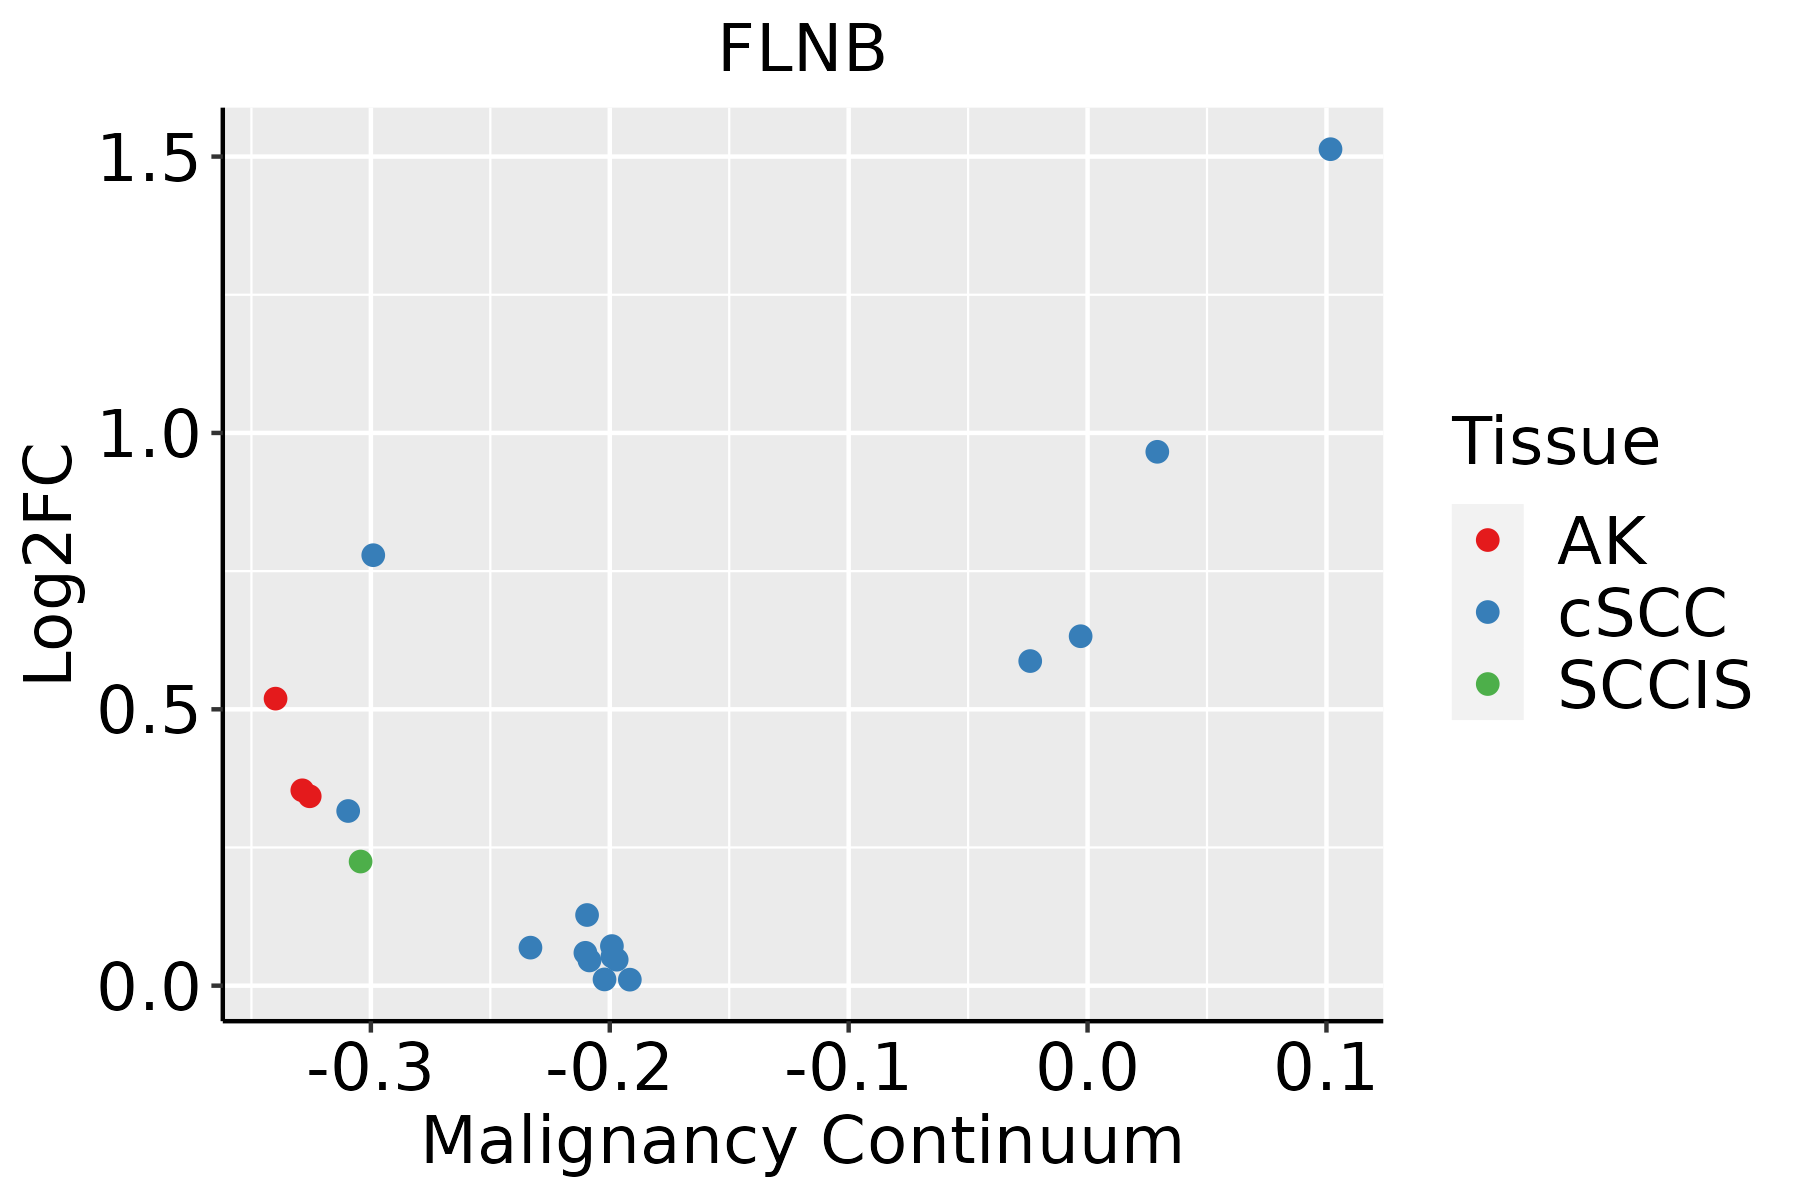 | AK: Actinic keratosis |
| cSCC: Cutaneous squamous cell carcinoma | ||
| SCCIS:squamous cell carcinoma in situ | ||
| Thyroid | 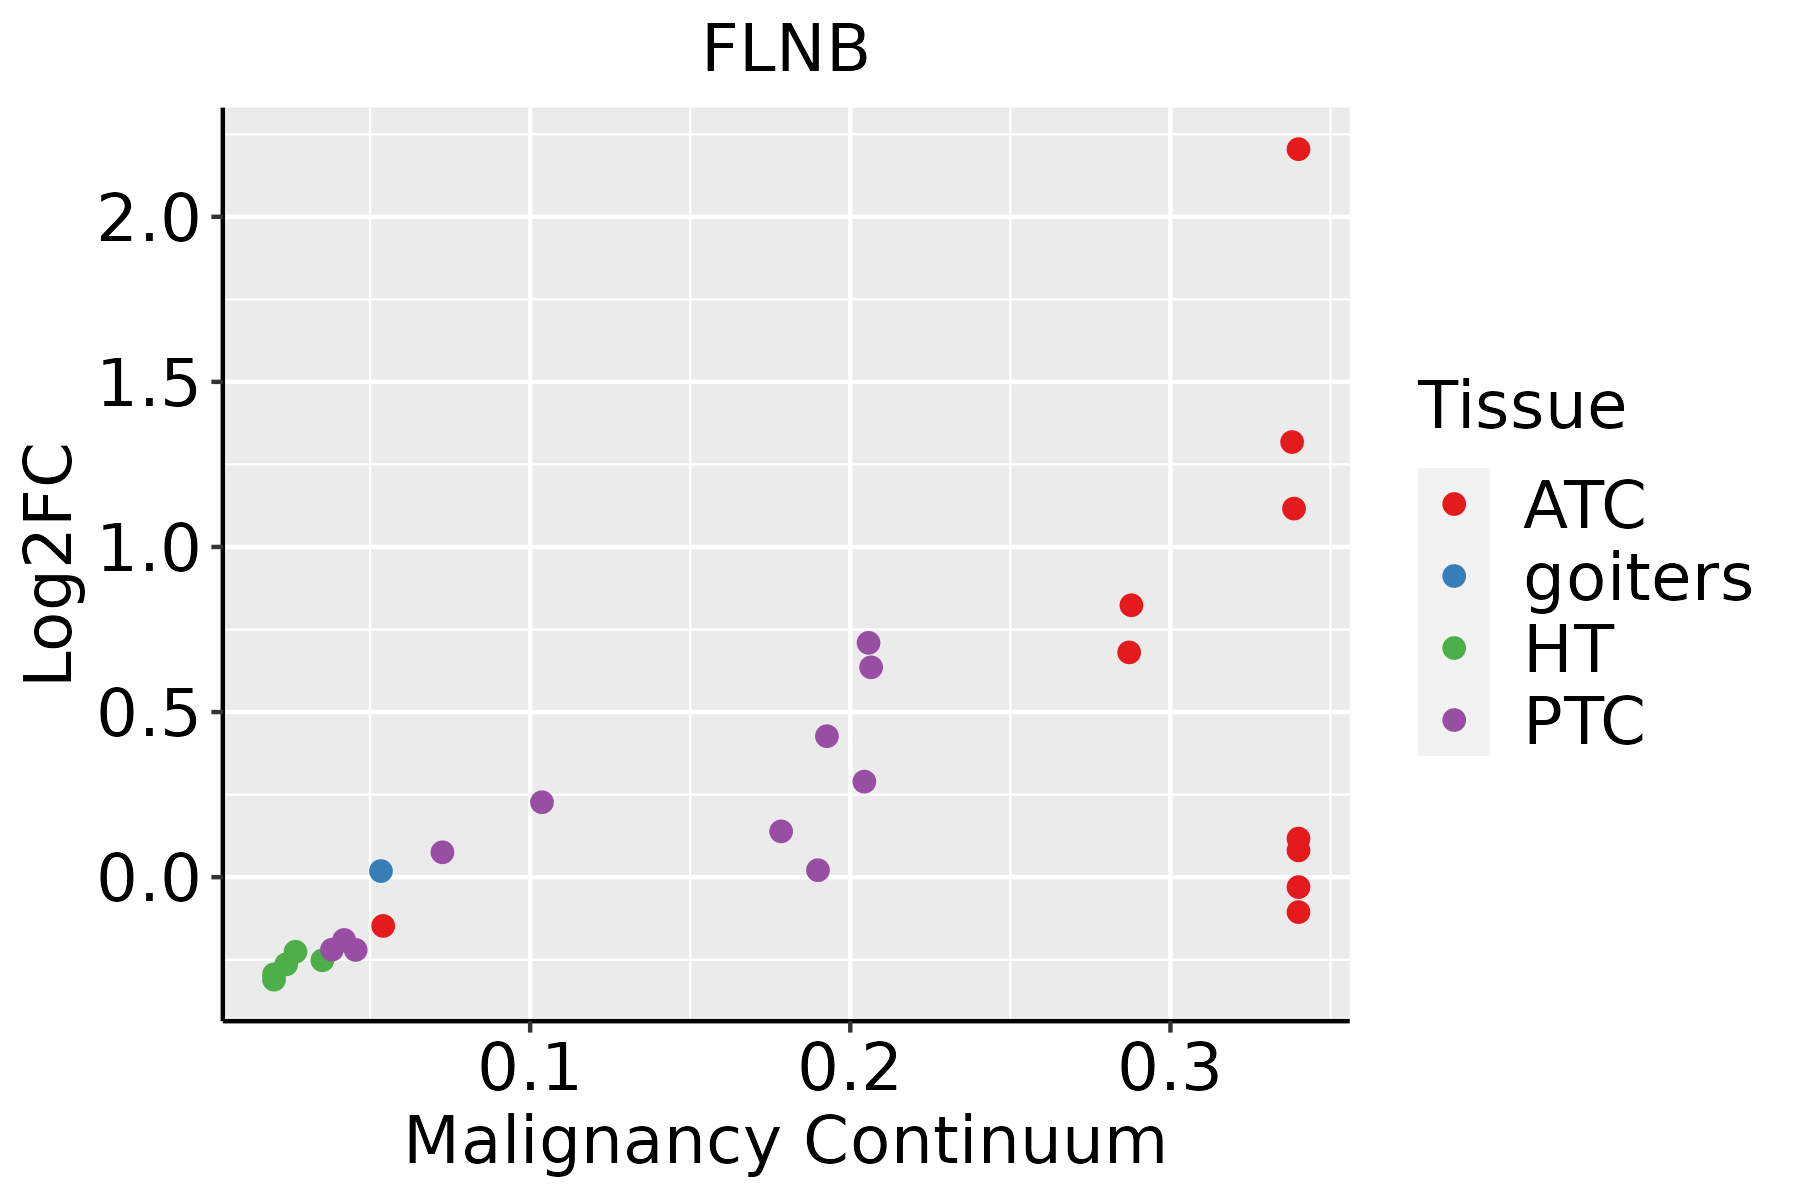 | ATC: Anaplastic thyroid cancer |
| HT: Hashimoto's thyroiditis | ||
| PTC: Papillary thyroid cancer |
| ∗log2FC in expression of this searched gene in stem-like cells from each diseased tissue sample relative to stem-like cells in normal samples in each tissue plotted against the malignancy continuum. Samples are colored based on if they are from different disease stage. |
Top |
Malignant transformation related pathway analysis |
| Find out the enriched GO biological processes and KEGG pathways involved in transition from healthy to precancer to cancer |
| Tissue | Disease Stage | Enriched GO biological Processes |
| Colorectum | AD |  |
| Colorectum | SER |  |
| Colorectum | MSS |  |
| Colorectum | MSI-H |  |
| Colorectum | FAP |  |
| ∗Top 15 enriched GO BP terms are showed in the bar plot of each disease state in each tissue. Each row represents a significant GO biological process which is colored according to the -log10(p.adjust). |
| Page: 1 2 3 4 5 6 7 8 9 |
| GO ID | Tissue | Disease Stage | Description | Gene Ratio | Bg Ratio | pvalue | p.adjust | Count |
| GO:0003382 | Stomach | GC | epithelial cell morphogenesis | 8/1159 | 33/18723 | 7.27e-04 | 9.50e-03 | 8 |
| GO:00085443 | Stomach | GC | epidermis development | 33/1159 | 324/18723 | 3.43e-03 | 2.96e-02 | 33 |
| GO:00099134 | Stomach | GC | epidermal cell differentiation | 23/1159 | 202/18723 | 3.50e-03 | 3.02e-02 | 23 |
| GO:000206411 | Stomach | CAG with IM | epithelial cell development | 29/1050 | 220/18723 | 1.64e-05 | 5.16e-04 | 29 |
| GO:00033821 | Stomach | CAG with IM | epithelial cell morphogenesis | 7/1050 | 33/18723 | 2.02e-03 | 2.10e-02 | 7 |
| GO:000991311 | Stomach | CAG with IM | epidermal cell differentiation | 22/1050 | 202/18723 | 2.23e-03 | 2.25e-02 | 22 |
| GO:000854411 | Stomach | CAG with IM | epidermis development | 31/1050 | 324/18723 | 2.66e-03 | 2.58e-02 | 31 |
| GO:000206421 | Stomach | CSG | epithelial cell development | 28/1034 | 220/18723 | 3.30e-05 | 9.05e-04 | 28 |
| GO:00033822 | Stomach | CSG | epithelial cell morphogenesis | 7/1034 | 33/18723 | 1.85e-03 | 1.97e-02 | 7 |
| GO:000854421 | Stomach | CSG | epidermis development | 30/1034 | 324/18723 | 3.99e-03 | 3.47e-02 | 30 |
| GO:000991321 | Stomach | CSG | epidermal cell differentiation | 21/1034 | 202/18723 | 4.02e-03 | 3.48e-02 | 21 |
| GO:0002064112 | Thyroid | PTC | epithelial cell development | 101/5968 | 220/18723 | 8.53e-06 | 9.74e-05 | 101 |
| GO:006053719 | Thyroid | PTC | muscle tissue development | 156/5968 | 403/18723 | 1.98e-03 | 1.06e-02 | 156 |
| GO:003434110 | Thyroid | PTC | response to interferon-gamma | 59/5968 | 141/18723 | 7.88e-03 | 3.33e-02 | 59 |
| GO:00713468 | Thyroid | PTC | cellular response to interferon-gamma | 50/5968 | 118/18723 | 1.04e-02 | 4.19e-02 | 50 |
| GO:001470617 | Thyroid | PTC | striated muscle tissue development | 144/5968 | 384/18723 | 1.05e-02 | 4.22e-02 | 144 |
| GO:006053724 | Thyroid | ATC | muscle tissue development | 181/6293 | 403/18723 | 1.27e-06 | 1.62e-05 | 181 |
| GO:001470622 | Thyroid | ATC | striated muscle tissue development | 168/6293 | 384/18723 | 1.91e-05 | 1.73e-04 | 168 |
| GO:000206428 | Thyroid | ATC | epithelial cell development | 103/6293 | 220/18723 | 3.06e-05 | 2.55e-04 | 103 |
| GO:000751716 | Thyroid | ATC | muscle organ development | 139/6293 | 327/18723 | 4.45e-04 | 2.64e-03 | 139 |
| Page: 1 2 3 4 5 6 7 8 9 10 |
| Pathway ID | Tissue | Disease Stage | Description | Gene Ratio | Bg Ratio | pvalue | p.adjust | qvalue | Count |
| hsa0513218 | Breast | Precancer | Salmonella infection | 49/684 | 249/8465 | 2.92e-09 | 6.15e-08 | 4.71e-08 | 49 |
| hsa0520514 | Breast | Precancer | Proteoglycans in cancer | 30/684 | 205/8465 | 1.00e-03 | 7.18e-03 | 5.50e-03 | 30 |
| hsa0513219 | Breast | Precancer | Salmonella infection | 49/684 | 249/8465 | 2.92e-09 | 6.15e-08 | 4.71e-08 | 49 |
| hsa0520515 | Breast | Precancer | Proteoglycans in cancer | 30/684 | 205/8465 | 1.00e-03 | 7.18e-03 | 5.50e-03 | 30 |
| hsa0513224 | Breast | IDC | Salmonella infection | 55/867 | 249/8465 | 2.07e-08 | 4.49e-07 | 3.36e-07 | 55 |
| hsa0520523 | Breast | IDC | Proteoglycans in cancer | 42/867 | 205/8465 | 7.69e-06 | 9.99e-05 | 7.48e-05 | 42 |
| hsa045109 | Breast | IDC | Focal adhesion | 32/867 | 203/8465 | 8.60e-03 | 4.23e-02 | 3.17e-02 | 32 |
| hsa0513234 | Breast | IDC | Salmonella infection | 55/867 | 249/8465 | 2.07e-08 | 4.49e-07 | 3.36e-07 | 55 |
| hsa0520533 | Breast | IDC | Proteoglycans in cancer | 42/867 | 205/8465 | 7.69e-06 | 9.99e-05 | 7.48e-05 | 42 |
| hsa0451013 | Breast | IDC | Focal adhesion | 32/867 | 203/8465 | 8.60e-03 | 4.23e-02 | 3.17e-02 | 32 |
| hsa0513243 | Breast | DCIS | Salmonella infection | 55/846 | 249/8465 | 8.71e-09 | 1.87e-07 | 1.38e-07 | 55 |
| hsa0520542 | Breast | DCIS | Proteoglycans in cancer | 39/846 | 205/8465 | 5.36e-05 | 5.58e-04 | 4.11e-04 | 39 |
| hsa0513253 | Breast | DCIS | Salmonella infection | 55/846 | 249/8465 | 8.71e-09 | 1.87e-07 | 1.38e-07 | 55 |
| hsa0520552 | Breast | DCIS | Proteoglycans in cancer | 39/846 | 205/8465 | 5.36e-05 | 5.58e-04 | 4.11e-04 | 39 |
| hsa0513220 | Cervix | CC | Salmonella infection | 74/1267 | 249/8465 | 1.33e-09 | 2.54e-08 | 1.50e-08 | 74 |
| hsa0520516 | Cervix | CC | Proteoglycans in cancer | 60/1267 | 205/8465 | 9.13e-08 | 1.18e-06 | 7.00e-07 | 60 |
| hsa0451010 | Cervix | CC | Focal adhesion | 59/1267 | 203/8465 | 1.53e-07 | 1.84e-06 | 1.09e-06 | 59 |
| hsa040109 | Cervix | CC | MAPK signaling pathway | 62/1267 | 302/8465 | 4.89e-03 | 1.67e-02 | 9.86e-03 | 62 |
| hsa05132110 | Cervix | CC | Salmonella infection | 74/1267 | 249/8465 | 1.33e-09 | 2.54e-08 | 1.50e-08 | 74 |
| hsa0520517 | Cervix | CC | Proteoglycans in cancer | 60/1267 | 205/8465 | 9.13e-08 | 1.18e-06 | 7.00e-07 | 60 |
| Page: 1 2 3 4 5 6 7 |
Top |
Cell-cell communication analysis |
| Identification of potential cell-cell interactions between two cell types and their ligand-receptor pairs for different disease states |
| Ligand | Receptor | LRpair | Pathway | Tissue | Disease Stage |
| Page: 1 |
Top |
Single-cell gene regulatory network inference analysis |
| Find out the significant the regulons (TFs) and the target genes of each regulon across cell types for different disease states |
| TF | Cell Type | Tissue | Disease Stage | Target Gene | RSS | Regulon Activity |
| ∗The dot plots of a searched regulon are shown for all cell subpopulations in each disease state of each tissue based on the regulon specific score inferred using pySCENIC and by calculating the average expression. |
| Page: 1 |
Top |
Somatic mutation of malignant transformation related genes |
| Annotation of somatic variants for genes involved in malignant transformation |
| Hugo Symbol | Variant Class | Variant Classification | dbSNP RS | HGVSc | HGVSp | HGVSp Short | SWISSPROT | BIOTYPE | SIFT | PolyPhen | Tumor Sample Barcode | Tissue | Histology | Sex | Age | Stage | Therapy Types | Drugs | Outcome |
| FLNB | SNV | Missense_Mutation | novel | c.1132G>A | p.Asp378Asn | p.D378N | O75369 | protein_coding | deleterious(0.03) | probably_damaging(0.924) | TCGA-5L-AAT1-01 | Breast | breast invasive carcinoma | Female | <65 | III/IV | Hormone Therapy | letrozol | SD |
| FLNB | SNV | Missense_Mutation | novel | c.1797N>T | p.Gln599His | p.Q599H | O75369 | protein_coding | deleterious(0.01) | possibly_damaging(0.726) | TCGA-A2-A25A-01 | Breast | breast invasive carcinoma | Female | <65 | I/II | Unspecific | Cytoxan | SD |
| FLNB | SNV | Missense_Mutation | c.1202N>A | p.Thr401Asn | p.T401N | O75369 | protein_coding | deleterious(0.02) | benign(0.03) | TCGA-A7-A26J-01 | Breast | breast invasive carcinoma | Female | <65 | I/II | Hormone Therapy | tamoxiphen | SD | |
| FLNB | SNV | Missense_Mutation | rs144158201 | c.2035N>T | p.Pro679Ser | p.P679S | O75369 | protein_coding | tolerated(0.15) | benign(0.314) | TCGA-A8-A08F-01 | Breast | breast invasive carcinoma | Female | <65 | III/IV | Chemotherapy | 5-fluorouracil | CR |
| FLNB | SNV | Missense_Mutation | rs768998920 | c.163N>C | p.Glu55Gln | p.E55Q | O75369 | protein_coding | deleterious(0) | probably_damaging(0.98) | TCGA-AC-A23H-01 | Breast | breast invasive carcinoma | Female | >=65 | I/II | Unknown | Unknown | PD |
| FLNB | SNV | Missense_Mutation | c.2166G>C | p.Trp722Cys | p.W722C | O75369 | protein_coding | tolerated(0.1) | probably_damaging(0.997) | TCGA-AR-A0TS-01 | Breast | breast invasive carcinoma | Female | <65 | I/II | Chemotherapy | doxorubicin | SD | |
| FLNB | SNV | Missense_Mutation | rs80356520 | c.4912C>G | p.Arg1638Gly | p.R1638G | O75369 | protein_coding | deleterious(0.02) | possibly_damaging(0.726) | TCGA-AR-A1AP-01 | Breast | breast invasive carcinoma | Female | >=65 | I/II | Hormone Therapy | anastrozole | SD |
| FLNB | SNV | Missense_Mutation | novel | c.6208N>T | p.Val2070Leu | p.V2070L | O75369 | protein_coding | deleterious(0.01) | possibly_damaging(0.626) | TCGA-AR-A24M-01 | Breast | breast invasive carcinoma | Female | <65 | III/IV | Hormone Therapy | tamoxiphen | SD |
| FLNB | SNV | Missense_Mutation | novel | c.3056N>T | p.Thr1019Ile | p.T1019I | O75369 | protein_coding | deleterious(0.02) | possibly_damaging(0.673) | TCGA-BH-A0HF-01 | Breast | breast invasive carcinoma | Female | >=65 | I/II | Hormone Therapy | arimidex | SD |
| FLNB | SNV | Missense_Mutation | rs142229998 | c.7462N>A | p.Gly2488Ser | p.G2488S | O75369 | protein_coding | deleterious(0.02) | probably_damaging(0.926) | TCGA-BH-A208-01 | Breast | breast invasive carcinoma | Female | <65 | I/II | Unknown | Unknown | SD |
| Page: 1 2 3 4 5 6 7 8 9 10 11 12 13 14 15 16 17 18 19 20 21 22 23 24 25 26 27 28 |
Top |
Related drugs of malignant transformation related genes |
| Identification of chemicals and drugs interact with genes involved in malignant transfromation |
| (DGIdb 4.0) |
| Entrez ID | Symbol | Category | Interaction Types | Drug Claim Name | Drug Name | PMIDs |
| Page: 1 |

Copyright 2023-Present -The University of Texas Health Science Center at Houston |