
|
|||||
|
 | |
| |
| |
| |
| |
| |
|
Gene: FLCN |
Gene summary for FLCN |
| Gene information | Species | Human | Gene symbol | FLCN | Gene ID | 201163 |
| Gene name | folliculin | |
| Gene Alias | BHD | |
| Cytomap | 17p11.2 | |
| Gene Type | protein-coding | GO ID | GO:0000122 | UniProtAcc | A0A0S2Z5Y7 |
Top |
Malignant transformation analysis |
| Identification of the aberrant gene expression in precancerous and cancerous lesions by comparing the gene expression of stem-like cells in diseased tissues with normal stem cells |
| Entrez ID | Symbol | Replicates | Species | Organ | Tissue | Adj P-value | Log2FC | Malignancy |
| 201163 | FLCN | C21 | Human | Oral cavity | OSCC | 1.86e-05 | 2.18e-01 | 0.2678 |
| 201163 | FLCN | C30 | Human | Oral cavity | OSCC | 1.30e-09 | 5.39e-01 | 0.3055 |
| 201163 | FLCN | C43 | Human | Oral cavity | OSCC | 3.48e-02 | 1.22e-02 | 0.1704 |
| 201163 | FLCN | C06 | Human | Oral cavity | OSCC | 1.17e-05 | 5.97e-01 | 0.2699 |
| 201163 | FLCN | C07 | Human | Oral cavity | OSCC | 1.58e-02 | 4.42e-01 | 0.2491 |
| 201163 | FLCN | C08 | Human | Oral cavity | OSCC | 1.80e-11 | 2.01e-01 | 0.1919 |
| 201163 | FLCN | SYSMH1 | Human | Oral cavity | OSCC | 1.52e-09 | 2.54e-01 | 0.1127 |
| 201163 | FLCN | SYSMH2 | Human | Oral cavity | OSCC | 1.16e-04 | 1.12e-01 | 0.2326 |
| 201163 | FLCN | SYSMH3 | Human | Oral cavity | OSCC | 2.21e-12 | 3.73e-01 | 0.2442 |
| 201163 | FLCN | SYSMH5 | Human | Oral cavity | OSCC | 7.05e-04 | 2.60e-02 | 0.0647 |
| 201163 | FLCN | SYSMH6 | Human | Oral cavity | OSCC | 1.00e-02 | 4.24e-02 | 0.1275 |
| 201163 | FLCN | male-WTA | Human | Thyroid | PTC | 3.84e-12 | 1.12e-01 | 0.1037 |
| 201163 | FLCN | PTC01 | Human | Thyroid | PTC | 1.23e-14 | 2.74e-01 | 0.1899 |
| 201163 | FLCN | PTC03 | Human | Thyroid | PTC | 1.53e-07 | 2.78e-01 | 0.1784 |
| 201163 | FLCN | PTC04 | Human | Thyroid | PTC | 7.83e-38 | 6.37e-01 | 0.1927 |
| 201163 | FLCN | PTC05 | Human | Thyroid | PTC | 2.00e-13 | 6.63e-01 | 0.2065 |
| 201163 | FLCN | PTC06 | Human | Thyroid | PTC | 7.69e-33 | 6.81e-01 | 0.2057 |
| 201163 | FLCN | PTC07 | Human | Thyroid | PTC | 7.67e-17 | 2.86e-01 | 0.2044 |
| 201163 | FLCN | ATC12 | Human | Thyroid | ATC | 1.62e-12 | 2.26e-01 | 0.34 |
| 201163 | FLCN | ATC13 | Human | Thyroid | ATC | 1.79e-20 | 2.23e-01 | 0.34 |
| Page: 1 2 |
| Tissue | Expression Dynamics | Abbreviation |
| Oral Cavity |  | EOLP: Erosive Oral lichen planus |
| LP: leukoplakia | ||
| NEOLP: Non-erosive oral lichen planus | ||
| OSCC: Oral squamous cell carcinoma | ||
| Thyroid | 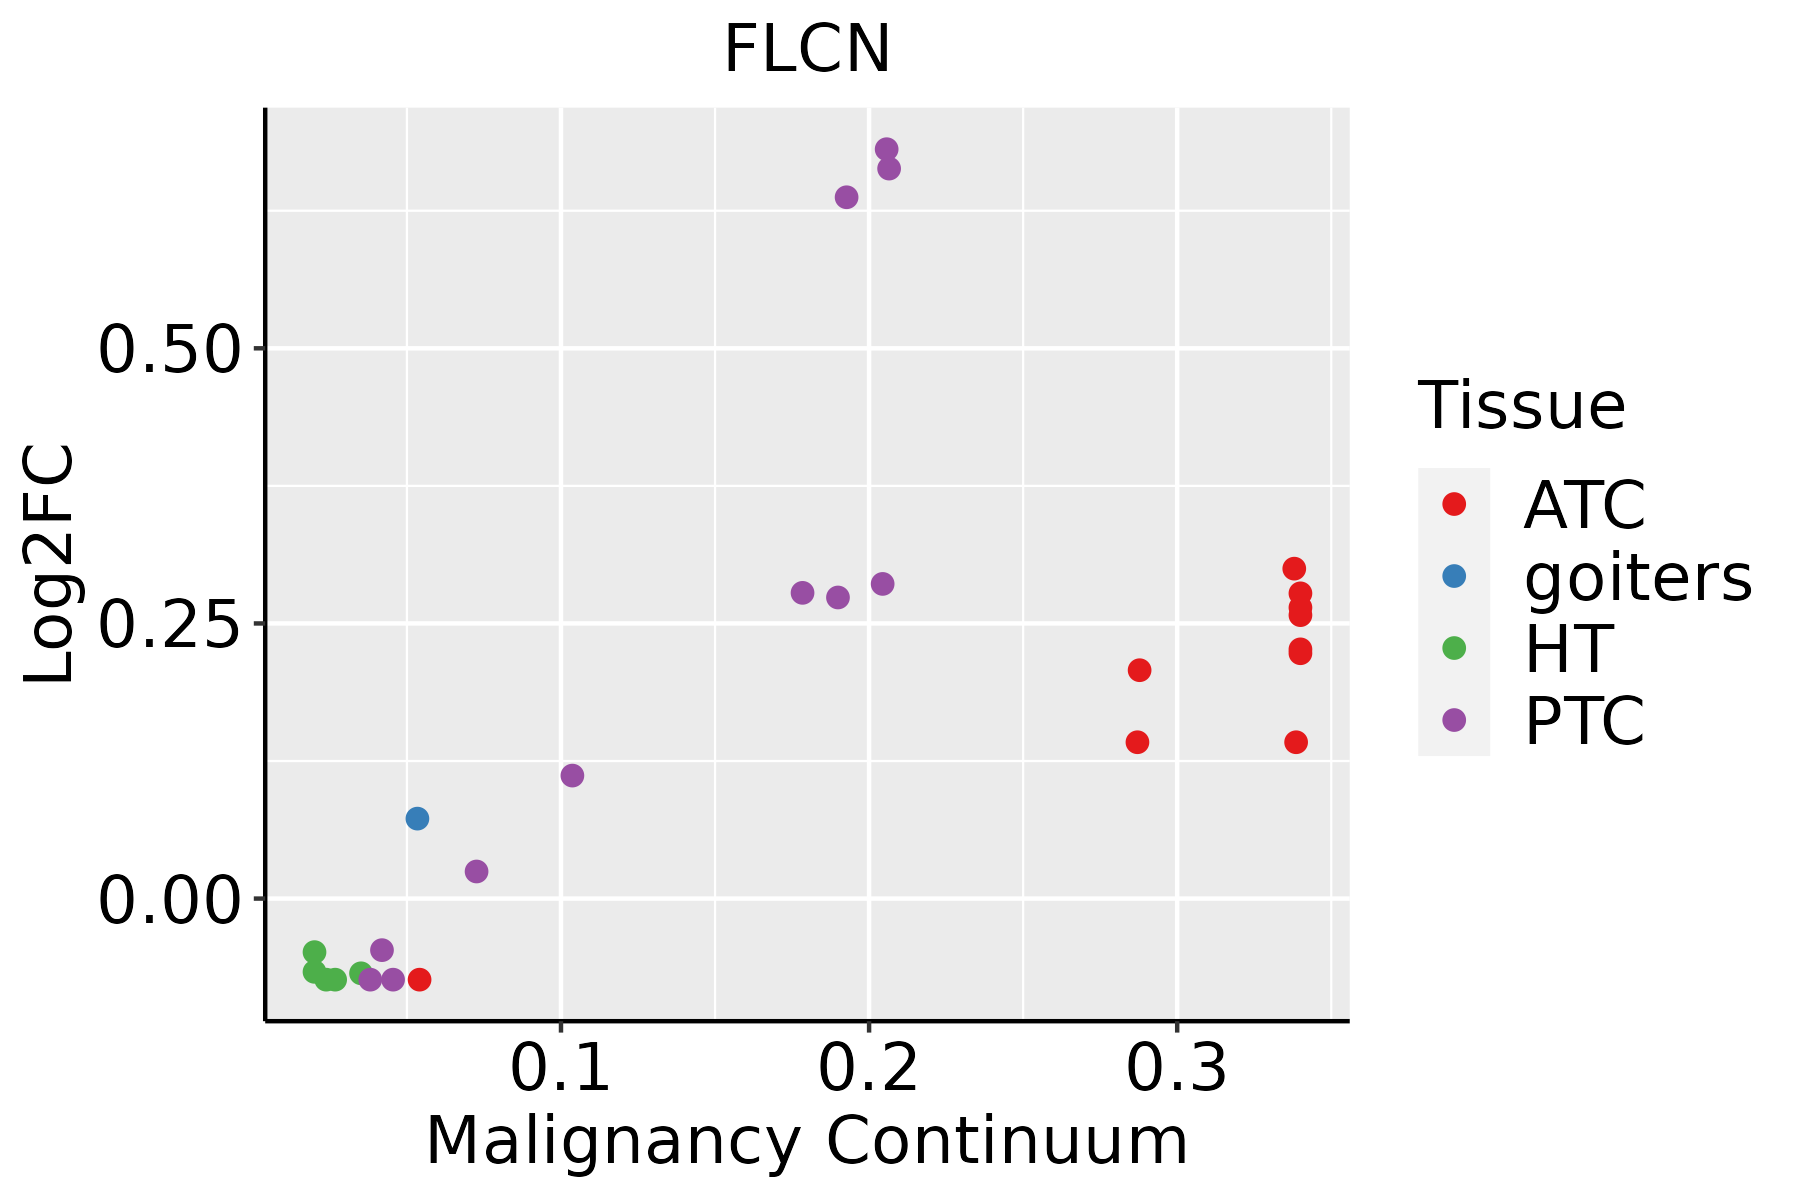 | ATC: Anaplastic thyroid cancer |
| HT: Hashimoto's thyroiditis | ||
| PTC: Papillary thyroid cancer |
| ∗log2FC in expression of this searched gene in stem-like cells from each diseased tissue sample relative to stem-like cells in normal samples in each tissue plotted against the malignancy continuum. Samples are colored based on if they are from different disease stage. |
Top |
Malignant transformation related pathway analysis |
| Find out the enriched GO biological processes and KEGG pathways involved in transition from healthy to precancer to cancer |
| Tissue | Disease Stage | Enriched GO biological Processes |
| Colorectum | AD |  |
| Colorectum | SER |  |
| Colorectum | MSS |  |
| Colorectum | MSI-H |  |
| Colorectum | FAP |  |
| ∗Top 15 enriched GO BP terms are showed in the bar plot of each disease state in each tissue. Each row represents a significant GO biological process which is colored according to the -log10(p.adjust). |
| Page: 1 2 3 4 5 6 7 8 9 |
| GO ID | Tissue | Disease Stage | Description | Gene Ratio | Bg Ratio | pvalue | p.adjust | Count |
| GO:00350655 | Thyroid | PTC | regulation of histone acetylation | 30/5968 | 54/18723 | 2.68e-04 | 1.91e-03 | 30 |
| GO:00900925 | Thyroid | PTC | regulation of transmembrane receptor protein serine/threonine kinase signaling pathway | 108/5968 | 256/18723 | 3.07e-04 | 2.14e-03 | 108 |
| GO:004592614 | Thyroid | PTC | negative regulation of growth | 105/5968 | 249/18723 | 3.76e-04 | 2.54e-03 | 105 |
| GO:007252219 | Thyroid | PTC | purine-containing compound biosynthetic process | 86/5968 | 200/18723 | 5.85e-04 | 3.72e-03 | 86 |
| GO:00465805 | Thyroid | PTC | negative regulation of Ras protein signal transduction | 27/5968 | 49/18723 | 6.38e-04 | 4.02e-03 | 27 |
| GO:19909286 | Thyroid | PTC | response to amino acid starvation | 27/5968 | 49/18723 | 6.38e-04 | 4.02e-03 | 27 |
| GO:00319295 | Thyroid | PTC | TOR signaling | 57/5968 | 126/18723 | 1.12e-03 | 6.56e-03 | 57 |
| GO:00305116 | Thyroid | PTC | positive regulation of transforming growth factor beta receptor signaling pathway | 19/5968 | 32/18723 | 1.21e-03 | 6.94e-03 | 19 |
| GO:19038466 | Thyroid | PTC | positive regulation of cellular response to transforming growth factor beta stimulus | 19/5968 | 32/18723 | 1.21e-03 | 6.94e-03 | 19 |
| GO:00303087 | Thyroid | PTC | negative regulation of cell growth | 80/5968 | 188/18723 | 1.28e-03 | 7.31e-03 | 80 |
| GO:000616419 | Thyroid | PTC | purine nucleotide biosynthetic process | 81/5968 | 191/18723 | 1.35e-03 | 7.65e-03 | 81 |
| GO:0007043111 | Thyroid | PTC | cell-cell junction assembly | 64/5968 | 146/18723 | 1.56e-03 | 8.63e-03 | 64 |
| GO:00434918 | Thyroid | PTC | protein kinase B signaling | 88/5968 | 211/18723 | 1.59e-03 | 8.81e-03 | 88 |
| GO:0043409112 | Thyroid | PTC | negative regulation of MAPK cascade | 76/5968 | 180/18723 | 2.15e-03 | 1.14e-02 | 76 |
| GO:004354714 | Thyroid | PTC | positive regulation of GTPase activity | 103/5968 | 255/18723 | 2.38e-03 | 1.25e-02 | 103 |
| GO:009028712 | Thyroid | PTC | regulation of cellular response to growth factor stimulus | 120/5968 | 304/18723 | 2.87e-03 | 1.42e-02 | 120 |
| GO:00350239 | Thyroid | PTC | regulation of Rho protein signal transduction | 40/5968 | 86/18723 | 3.15e-03 | 1.54e-02 | 40 |
| GO:00341986 | Thyroid | PTC | cellular response to amino acid starvation | 24/5968 | 46/18723 | 3.34e-03 | 1.63e-02 | 24 |
| GO:19015325 | Thyroid | PTC | regulation of hematopoietic progenitor cell differentiation | 18/5968 | 32/18723 | 3.72e-03 | 1.79e-02 | 18 |
| GO:001082318 | Thyroid | PTC | negative regulation of mitochondrion organization | 25/5968 | 49/18723 | 4.09e-03 | 1.95e-02 | 25 |
| Page: 1 2 3 4 5 6 7 8 9 10 11 12 13 14 15 |
| Pathway ID | Tissue | Disease Stage | Description | Gene Ratio | Bg Ratio | pvalue | p.adjust | qvalue | Count |
| hsa0521116 | Oral cavity | OSCC | Renal cell carcinoma | 51/3704 | 69/8465 | 3.30e-07 | 2.05e-06 | 1.04e-06 | 51 |
| hsa041504 | Oral cavity | OSCC | mTOR signaling pathway | 90/3704 | 156/8465 | 2.87e-04 | 9.15e-04 | 4.66e-04 | 90 |
| hsa0521117 | Oral cavity | OSCC | Renal cell carcinoma | 51/3704 | 69/8465 | 3.30e-07 | 2.05e-06 | 1.04e-06 | 51 |
| hsa0415012 | Oral cavity | OSCC | mTOR signaling pathway | 90/3704 | 156/8465 | 2.87e-04 | 9.15e-04 | 4.66e-04 | 90 |
| Page: 1 |
Top |
Cell-cell communication analysis |
| Identification of potential cell-cell interactions between two cell types and their ligand-receptor pairs for different disease states |
| Ligand | Receptor | LRpair | Pathway | Tissue | Disease Stage |
| Page: 1 |
Top |
Single-cell gene regulatory network inference analysis |
| Find out the significant the regulons (TFs) and the target genes of each regulon across cell types for different disease states |
| TF | Cell Type | Tissue | Disease Stage | Target Gene | RSS | Regulon Activity |
| ∗The dot plots of a searched regulon are shown for all cell subpopulations in each disease state of each tissue based on the regulon specific score inferred using pySCENIC and by calculating the average expression. |
| Page: 1 |
Top |
Somatic mutation of malignant transformation related genes |
| Annotation of somatic variants for genes involved in malignant transformation |
| Hugo Symbol | Variant Class | Variant Classification | dbSNP RS | HGVSc | HGVSp | HGVSp Short | SWISSPROT | BIOTYPE | SIFT | PolyPhen | Tumor Sample Barcode | Tissue | Histology | Sex | Age | Stage | Therapy Types | Drugs | Outcome |
| FLCN | insertion | In_Frame_Ins | novel | c.186_187insGGA | p.Ser62_Pro63insGly | p.S62_P63insG | Q8NFG4 | protein_coding | TCGA-AQ-A04J-01 | Breast | breast invasive carcinoma | Female | <65 | I/II | Chemotherapy | cytoxan | SD | ||
| FLCN | insertion | Frame_Shift_Ins | novel | c.185_186insGG | p.Ser62ArgfsTer69 | p.S62Rfs*69 | Q8NFG4 | protein_coding | TCGA-AQ-A04J-01 | Breast | breast invasive carcinoma | Female | <65 | I/II | Chemotherapy | cytoxan | SD | ||
| FLCN | SNV | Missense_Mutation | novel | c.193N>C | p.Glu65Gln | p.E65Q | Q8NFG4 | protein_coding | tolerated(0.22) | benign(0.062) | TCGA-C5-A1M7-01 | Cervix | cervical & endocervical cancer | Female | <65 | I/II | Unknown | Unknown | SD |
| FLCN | SNV | Missense_Mutation | rs138070947 | c.580C>T | p.Arg194Trp | p.R194W | Q8NFG4 | protein_coding | deleterious(0) | probably_damaging(0.974) | TCGA-C5-A2M2-01 | Cervix | cervical & endocervical cancer | Female | <65 | I/II | Unknown | Unknown | SD |
| FLCN | SNV | Missense_Mutation | rs763604691 | c.1724N>T | p.Ser575Leu | p.S575L | Q8NFG4 | protein_coding | tolerated_low_confidence(0.07) | benign(0) | TCGA-EA-A3HS-01 | Cervix | cervical & endocervical cancer | Female | <65 | I/II | Unknown | Unknown | SD |
| FLCN | SNV | Missense_Mutation | c.838G>A | p.Glu280Lys | p.E280K | Q8NFG4 | protein_coding | deleterious(0.01) | possibly_damaging(0.883) | TCGA-MU-A51Y-01 | Cervix | cervical & endocervical cancer | Female | <65 | I/II | Unknown | Unknown | SD | |
| FLCN | insertion | Frame_Shift_Ins | rs80338682 | c.1285_1286insC | p.His429ProfsTer27 | p.H429Pfs*27 | Q8NFG4 | protein_coding | TCGA-VS-A9UJ-01 | Cervix | cervical & endocervical cancer | Female | <65 | I/II | Unknown | Unknown | PD | ||
| FLCN | SNV | Missense_Mutation | c.1390N>A | p.Glu464Lys | p.E464K | Q8NFG4 | protein_coding | tolerated(0.16) | benign(0.015) | TCGA-AA-3845-01 | Colorectum | colon adenocarcinoma | Female | >=65 | I/II | Unknown | Unknown | PD | |
| FLCN | SNV | Missense_Mutation | novel | c.751T>A | p.Trp251Arg | p.W251R | Q8NFG4 | protein_coding | deleterious(0) | possibly_damaging(0.877) | TCGA-AA-3877-01 | Colorectum | colon adenocarcinoma | Female | >=65 | I/II | Unknown | Unknown | SD |
| FLCN | SNV | Missense_Mutation | c.1580N>C | p.Arg527Pro | p.R527P | Q8NFG4 | protein_coding | deleterious(0) | probably_damaging(0.921) | TCGA-AA-A02R-01 | Colorectum | colon adenocarcinoma | Female | >=65 | I/II | Unknown | Unknown | PD |
| Page: 1 2 3 4 5 |
Top |
Related drugs of malignant transformation related genes |
| Identification of chemicals and drugs interact with genes involved in malignant transfromation |
| (DGIdb 4.0) |
| Entrez ID | Symbol | Category | Interaction Types | Drug Claim Name | Drug Name | PMIDs |
| 201163 | FLCN | CLINICALLY ACTIONABLE | SIROLIMUS | SIROLIMUS | 26418749 | |
| 201163 | FLCN | CLINICALLY ACTIONABLE | EVEROLIMUS | EVEROLIMUS | 23995526 |
| Page: 1 |

Copyright 2023-Present -The University of Texas Health Science Center at Houston |