
|
|||||
|
 | |
| |
| |
| |
| |
| |
|
Gene: FCER1G |
Gene summary for FCER1G |
| Gene information | Species | Human | Gene symbol | FCER1G | Gene ID | 2207 |
| Gene name | Fc fragment of IgE receptor Ig | |
| Gene Alias | FCRG | |
| Cytomap | 1q23.3 | |
| Gene Type | protein-coding | GO ID | GO:0001775 | UniProtAcc | P30273 |
Top |
Malignant transformation analysis |
| Identification of the aberrant gene expression in precancerous and cancerous lesions by comparing the gene expression of stem-like cells in diseased tissues with normal stem cells |
| Entrez ID | Symbol | Replicates | Species | Organ | Tissue | Adj P-value | Log2FC | Malignancy |
| 2207 | FCER1G | NCCBC11 | Human | Breast | DCIS | 3.67e-03 | 6.06e-01 | 0.1232 |
| 2207 | FCER1G | NCCBC14 | Human | Breast | DCIS | 5.17e-05 | 4.66e-01 | 0.2021 |
| 2207 | FCER1G | NCCBC3 | Human | Breast | DCIS | 2.71e-43 | 9.54e-01 | 0.1198 |
| 2207 | FCER1G | NCCBC5 | Human | Breast | DCIS | 6.39e-17 | 8.40e-01 | 0.2046 |
| 2207 | FCER1G | CA_HPV_2 | Human | Cervix | CC | 5.45e-09 | -3.49e-01 | 0.0391 |
| 2207 | FCER1G | CA_HPV_3 | Human | Cervix | CC | 1.77e-05 | -5.01e-01 | 0.0414 |
| 2207 | FCER1G | CCI_1 | Human | Cervix | CC | 2.86e-12 | -1.17e+00 | 0.528 |
| 2207 | FCER1G | CCI_2 | Human | Cervix | CC | 5.63e-11 | -1.12e+00 | 0.5249 |
| 2207 | FCER1G | CCI_3 | Human | Cervix | CC | 6.33e-15 | -1.14e+00 | 0.516 |
| 2207 | FCER1G | CCII_1 | Human | Cervix | CC | 8.45e-25 | -1.19e+00 | 0.3249 |
| 2207 | FCER1G | Tumor | Human | Cervix | CC | 1.34e-58 | -1.18e+00 | 0.1241 |
| 2207 | FCER1G | sample1 | Human | Cervix | CC | 7.63e-19 | -1.17e+00 | 0.0959 |
| 2207 | FCER1G | sample3 | Human | Cervix | CC | 2.19e-53 | -1.18e+00 | 0.1387 |
| 2207 | FCER1G | H2 | Human | Cervix | HSIL_HPV | 4.80e-49 | -1.12e+00 | 0.0632 |
| 2207 | FCER1G | L1 | Human | Cervix | CC | 9.59e-10 | -8.41e-01 | 0.0802 |
| 2207 | FCER1G | T1 | Human | Cervix | CC | 1.45e-33 | -1.11e+00 | 0.0918 |
| 2207 | FCER1G | T2 | Human | Cervix | CC | 3.91e-12 | -1.19e+00 | 0.0709 |
| 2207 | FCER1G | T3 | Human | Cervix | CC | 4.14e-57 | -1.19e+00 | 0.1389 |
| 2207 | FCER1G | S43 | Human | Liver | Cirrhotic | 7.29e-09 | -4.69e-01 | -0.0187 |
| 2207 | FCER1G | HCC1_Meng | Human | Liver | HCC | 4.03e-19 | -2.93e-01 | 0.0246 |
| Page: 1 2 3 |
| Tissue | Expression Dynamics | Abbreviation |
| Breast | 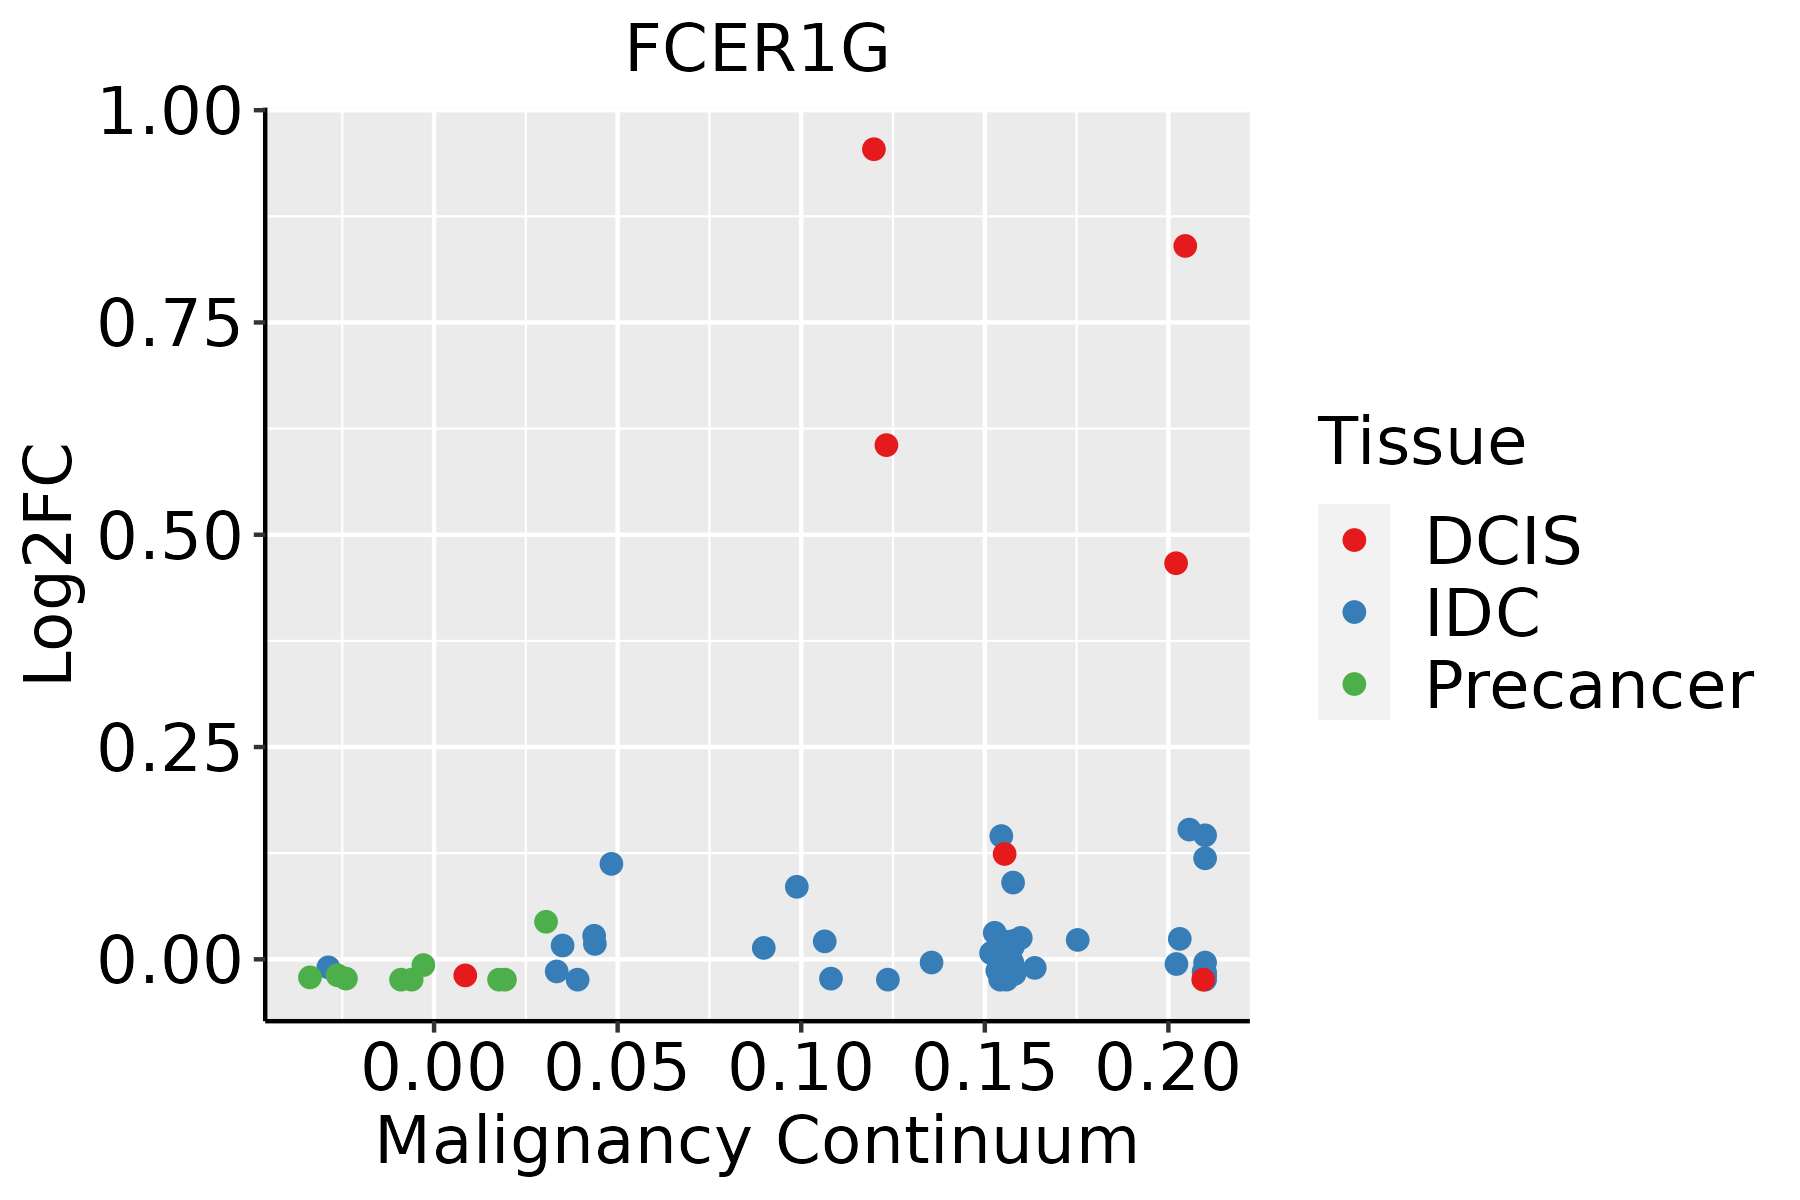 | IDC: Invasive ductal carcinoma |
| DCIS: Ductal carcinoma in situ | ||
| Precancer(BRCA1-mut): Precancerous lesion from BRCA1 mutation carriers | ||
| Cervix | 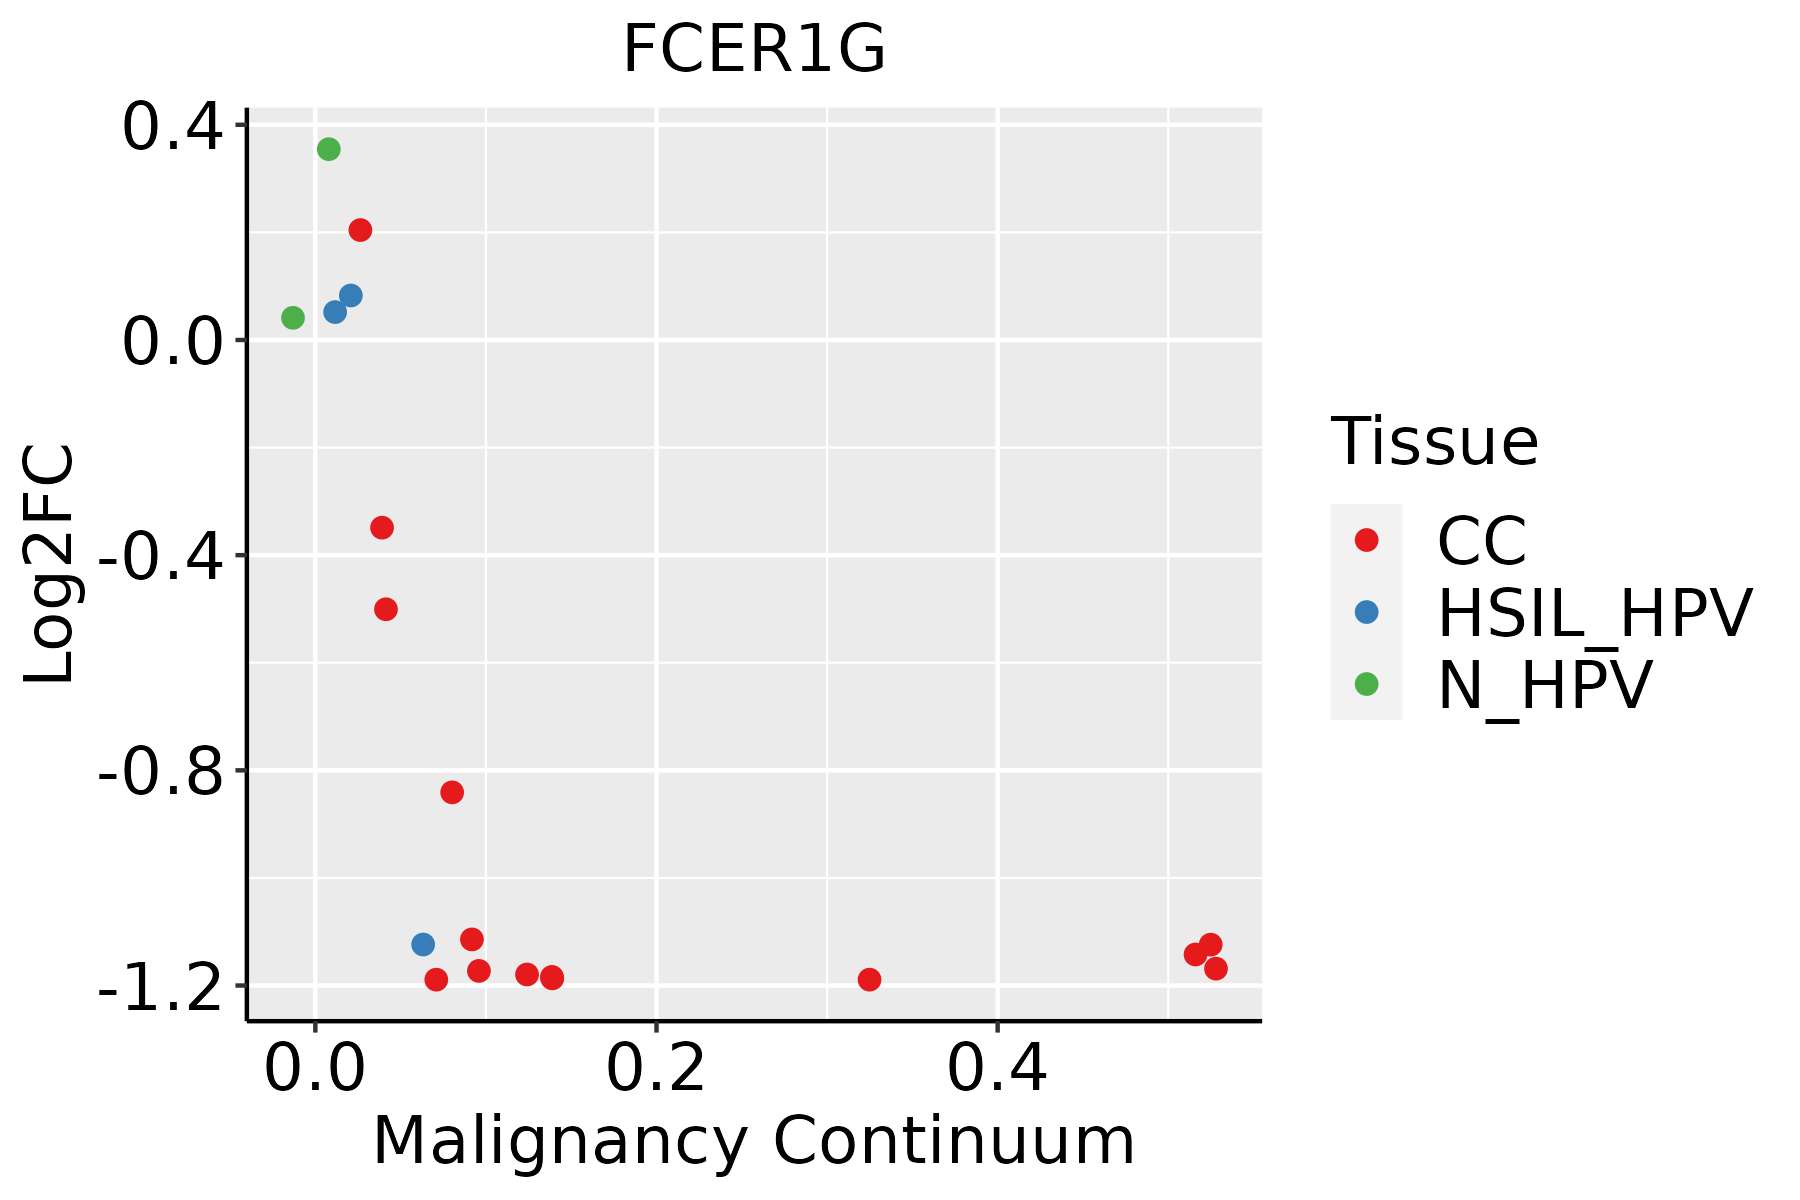 | CC: Cervix cancer |
| HSIL_HPV: HPV-infected high-grade squamous intraepithelial lesions | ||
| N_HPV: HPV-infected normal cervix | ||
| Liver | 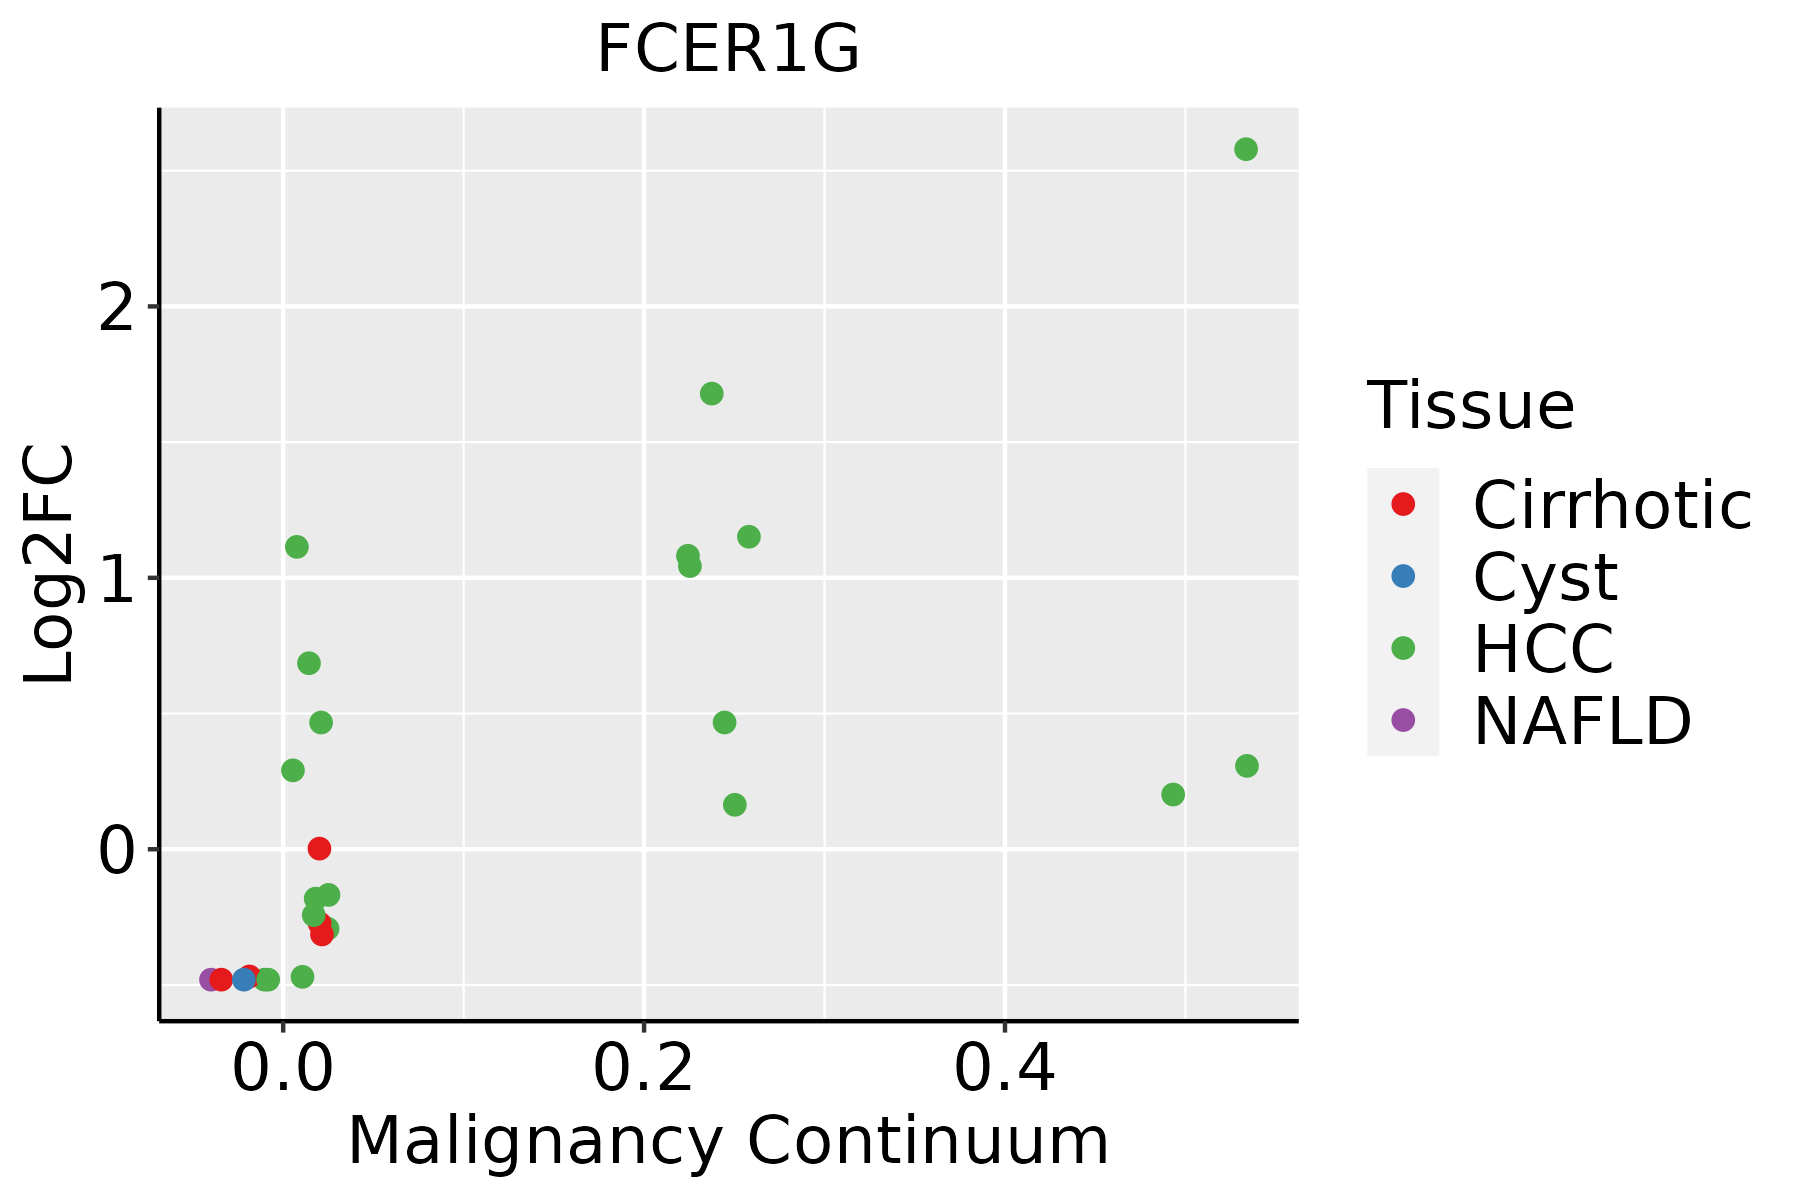 | HCC: Hepatocellular carcinoma |
| NAFLD: Non-alcoholic fatty liver disease | ||
| Oral Cavity | 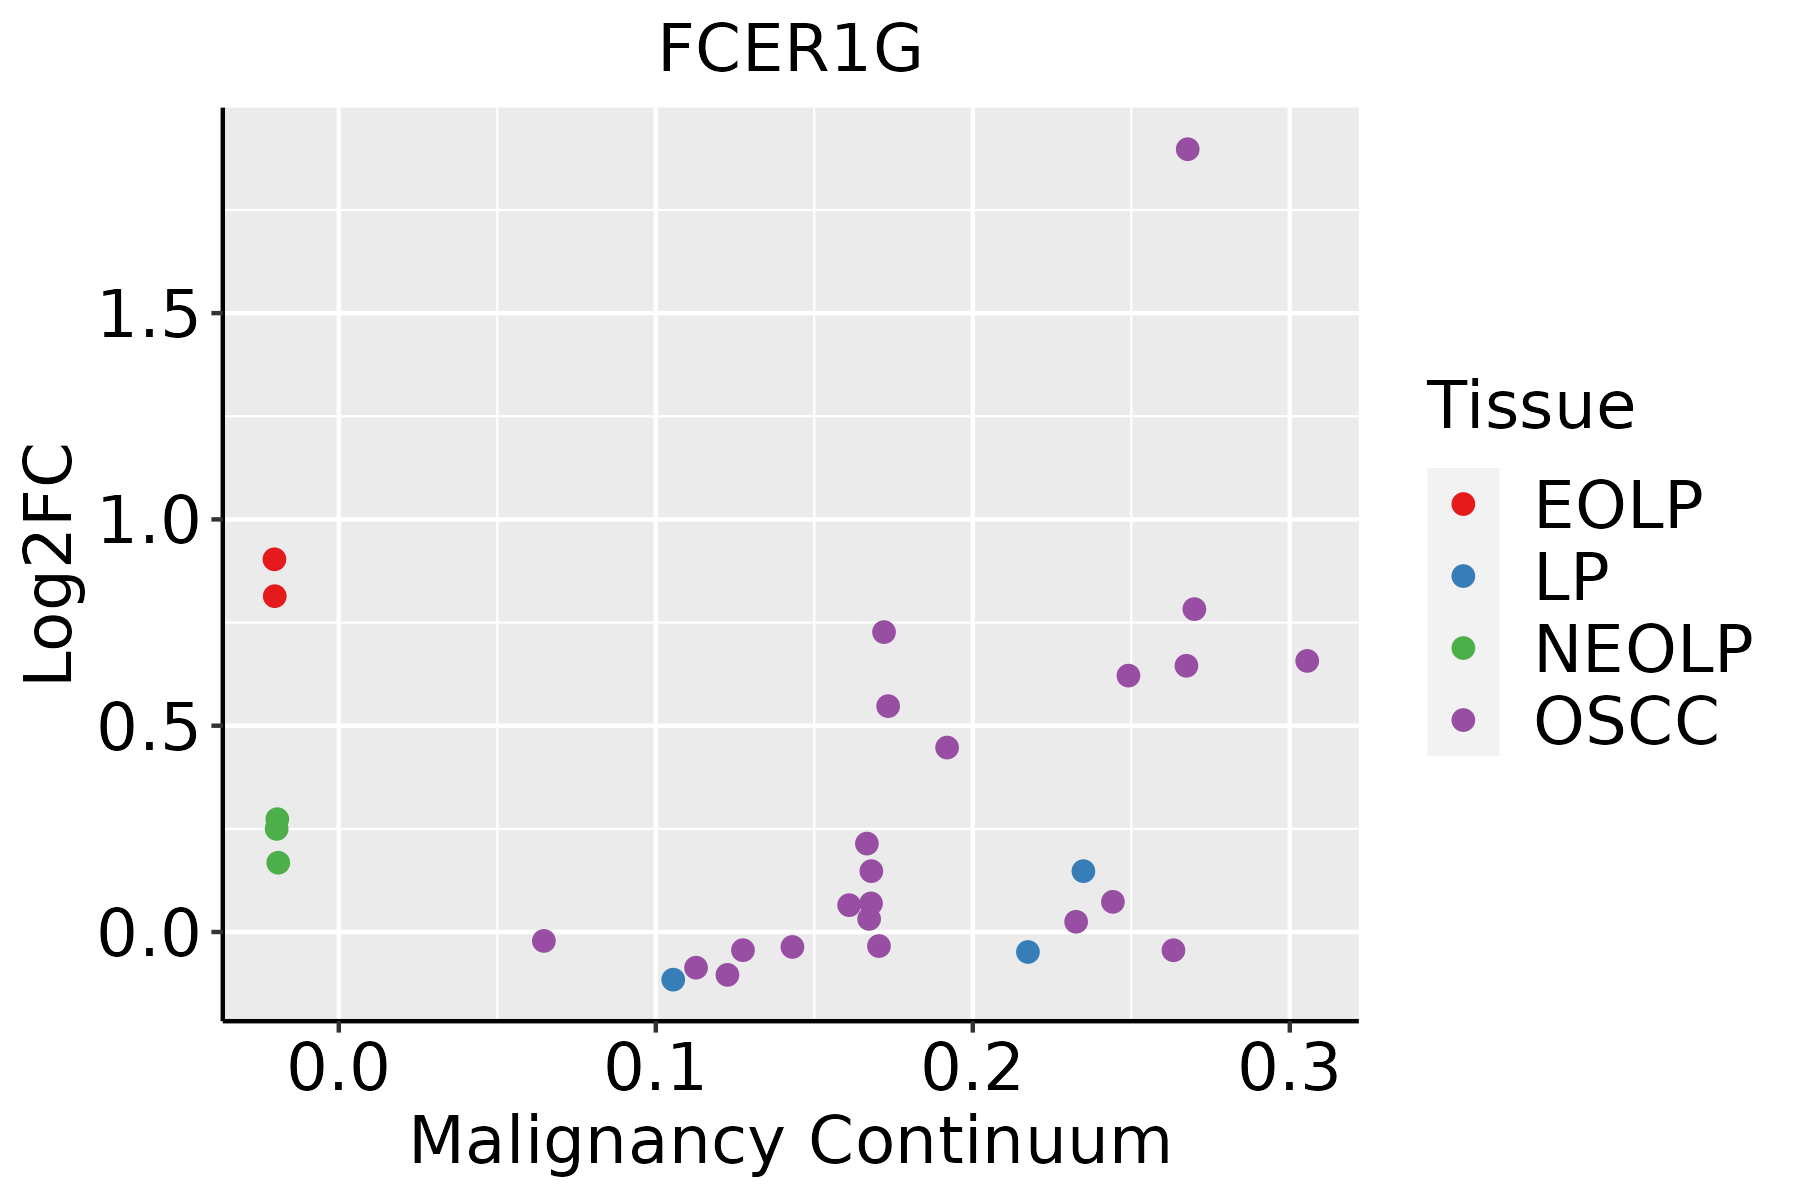 | EOLP: Erosive Oral lichen planus |
| LP: leukoplakia | ||
| NEOLP: Non-erosive oral lichen planus | ||
| OSCC: Oral squamous cell carcinoma | ||
| Thyroid | 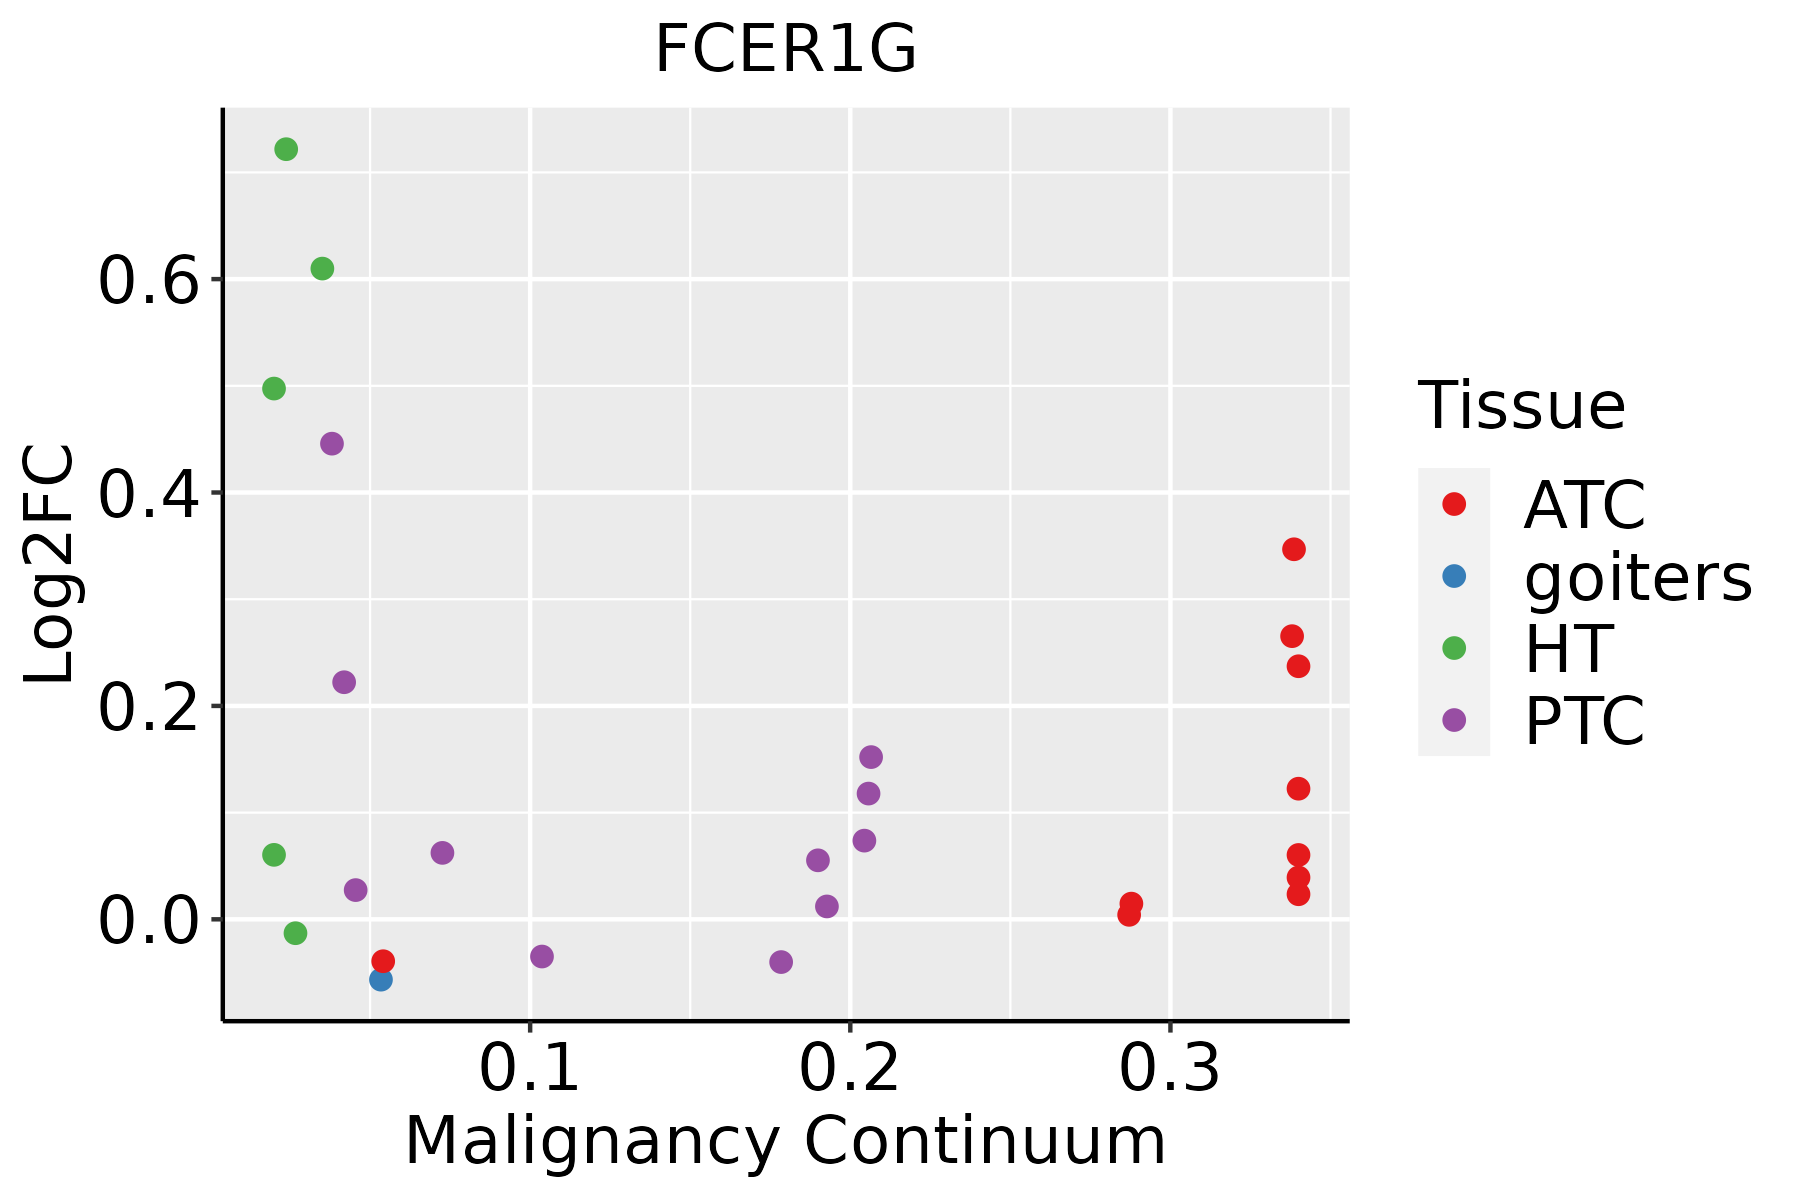 | ATC: Anaplastic thyroid cancer |
| HT: Hashimoto's thyroiditis | ||
| PTC: Papillary thyroid cancer |
| ∗log2FC in expression of this searched gene in stem-like cells from each diseased tissue sample relative to stem-like cells in normal samples in each tissue plotted against the malignancy continuum. Samples are colored based on if they are from different disease stage. |
Top |
Malignant transformation related pathway analysis |
| Find out the enriched GO biological processes and KEGG pathways involved in transition from healthy to precancer to cancer |
| Tissue | Disease Stage | Enriched GO biological Processes |
| Colorectum | AD |  |
| Colorectum | SER |  |
| Colorectum | MSS |  |
| Colorectum | MSI-H |  |
| Colorectum | FAP |  |
| ∗Top 15 enriched GO BP terms are showed in the bar plot of each disease state in each tissue. Each row represents a significant GO biological process which is colored according to the -log10(p.adjust). |
| Page: 1 2 3 4 5 6 7 8 9 |
| GO ID | Tissue | Disease Stage | Description | Gene Ratio | Bg Ratio | pvalue | p.adjust | Count |
| GO:004311210 | Oral cavity | OSCC | receptor metabolic process | 88/7305 | 166/18723 | 1.68e-04 | 1.15e-03 | 88 |
| GO:00192214 | Oral cavity | OSCC | cytokine-mediated signaling pathway | 222/7305 | 472/18723 | 2.02e-04 | 1.35e-03 | 222 |
| GO:000247819 | Oral cavity | OSCC | antigen processing and presentation of exogenous peptide antigen | 26/7305 | 38/18723 | 2.29e-04 | 1.49e-03 | 26 |
| GO:00300983 | Oral cavity | OSCC | lymphocyte differentiation | 179/7305 | 374/18723 | 2.74e-04 | 1.74e-03 | 179 |
| GO:005090010 | Oral cavity | OSCC | leukocyte migration | 176/7305 | 369/18723 | 3.80e-04 | 2.31e-03 | 176 |
| GO:001988419 | Oral cavity | OSCC | antigen processing and presentation of exogenous antigen | 30/7305 | 47/18723 | 4.96e-04 | 2.92e-03 | 30 |
| GO:005087819 | Oral cavity | OSCC | regulation of body fluid levels | 179/7305 | 379/18723 | 6.19e-04 | 3.50e-03 | 179 |
| GO:00302175 | Oral cavity | OSCC | T cell differentiation | 126/7305 | 257/18723 | 6.51e-04 | 3.66e-03 | 126 |
| GO:00380942 | Oral cavity | OSCC | Fc-gamma receptor signaling pathway | 19/7305 | 28/18723 | 1.88e-03 | 8.84e-03 | 19 |
| GO:000181910 | Oral cavity | OSCC | positive regulation of cytokine production | 213/7305 | 467/18723 | 1.93e-03 | 8.96e-03 | 213 |
| GO:00603269 | Oral cavity | OSCC | cell chemotaxis | 146/7305 | 310/18723 | 2.13e-03 | 9.80e-03 | 146 |
| GO:000250410 | Oral cavity | OSCC | antigen processing and presentation of peptide or polysaccharide antigen via MHC class II | 23/7305 | 36/18723 | 2.19e-03 | 9.95e-03 | 23 |
| GO:00027646 | Oral cavity | OSCC | immune response-regulating signaling pathway | 212/7305 | 468/18723 | 2.93e-03 | 1.27e-02 | 212 |
| GO:0036230 | Oral cavity | OSCC | granulocyte activation | 26/7305 | 43/18723 | 3.55e-03 | 1.49e-02 | 26 |
| GO:00024312 | Oral cavity | OSCC | Fc receptor mediated stimulatory signaling pathway | 21/7305 | 33/18723 | 3.63e-03 | 1.51e-02 | 21 |
| GO:00305959 | Oral cavity | OSCC | leukocyte chemotaxis | 110/7305 | 230/18723 | 3.86e-03 | 1.58e-02 | 110 |
| GO:00380935 | Oral cavity | OSCC | Fc receptor signaling pathway | 29/7305 | 50/18723 | 5.01e-03 | 1.96e-02 | 29 |
| GO:0042119 | Oral cavity | OSCC | neutrophil activation | 22/7305 | 36/18723 | 5.96e-03 | 2.27e-02 | 22 |
| GO:00714022 | Oral cavity | OSCC | cellular response to lipoprotein particle stimulus | 22/7305 | 36/18723 | 5.96e-03 | 2.27e-02 | 22 |
| GO:000249510 | Oral cavity | OSCC | antigen processing and presentation of peptide antigen via MHC class II | 21/7305 | 34/18723 | 6.02e-03 | 2.28e-02 | 21 |
| Page: 1 2 3 4 5 6 7 8 9 10 11 12 13 14 15 16 |
| Pathway ID | Tissue | Disease Stage | Description | Gene Ratio | Bg Ratio | pvalue | p.adjust | qvalue | Count |
| hsa0407110 | Cervix | CC | Sphingolipid signaling pathway | 35/1267 | 121/8465 | 5.70e-05 | 3.93e-04 | 2.32e-04 | 35 |
| hsa04664 | Cervix | CC | Fc epsilon RI signaling pathway | 22/1267 | 68/8465 | 2.35e-04 | 1.31e-03 | 7.77e-04 | 22 |
| hsa05152 | Cervix | CC | Tuberculosis | 42/1267 | 180/8465 | 1.78e-03 | 7.21e-03 | 4.26e-03 | 42 |
| hsa053107 | Cervix | CC | Asthma | 11/1267 | 31/8465 | 3.82e-03 | 1.36e-02 | 8.03e-03 | 11 |
| hsa046254 | Cervix | CC | C-type lectin receptor signaling pathway | 25/1267 | 104/8465 | 9.52e-03 | 2.94e-02 | 1.74e-02 | 25 |
| hsa046115 | Cervix | CC | Platelet activation | 28/1267 | 124/8465 | 1.50e-02 | 4.45e-02 | 2.63e-02 | 28 |
| hsa0407113 | Cervix | CC | Sphingolipid signaling pathway | 35/1267 | 121/8465 | 5.70e-05 | 3.93e-04 | 2.32e-04 | 35 |
| hsa046641 | Cervix | CC | Fc epsilon RI signaling pathway | 22/1267 | 68/8465 | 2.35e-04 | 1.31e-03 | 7.77e-04 | 22 |
| hsa051521 | Cervix | CC | Tuberculosis | 42/1267 | 180/8465 | 1.78e-03 | 7.21e-03 | 4.26e-03 | 42 |
| hsa0531012 | Cervix | CC | Asthma | 11/1267 | 31/8465 | 3.82e-03 | 1.36e-02 | 8.03e-03 | 11 |
| hsa0462511 | Cervix | CC | C-type lectin receptor signaling pathway | 25/1267 | 104/8465 | 9.52e-03 | 2.94e-02 | 1.74e-02 | 25 |
| hsa0461113 | Cervix | CC | Platelet activation | 28/1267 | 124/8465 | 1.50e-02 | 4.45e-02 | 2.63e-02 | 28 |
| hsa0531021 | Cervix | HSIL_HPV | Asthma | 11/459 | 31/8465 | 3.33e-07 | 8.88e-06 | 7.18e-06 | 11 |
| hsa051522 | Cervix | HSIL_HPV | Tuberculosis | 19/459 | 180/8465 | 3.99e-03 | 2.39e-02 | 1.93e-02 | 19 |
| hsa0531031 | Cervix | HSIL_HPV | Asthma | 11/459 | 31/8465 | 3.33e-07 | 8.88e-06 | 7.18e-06 | 11 |
| hsa051523 | Cervix | HSIL_HPV | Tuberculosis | 19/459 | 180/8465 | 3.99e-03 | 2.39e-02 | 1.93e-02 | 19 |
| hsa040718 | Liver | HCC | Sphingolipid signaling pathway | 72/4020 | 121/8465 | 5.01e-03 | 1.47e-02 | 8.18e-03 | 72 |
| hsa046112 | Liver | HCC | Platelet activation | 71/4020 | 124/8465 | 1.77e-02 | 4.15e-02 | 2.31e-02 | 71 |
| hsa0407111 | Liver | HCC | Sphingolipid signaling pathway | 72/4020 | 121/8465 | 5.01e-03 | 1.47e-02 | 8.18e-03 | 72 |
| hsa0461111 | Liver | HCC | Platelet activation | 71/4020 | 124/8465 | 1.77e-02 | 4.15e-02 | 2.31e-02 | 71 |
| Page: 1 2 |
Top |
Cell-cell communication analysis |
| Identification of potential cell-cell interactions between two cell types and their ligand-receptor pairs for different disease states |
| Ligand | Receptor | LRpair | Pathway | Tissue | Disease Stage |
| Page: 1 |
Top |
Single-cell gene regulatory network inference analysis |
| Find out the significant the regulons (TFs) and the target genes of each regulon across cell types for different disease states |
| TF | Cell Type | Tissue | Disease Stage | Target Gene | RSS | Regulon Activity |
| ∗The dot plots of a searched regulon are shown for all cell subpopulations in each disease state of each tissue based on the regulon specific score inferred using pySCENIC and by calculating the average expression. |
| Page: 1 |
Top |
Somatic mutation of malignant transformation related genes |
| Annotation of somatic variants for genes involved in malignant transformation |
| Hugo Symbol | Variant Class | Variant Classification | dbSNP RS | HGVSc | HGVSp | HGVSp Short | SWISSPROT | BIOTYPE | SIFT | PolyPhen | Tumor Sample Barcode | Tissue | Histology | Sex | Age | Stage | Therapy Types | Drugs | Outcome |
| FCER1G | SNV | Missense_Mutation | c.107N>A | p.Gly36Glu | p.G36E | P30273 | protein_coding | deleterious(0) | probably_damaging(1) | TCGA-EK-A2PM-01 | Cervix | cervical & endocervical cancer | Female | >=65 | I/II | Unknown | Unknown | SD | |
| FCER1G | SNV | Missense_Mutation | c.115N>A | p.Leu39Ile | p.L39I | P30273 | protein_coding | deleterious(0) | probably_damaging(0.992) | TCGA-AP-A0LG-01 | Endometrium | uterine corpus endometrioid carcinoma | Female | <65 | I/II | Unknown | Unknown | SD | |
| FCER1G | SNV | Missense_Mutation | rs780351889 | c.246N>T | p.Glu82Asp | p.E82D | P30273 | protein_coding | tolerated(0.16) | benign(0.222) | TCGA-AX-A0J0-01 | Endometrium | uterine corpus endometrioid carcinoma | Female | <65 | I/II | Unknown | Unknown | SD |
| FCER1G | SNV | Missense_Mutation | c.134G>A | p.Arg45Gln | p.R45Q | P30273 | protein_coding | deleterious(0.01) | probably_damaging(0.992) | TCGA-B5-A0JY-01 | Endometrium | uterine corpus endometrioid carcinoma | Female | <65 | III/IV | Chemotherapy | doxorubicin | SD | |
| FCER1G | SNV | Missense_Mutation | c.121N>A | p.Leu41Ile | p.L41I | P30273 | protein_coding | tolerated(0.5) | probably_damaging(0.925) | TCGA-EO-A22R-01 | Endometrium | uterine corpus endometrioid carcinoma | Female | <65 | I/II | Unknown | Unknown | SD | |
| FCER1G | SNV | Missense_Mutation | novel | c.109N>C | p.Ile37Leu | p.I37L | P30273 | protein_coding | tolerated(0.08) | benign(0.006) | TCGA-EY-A215-01 | Endometrium | uterine corpus endometrioid carcinoma | Female | <65 | I/II | Unknown | Unknown | SD |
| FCER1G | SNV | Missense_Mutation | novel | c.52G>A | p.Ala18Thr | p.A18T | P30273 | protein_coding | deleterious(0) | benign(0.159) | TCGA-FI-A2D5-01 | Endometrium | uterine corpus endometrioid carcinoma | Female | <65 | III/IV | Chemotherapy | carboplatinum | PD |
| FCER1G | SNV | Missense_Mutation | rs538957910 | c.65N>A | p.Pro22His | p.P22H | P30273 | protein_coding | deleterious(0.05) | probably_damaging(0.999) | TCGA-56-8504-01 | Lung | lung squamous cell carcinoma | Male | >=65 | I/II | Unknown | Unknown | SD |
| Page: 1 |
Top |
Related drugs of malignant transformation related genes |
| Identification of chemicals and drugs interact with genes involved in malignant transfromation |
| (DGIdb 4.0) |
| Entrez ID | Symbol | Category | Interaction Types | Drug Claim Name | Drug Name | PMIDs |
| 2207 | FCER1G | CELL SURFACE, EXTERNAL SIDE OF PLASMA MEMBRANE | R112 | |||
| 2207 | FCER1G | CELL SURFACE, EXTERNAL SIDE OF PLASMA MEMBRANE | BENZYLPENICILLOYL POLYLYSINE | |||
| 2207 | FCER1G | CELL SURFACE, EXTERNAL SIDE OF PLASMA MEMBRANE | aspirin | ASPIRIN | 18595682,18534082 | |
| 2207 | FCER1G | CELL SURFACE, EXTERNAL SIDE OF PLASMA MEMBRANE | BENZYLPENICILLOYL POLYLYSINE |
| Page: 1 |

Copyright 2023-Present -The University of Texas Health Science Center at Houston |