
|
|||||
|
 | |
| |
| |
| |
| |
| |
|
Gene: FBXO2 |
Gene summary for FBXO2 |
| Gene information | Species | Human | Gene symbol | FBXO2 | Gene ID | 26232 |
| Gene name | F-box protein 2 | |
| Gene Alias | FBG1 | |
| Cytomap | 1p36.22 | |
| Gene Type | protein-coding | GO ID | GO:0006464 | UniProtAcc | Q9UK22 |
Top |
Malignant transformation analysis |
| Identification of the aberrant gene expression in precancerous and cancerous lesions by comparing the gene expression of stem-like cells in diseased tissues with normal stem cells |
| Entrez ID | Symbol | Replicates | Species | Organ | Tissue | Adj P-value | Log2FC | Malignancy |
| 26232 | FBXO2 | LZE22T | Human | Esophagus | ESCC | 1.83e-06 | 4.05e-01 | 0.068 |
| 26232 | FBXO2 | LZE24T | Human | Esophagus | ESCC | 6.41e-03 | 2.13e-01 | 0.0596 |
| 26232 | FBXO2 | P2T-E | Human | Esophagus | ESCC | 1.83e-11 | 3.72e-01 | 0.1177 |
| 26232 | FBXO2 | P4T-E | Human | Esophagus | ESCC | 7.20e-03 | 9.14e-02 | 0.1323 |
| 26232 | FBXO2 | P8T-E | Human | Esophagus | ESCC | 1.54e-17 | 4.90e-01 | 0.0889 |
| 26232 | FBXO2 | P15T-E | Human | Esophagus | ESCC | 2.99e-05 | 1.01e-01 | 0.1149 |
| 26232 | FBXO2 | P16T-E | Human | Esophagus | ESCC | 1.30e-08 | 2.00e-01 | 0.1153 |
| 26232 | FBXO2 | P17T-E | Human | Esophagus | ESCC | 6.13e-05 | 3.71e-01 | 0.1278 |
| 26232 | FBXO2 | P20T-E | Human | Esophagus | ESCC | 3.84e-08 | 2.00e-01 | 0.1124 |
| 26232 | FBXO2 | P21T-E | Human | Esophagus | ESCC | 1.43e-55 | 1.32e+00 | 0.1617 |
| 26232 | FBXO2 | P22T-E | Human | Esophagus | ESCC | 6.20e-25 | 4.92e-01 | 0.1236 |
| 26232 | FBXO2 | P24T-E | Human | Esophagus | ESCC | 2.17e-29 | 7.99e-01 | 0.1287 |
| 26232 | FBXO2 | P31T-E | Human | Esophagus | ESCC | 6.93e-31 | 6.91e-01 | 0.1251 |
| 26232 | FBXO2 | P36T-E | Human | Esophagus | ESCC | 3.14e-41 | 1.40e+00 | 0.1187 |
| 26232 | FBXO2 | P37T-E | Human | Esophagus | ESCC | 4.36e-10 | 3.48e-01 | 0.1371 |
| 26232 | FBXO2 | P38T-E | Human | Esophagus | ESCC | 4.52e-08 | 3.38e-01 | 0.127 |
| 26232 | FBXO2 | P40T-E | Human | Esophagus | ESCC | 1.57e-17 | 7.19e-01 | 0.109 |
| 26232 | FBXO2 | P52T-E | Human | Esophagus | ESCC | 5.75e-07 | 2.37e-01 | 0.1555 |
| 26232 | FBXO2 | P54T-E | Human | Esophagus | ESCC | 1.98e-02 | 1.51e-01 | 0.0975 |
| 26232 | FBXO2 | P56T-E | Human | Esophagus | ESCC | 4.39e-13 | 2.11e+00 | 0.1613 |
| Page: 1 2 3 4 |
| Tissue | Expression Dynamics | Abbreviation |
| Esophagus |  | ESCC: Esophageal squamous cell carcinoma |
| HGIN: High-grade intraepithelial neoplasias | ||
| LGIN: Low-grade intraepithelial neoplasias | ||
| Oral Cavity |  | EOLP: Erosive Oral lichen planus |
| LP: leukoplakia | ||
| NEOLP: Non-erosive oral lichen planus | ||
| OSCC: Oral squamous cell carcinoma | ||
| Skin | 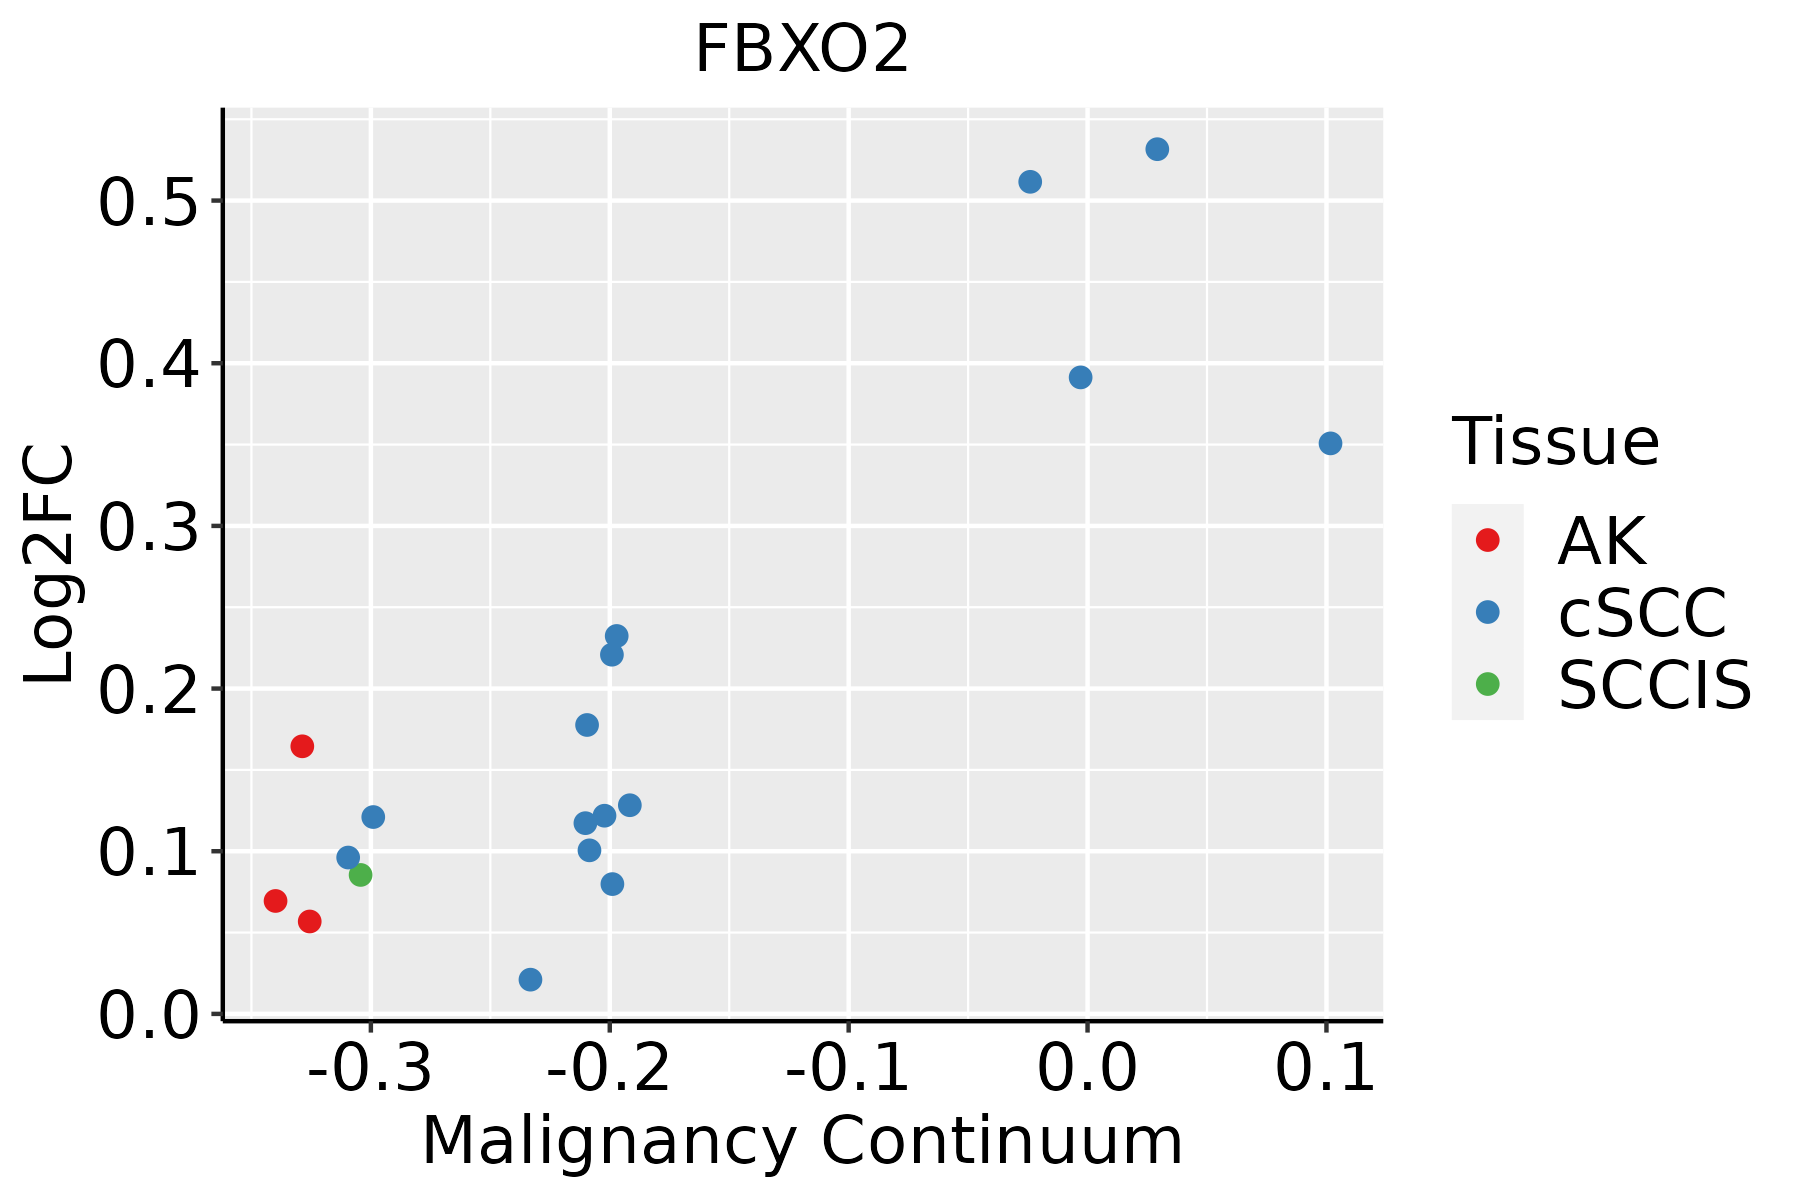 | AK: Actinic keratosis |
| cSCC: Cutaneous squamous cell carcinoma | ||
| SCCIS:squamous cell carcinoma in situ | ||
| Thyroid | 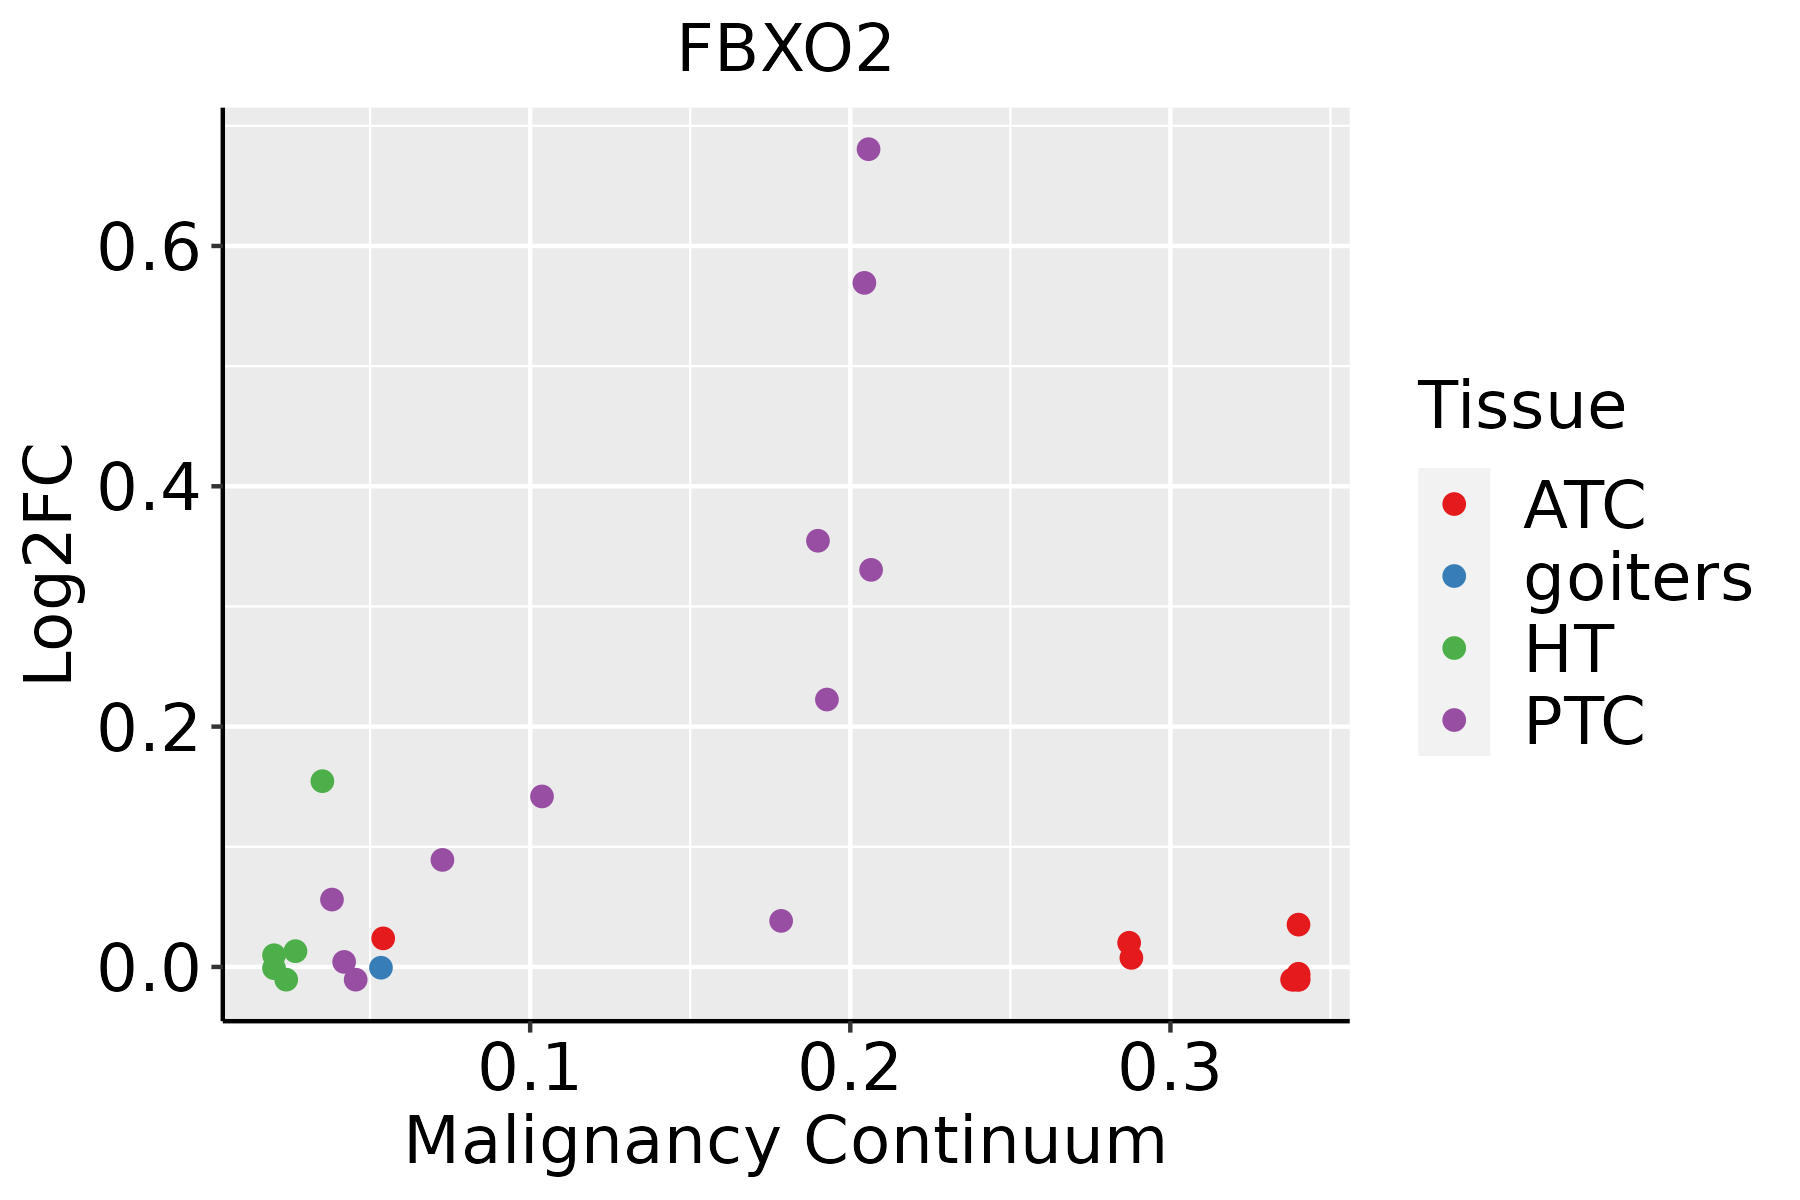 | ATC: Anaplastic thyroid cancer |
| HT: Hashimoto's thyroiditis | ||
| PTC: Papillary thyroid cancer |
| ∗log2FC in expression of this searched gene in stem-like cells from each diseased tissue sample relative to stem-like cells in normal samples in each tissue plotted against the malignancy continuum. Samples are colored based on if they are from different disease stage. |
Top |
Malignant transformation related pathway analysis |
| Find out the enriched GO biological processes and KEGG pathways involved in transition from healthy to precancer to cancer |
| Tissue | Disease Stage | Enriched GO biological Processes |
| Colorectum | AD |  |
| Colorectum | SER |  |
| Colorectum | MSS |  |
| Colorectum | MSI-H |  |
| Colorectum | FAP |  |
| ∗Top 15 enriched GO BP terms are showed in the bar plot of each disease state in each tissue. Each row represents a significant GO biological process which is colored according to the -log10(p.adjust). |
| Page: 1 2 3 4 5 6 7 8 9 |
| GO ID | Tissue | Disease Stage | Description | Gene Ratio | Bg Ratio | pvalue | p.adjust | Count |
| GO:1901800112 | Thyroid | PTC | positive regulation of proteasomal protein catabolic process | 80/5968 | 114/18723 | 4.80e-17 | 4.27e-15 | 80 |
| GO:1903052112 | Thyroid | PTC | positive regulation of proteolysis involved in cellular protein catabolic process | 88/5968 | 133/18723 | 4.30e-16 | 3.39e-14 | 88 |
| GO:0032436113 | Thyroid | PTC | positive regulation of proteasomal ubiquitin-dependent protein catabolic process | 66/5968 | 90/18723 | 7.51e-16 | 5.64e-14 | 66 |
| GO:2000060113 | Thyroid | PTC | positive regulation of ubiquitin-dependent protein catabolic process | 73/5968 | 107/18723 | 1.19e-14 | 7.75e-13 | 73 |
| GO:00365038 | Thyroid | PTC | ERAD pathway | 71/5968 | 107/18723 | 2.37e-13 | 1.22e-11 | 71 |
| GO:000020920 | Thyroid | PTC | protein polyubiquitination | 128/5968 | 236/18723 | 7.81e-13 | 3.65e-11 | 128 |
| GO:003043315 | Thyroid | PTC | ubiquitin-dependent ERAD pathway | 59/5968 | 85/18723 | 1.30e-12 | 5.91e-11 | 59 |
| GO:006053719 | Thyroid | PTC | muscle tissue development | 156/5968 | 403/18723 | 1.98e-03 | 1.06e-02 | 156 |
| GO:00091003 | Thyroid | PTC | glycoprotein metabolic process | 147/5968 | 387/18723 | 5.87e-03 | 2.64e-02 | 147 |
| GO:001470617 | Thyroid | PTC | striated muscle tissue development | 144/5968 | 384/18723 | 1.05e-02 | 4.22e-02 | 144 |
| GO:001049832 | Thyroid | ATC | proteasomal protein catabolic process | 309/6293 | 490/18723 | 1.78e-41 | 1.13e-37 | 309 |
| GO:0043161210 | Thyroid | ATC | proteasome-mediated ubiquitin-dependent protein catabolic process | 265/6293 | 412/18723 | 7.09e-38 | 1.49e-34 | 265 |
| GO:0009896210 | Thyroid | ATC | positive regulation of catabolic process | 290/6293 | 492/18723 | 2.15e-31 | 1.94e-28 | 290 |
| GO:0031331210 | Thyroid | ATC | positive regulation of cellular catabolic process | 258/6293 | 427/18723 | 2.09e-30 | 1.65e-27 | 258 |
| GO:004217635 | Thyroid | ATC | regulation of protein catabolic process | 239/6293 | 391/18723 | 2.63e-29 | 1.85e-26 | 239 |
| GO:190336235 | Thyroid | ATC | regulation of cellular protein catabolic process | 168/6293 | 255/18723 | 3.50e-26 | 1.58e-23 | 168 |
| GO:003497633 | Thyroid | ATC | response to endoplasmic reticulum stress | 167/6293 | 256/18723 | 2.62e-25 | 1.03e-22 | 167 |
| GO:190305035 | Thyroid | ATC | regulation of proteolysis involved in cellular protein catabolic process | 146/6293 | 221/18723 | 4.18e-23 | 1.20e-20 | 146 |
| GO:006113633 | Thyroid | ATC | regulation of proteasomal protein catabolic process | 128/6293 | 187/18723 | 1.63e-22 | 4.30e-20 | 128 |
| GO:2000058210 | Thyroid | ATC | regulation of ubiquitin-dependent protein catabolic process | 116/6293 | 164/18723 | 2.15e-22 | 5.43e-20 | 116 |
| Page: 1 2 3 4 5 6 7 8 9 10 11 |
| Pathway ID | Tissue | Disease Stage | Description | Gene Ratio | Bg Ratio | pvalue | p.adjust | qvalue | Count |
| hsa04141211 | Esophagus | ESCC | Protein processing in endoplasmic reticulum | 147/4205 | 174/8465 | 3.29e-22 | 1.10e-19 | 5.64e-20 | 147 |
| hsa0412027 | Esophagus | ESCC | Ubiquitin mediated proteolysis | 122/4205 | 142/8465 | 6.53e-20 | 7.29e-18 | 3.74e-18 | 122 |
| hsa04141310 | Esophagus | ESCC | Protein processing in endoplasmic reticulum | 147/4205 | 174/8465 | 3.29e-22 | 1.10e-19 | 5.64e-20 | 147 |
| hsa0412036 | Esophagus | ESCC | Ubiquitin mediated proteolysis | 122/4205 | 142/8465 | 6.53e-20 | 7.29e-18 | 3.74e-18 | 122 |
| hsa0414130 | Oral cavity | OSCC | Protein processing in endoplasmic reticulum | 143/3704 | 174/8465 | 6.82e-26 | 2.28e-23 | 1.16e-23 | 143 |
| hsa0412020 | Oral cavity | OSCC | Ubiquitin mediated proteolysis | 105/3704 | 142/8465 | 1.83e-13 | 4.37e-12 | 2.23e-12 | 105 |
| hsa04141113 | Oral cavity | OSCC | Protein processing in endoplasmic reticulum | 143/3704 | 174/8465 | 6.82e-26 | 2.28e-23 | 1.16e-23 | 143 |
| hsa04120110 | Oral cavity | OSCC | Ubiquitin mediated proteolysis | 105/3704 | 142/8465 | 1.83e-13 | 4.37e-12 | 2.23e-12 | 105 |
| hsa04141210 | Oral cavity | LP | Protein processing in endoplasmic reticulum | 113/2418 | 174/8465 | 8.74e-24 | 5.82e-22 | 3.76e-22 | 113 |
| hsa0412025 | Oral cavity | LP | Ubiquitin mediated proteolysis | 66/2418 | 142/8465 | 3.74e-06 | 3.46e-05 | 2.23e-05 | 66 |
| hsa0414138 | Oral cavity | LP | Protein processing in endoplasmic reticulum | 113/2418 | 174/8465 | 8.74e-24 | 5.82e-22 | 3.76e-22 | 113 |
| hsa0412035 | Oral cavity | LP | Ubiquitin mediated proteolysis | 66/2418 | 142/8465 | 3.74e-06 | 3.46e-05 | 2.23e-05 | 66 |
| Page: 1 |
Top |
Cell-cell communication analysis |
| Identification of potential cell-cell interactions between two cell types and their ligand-receptor pairs for different disease states |
| Ligand | Receptor | LRpair | Pathway | Tissue | Disease Stage |
| Page: 1 |
Top |
Single-cell gene regulatory network inference analysis |
| Find out the significant the regulons (TFs) and the target genes of each regulon across cell types for different disease states |
| TF | Cell Type | Tissue | Disease Stage | Target Gene | RSS | Regulon Activity |
| ∗The dot plots of a searched regulon are shown for all cell subpopulations in each disease state of each tissue based on the regulon specific score inferred using pySCENIC and by calculating the average expression. |
| Page: 1 |
Top |
Somatic mutation of malignant transformation related genes |
| Annotation of somatic variants for genes involved in malignant transformation |
| Hugo Symbol | Variant Class | Variant Classification | dbSNP RS | HGVSc | HGVSp | HGVSp Short | SWISSPROT | BIOTYPE | SIFT | PolyPhen | Tumor Sample Barcode | Tissue | Histology | Sex | Age | Stage | Therapy Types | Drugs | Outcome |
| FBXO2 | insertion | Nonsense_Mutation | novel | c.263_264insACCA | p.Trp88Ter | p.W88* | Q9UK22 | protein_coding | TCGA-A8-A07G-01 | Breast | breast invasive carcinoma | Female | >=65 | I/II | Chemotherapy | 5-fluorouracil | CR | ||
| FBXO2 | SNV | Missense_Mutation | c.319N>G | p.Arg107Gly | p.R107G | Q9UK22 | protein_coding | tolerated(0.36) | benign(0.182) | TCGA-A6-2671-01 | Colorectum | colon adenocarcinoma | Male | >=65 | III/IV | Other, specify in notesProtocol AMG 20060464 | study | PD | |
| FBXO2 | SNV | Missense_Mutation | c.577C>G | p.Leu193Val | p.L193V | Q9UK22 | protein_coding | deleterious(0.02) | benign(0.119) | TCGA-D5-6529-01 | Colorectum | colon adenocarcinoma | Male | >=65 | I/II | Chemotherapy | oxaliplatinum+ | SD | |
| FBXO2 | insertion | Frame_Shift_Ins | novel | c.534dupA | p.Ala179SerfsTer5 | p.A179Sfs*5 | Q9UK22 | protein_coding | TCGA-A6-5661-01 | Colorectum | colon adenocarcinoma | Female | >=65 | I/II | Unknown | Unknown | SD | ||
| FBXO2 | SNV | Missense_Mutation | novel | c.542N>G | p.Val181Gly | p.V181G | Q9UK22 | protein_coding | deleterious(0) | probably_damaging(0.909) | TCGA-AJ-A3EL-01 | Endometrium | uterine corpus endometrioid carcinoma | Female | <65 | I/II | Unknown | Unknown | SD |
| FBXO2 | SNV | Missense_Mutation | novel | c.400G>A | p.Glu134Lys | p.E134K | Q9UK22 | protein_coding | tolerated(0.33) | benign(0.127) | TCGA-AX-A2HD-01 | Endometrium | uterine corpus endometrioid carcinoma | Female | >=65 | III/IV | Unknown | Unknown | SD |
| FBXO2 | SNV | Missense_Mutation | c.686N>C | p.Asn229Thr | p.N229T | Q9UK22 | protein_coding | tolerated(0.56) | benign(0.103) | TCGA-BS-A0UF-01 | Endometrium | uterine corpus endometrioid carcinoma | Female | >=65 | I/II | Unknown | Unknown | SD | |
| FBXO2 | SNV | Missense_Mutation | rs369589187 | c.529N>T | p.Arg177Cys | p.R177C | Q9UK22 | protein_coding | tolerated(0.15) | probably_damaging(0.979) | TCGA-E6-A1M0-01 | Endometrium | uterine corpus endometrioid carcinoma | Female | <65 | III/IV | Chemotherapy | carboplatin | SD |
| FBXO2 | SNV | Missense_Mutation | novel | c.734N>A | p.Ser245Asn | p.S245N | Q9UK22 | protein_coding | tolerated(0.84) | benign(0) | TCGA-EY-A549-01 | Endometrium | uterine corpus endometrioid carcinoma | Female | >=65 | I/II | Unknown | Unknown | SD |
| FBXO2 | insertion | In_Frame_Ins | rs746515382 | c.808_809insTCCGCTTCG | p.Val267_Phe269dup | p.V267_F269dup | Q9UK22 | protein_coding | TCGA-AP-A05O-01 | Endometrium | uterine corpus endometrioid carcinoma | Female | >=65 | I/II | Chemotherapy | carboplatin | PD |
| Page: 1 2 |
Top |
Related drugs of malignant transformation related genes |
| Identification of chemicals and drugs interact with genes involved in malignant transfromation |
| (DGIdb 4.0) |
| Entrez ID | Symbol | Category | Interaction Types | Drug Claim Name | Drug Name | PMIDs |
| Page: 1 |

Copyright 2023-Present -The University of Texas Health Science Center at Houston |