
|
|||||
|
 | |
| |
| |
| |
| |
| |
|
Gene: EIF2AK4 |
Gene summary for EIF2AK4 |
| Gene information | Species | Human | Gene symbol | EIF2AK4 | Gene ID | 440275 |
| Gene name | eukaryotic translation initiation factor 2 alpha kinase 4 | |
| Gene Alias | GCN2 | |
| Cytomap | 15q15.1 | |
| Gene Type | protein-coding | GO ID | GO:0000075 | UniProtAcc | Q9P2K8 |
Top |
Malignant transformation analysis |
| Identification of the aberrant gene expression in precancerous and cancerous lesions by comparing the gene expression of stem-like cells in diseased tissues with normal stem cells |
| Entrez ID | Symbol | Replicates | Species | Organ | Tissue | Adj P-value | Log2FC | Malignancy |
| 440275 | EIF2AK4 | LZE2T | Human | Esophagus | ESCC | 1.25e-03 | 8.29e-01 | 0.082 |
| 440275 | EIF2AK4 | LZE4T | Human | Esophagus | ESCC | 5.86e-11 | 5.37e-01 | 0.0811 |
| 440275 | EIF2AK4 | LZE20T | Human | Esophagus | ESCC | 2.15e-04 | 1.19e-01 | 0.0662 |
| 440275 | EIF2AK4 | LZE24T | Human | Esophagus | ESCC | 2.08e-14 | 4.77e-01 | 0.0596 |
| 440275 | EIF2AK4 | LZE21T | Human | Esophagus | ESCC | 2.87e-02 | 1.06e-01 | 0.0655 |
| 440275 | EIF2AK4 | P1T-E | Human | Esophagus | ESCC | 1.21e-21 | 9.74e-01 | 0.0875 |
| 440275 | EIF2AK4 | P2T-E | Human | Esophagus | ESCC | 3.00e-43 | 6.76e-01 | 0.1177 |
| 440275 | EIF2AK4 | P4T-E | Human | Esophagus | ESCC | 7.45e-39 | 8.73e-01 | 0.1323 |
| 440275 | EIF2AK4 | P5T-E | Human | Esophagus | ESCC | 2.23e-21 | 3.77e-01 | 0.1327 |
| 440275 | EIF2AK4 | P8T-E | Human | Esophagus | ESCC | 3.63e-57 | 9.44e-01 | 0.0889 |
| 440275 | EIF2AK4 | P9T-E | Human | Esophagus | ESCC | 1.25e-22 | 5.69e-01 | 0.1131 |
| 440275 | EIF2AK4 | P10T-E | Human | Esophagus | ESCC | 1.09e-46 | 7.72e-01 | 0.116 |
| 440275 | EIF2AK4 | P11T-E | Human | Esophagus | ESCC | 9.61e-13 | 6.16e-01 | 0.1426 |
| 440275 | EIF2AK4 | P12T-E | Human | Esophagus | ESCC | 1.30e-46 | 8.93e-01 | 0.1122 |
| 440275 | EIF2AK4 | P15T-E | Human | Esophagus | ESCC | 1.36e-12 | 4.26e-01 | 0.1149 |
| 440275 | EIF2AK4 | P16T-E | Human | Esophagus | ESCC | 7.50e-34 | 5.73e-01 | 0.1153 |
| 440275 | EIF2AK4 | P17T-E | Human | Esophagus | ESCC | 3.19e-15 | 6.14e-01 | 0.1278 |
| 440275 | EIF2AK4 | P19T-E | Human | Esophagus | ESCC | 5.55e-06 | 4.98e-01 | 0.1662 |
| 440275 | EIF2AK4 | P20T-E | Human | Esophagus | ESCC | 4.82e-30 | 7.13e-01 | 0.1124 |
| 440275 | EIF2AK4 | P21T-E | Human | Esophagus | ESCC | 4.96e-39 | 6.73e-01 | 0.1617 |
| Page: 1 2 3 4 5 6 |
| Tissue | Expression Dynamics | Abbreviation |
| Esophagus | 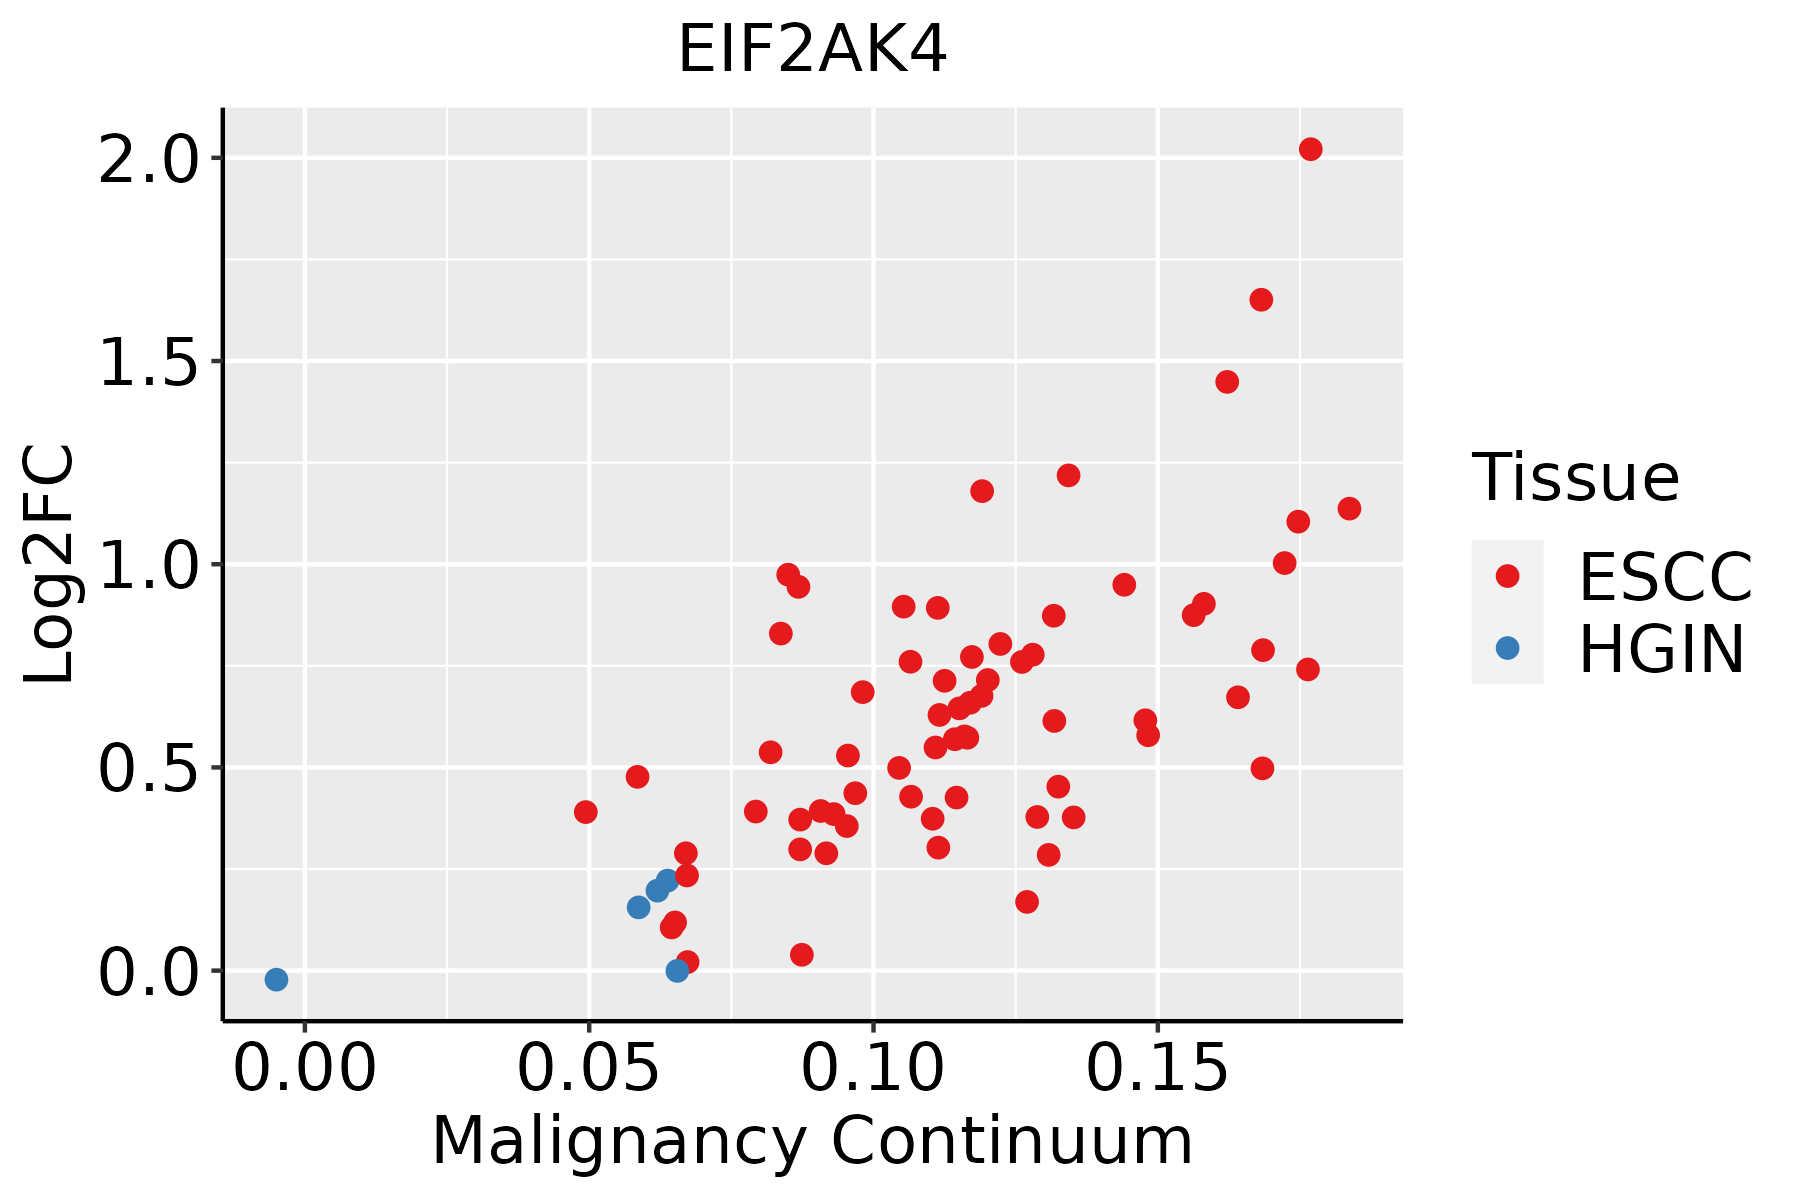 | ESCC: Esophageal squamous cell carcinoma |
| HGIN: High-grade intraepithelial neoplasias | ||
| LGIN: Low-grade intraepithelial neoplasias | ||
| Liver | 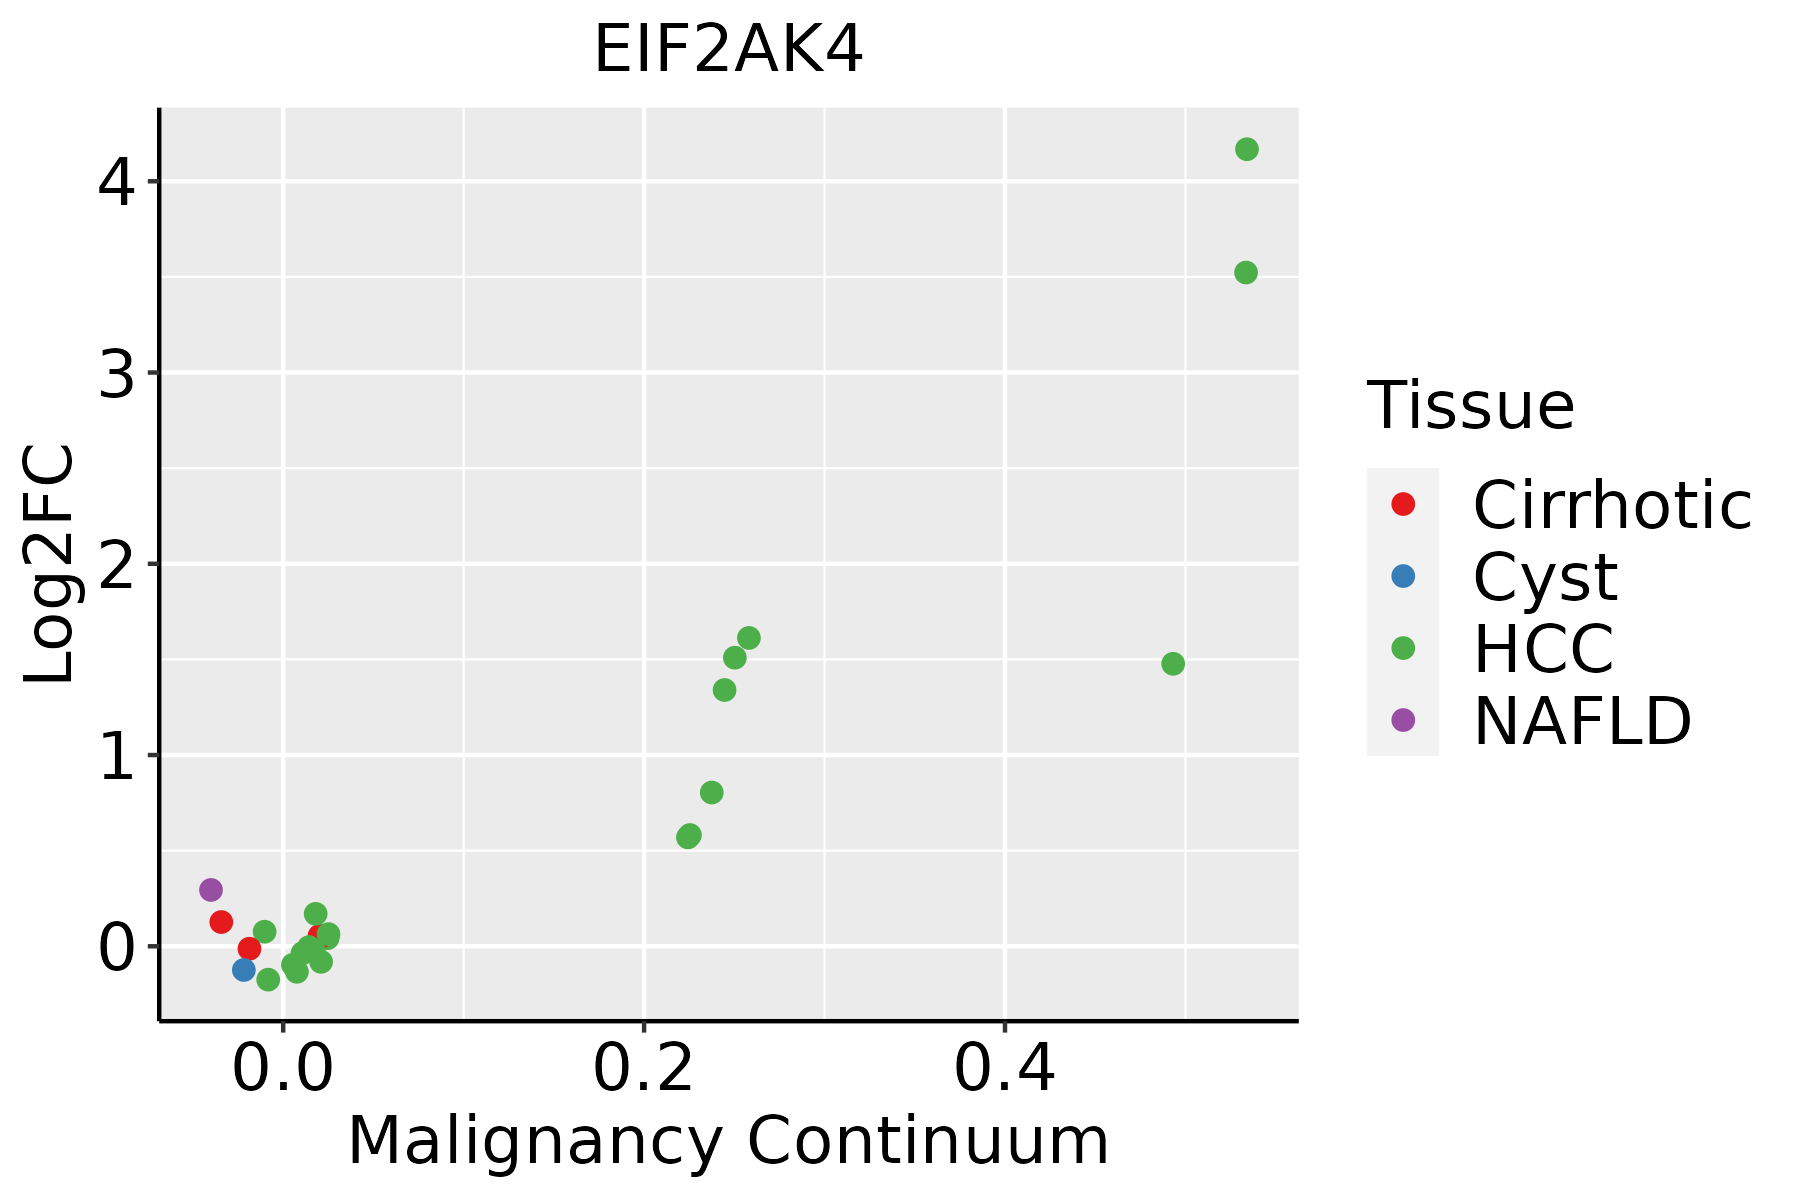 | HCC: Hepatocellular carcinoma |
| NAFLD: Non-alcoholic fatty liver disease | ||
| Oral Cavity | 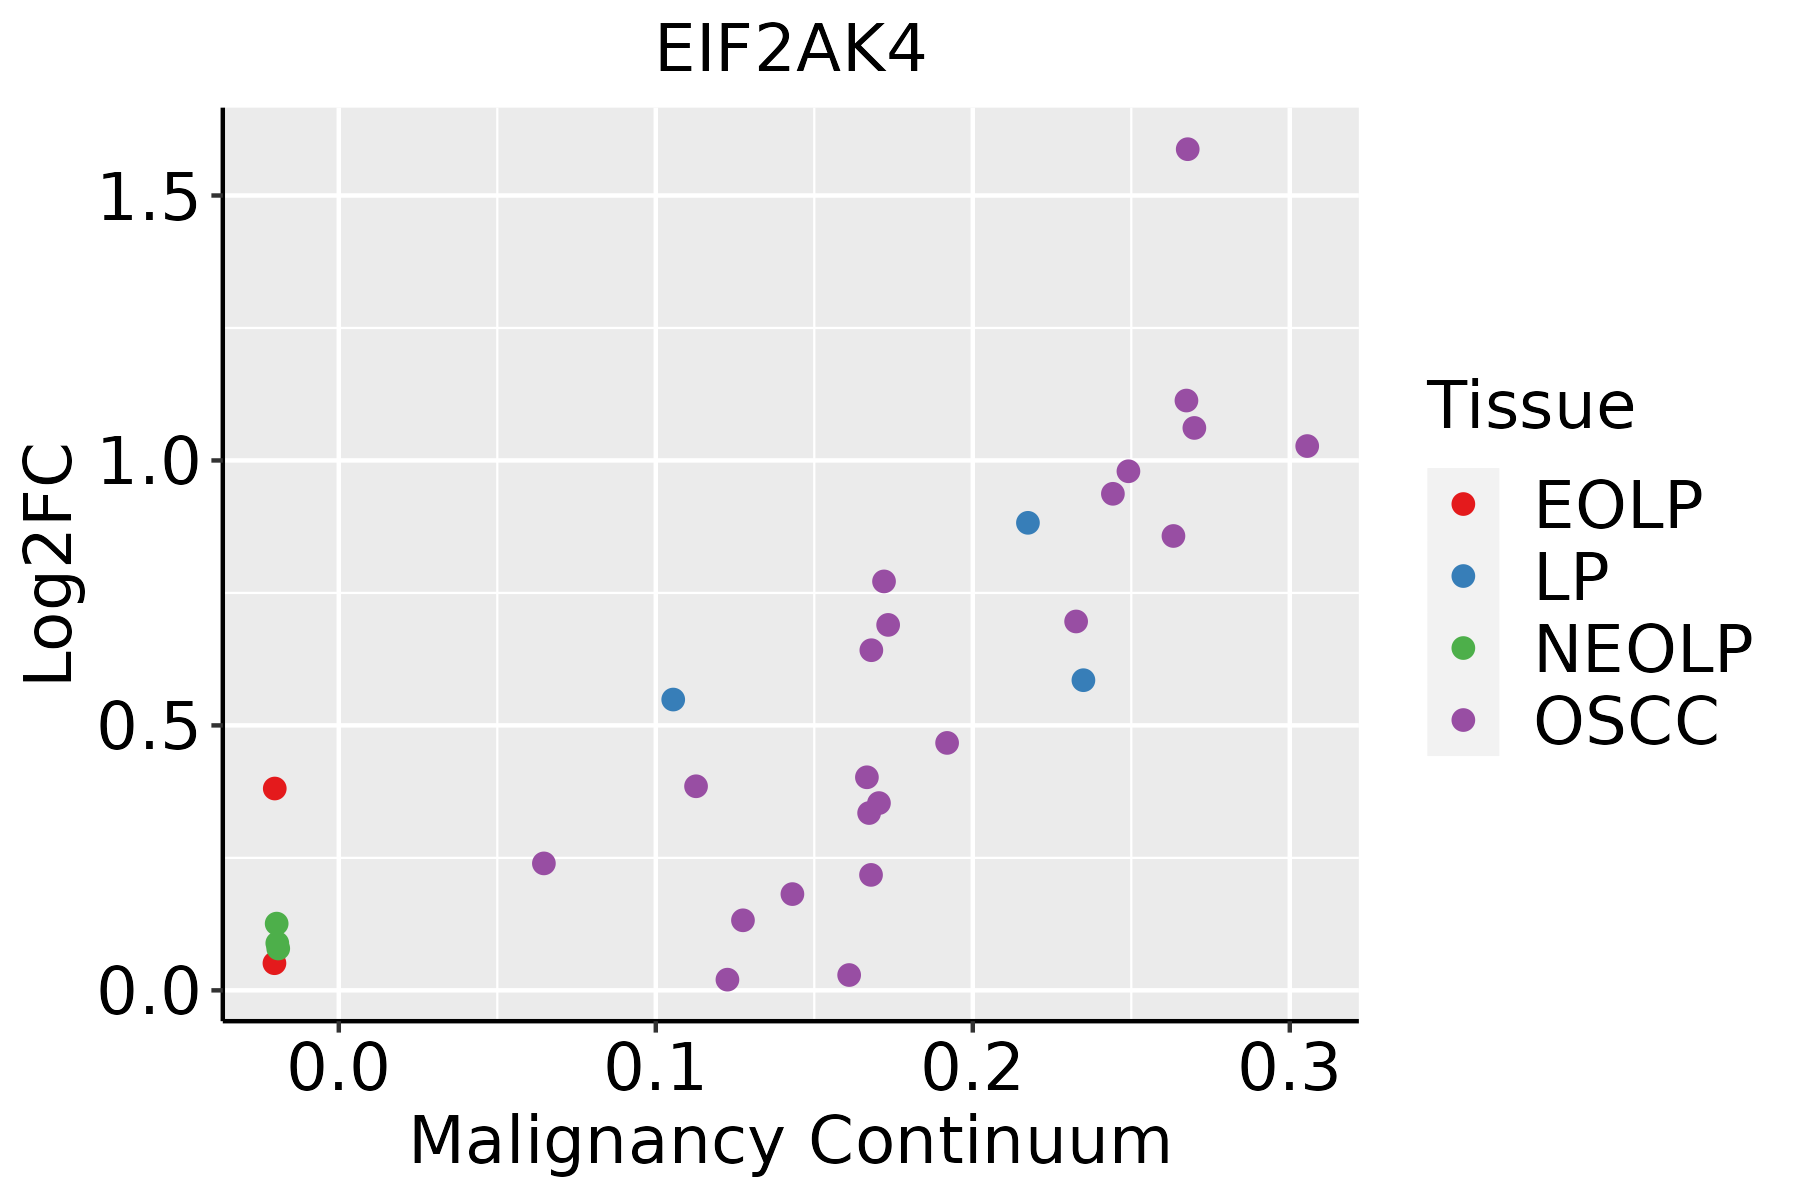 | EOLP: Erosive Oral lichen planus |
| LP: leukoplakia | ||
| NEOLP: Non-erosive oral lichen planus | ||
| OSCC: Oral squamous cell carcinoma | ||
| Prostate | 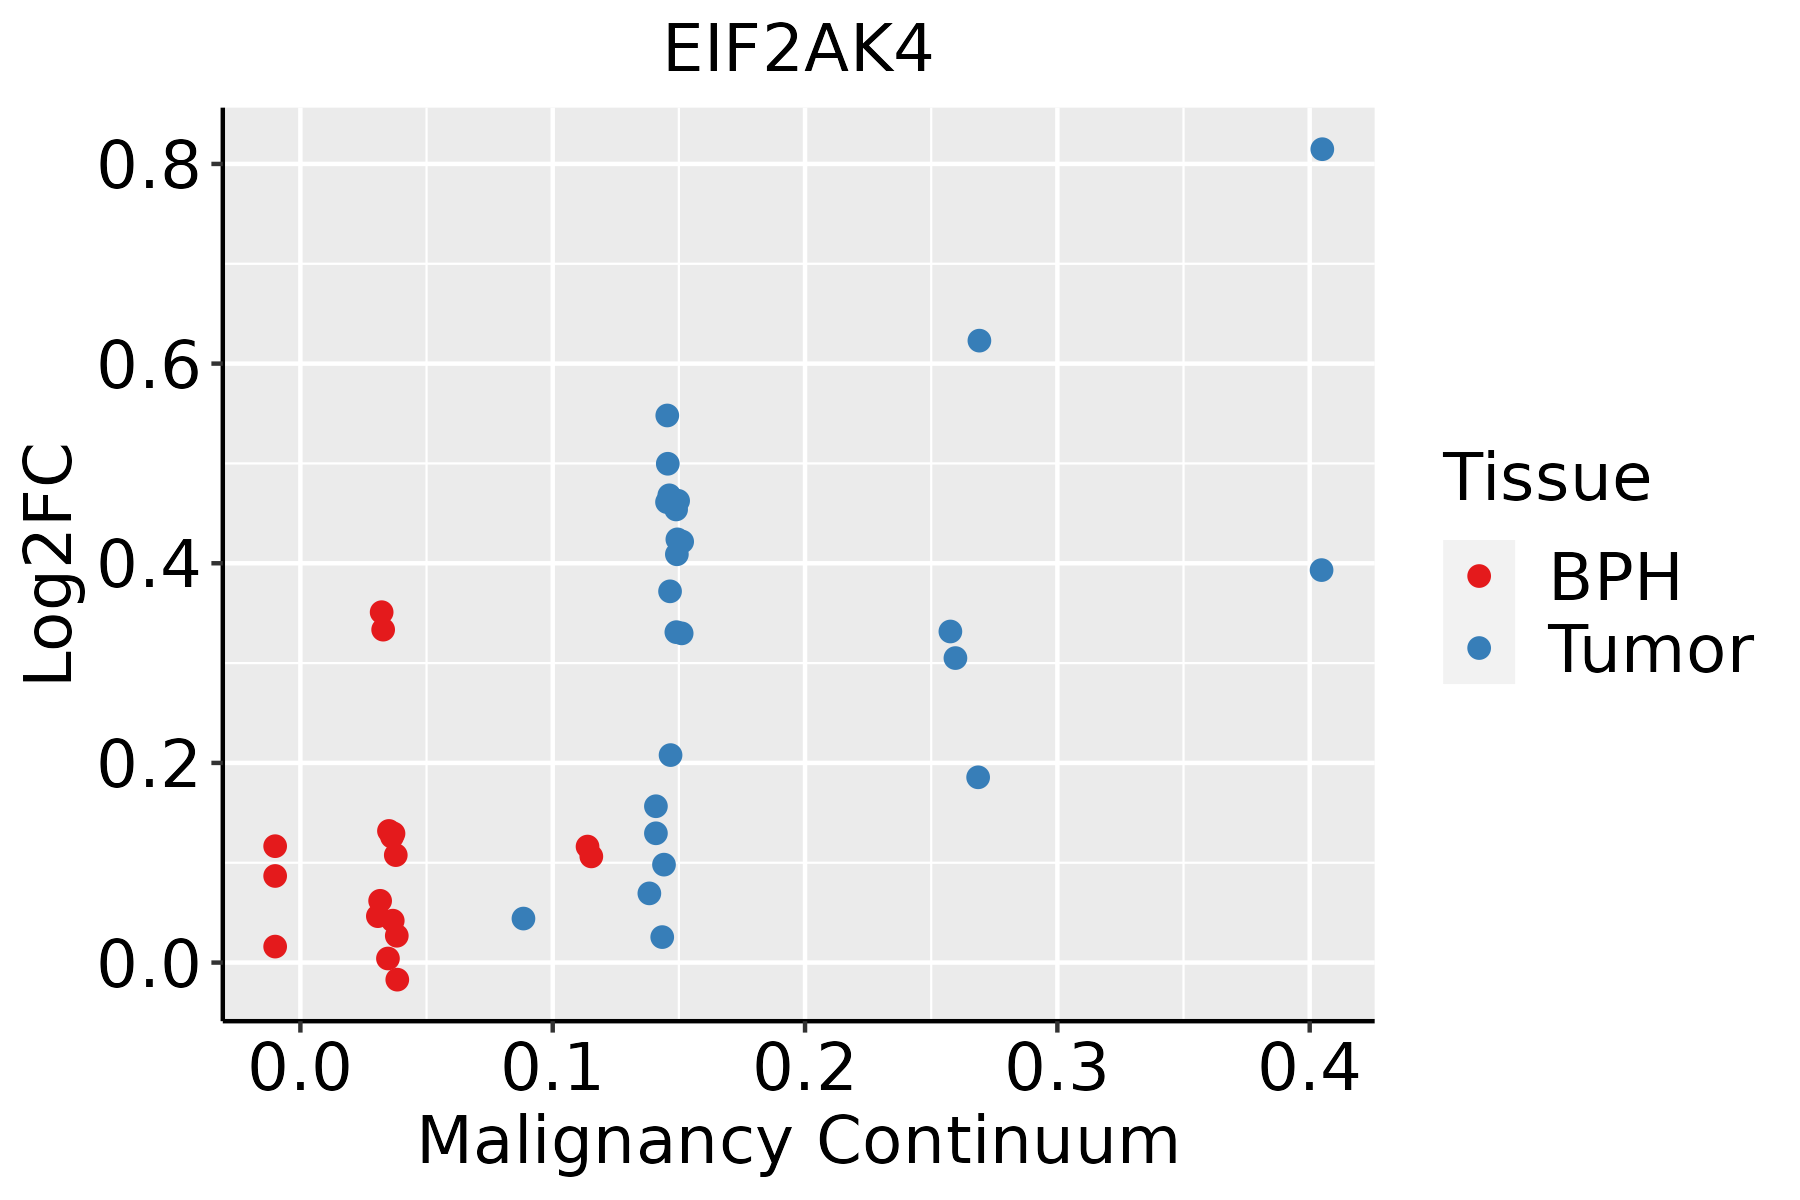 | BPH: Benign Prostatic Hyperplasia |
| Skin |  | AK: Actinic keratosis |
| cSCC: Cutaneous squamous cell carcinoma | ||
| SCCIS:squamous cell carcinoma in situ | ||
| Thyroid |  | ATC: Anaplastic thyroid cancer |
| HT: Hashimoto's thyroiditis | ||
| PTC: Papillary thyroid cancer |
| ∗log2FC in expression of this searched gene in stem-like cells from each diseased tissue sample relative to stem-like cells in normal samples in each tissue plotted against the malignancy continuum. Samples are colored based on if they are from different disease stage. |
Top |
Malignant transformation related pathway analysis |
| Find out the enriched GO biological processes and KEGG pathways involved in transition from healthy to precancer to cancer |
| Tissue | Disease Stage | Enriched GO biological Processes |
| Colorectum | AD |  |
| Colorectum | SER |  |
| Colorectum | MSS |  |
| Colorectum | MSI-H |  |
| Colorectum | FAP |  |
| ∗Top 15 enriched GO BP terms are showed in the bar plot of each disease state in each tissue. Each row represents a significant GO biological process which is colored according to the -log10(p.adjust). |
| Page: 1 2 3 4 5 6 7 8 9 |
| GO ID | Tissue | Disease Stage | Description | Gene Ratio | Bg Ratio | pvalue | p.adjust | Count |
| GO:00358218 | Oral cavity | OSCC | modulation of process of other organism | 64/7305 | 106/18723 | 6.70e-06 | 7.36e-05 | 64 |
| GO:001908110 | Oral cavity | OSCC | viral translation | 15/7305 | 16/18723 | 7.44e-06 | 8.08e-05 | 15 |
| GO:00315704 | Oral cavity | OSCC | DNA integrity checkpoint | 72/7305 | 123/18723 | 8.77e-06 | 9.31e-05 | 72 |
| GO:000926616 | Oral cavity | OSCC | response to temperature stimulus | 98/7305 | 178/18723 | 9.78e-06 | 1.03e-04 | 98 |
| GO:00518517 | Oral cavity | OSCC | modulation by host of symbiont process | 40/7305 | 60/18723 | 1.32e-05 | 1.33e-04 | 40 |
| GO:00000774 | Oral cavity | OSCC | DNA damage checkpoint | 67/7305 | 115/18723 | 2.20e-05 | 2.08e-04 | 67 |
| GO:00459482 | Oral cavity | OSCC | positive regulation of translational initiation | 23/7305 | 30/18723 | 3.05e-05 | 2.79e-04 | 23 |
| GO:00435584 | Oral cavity | OSCC | regulation of translational initiation in response to stress | 13/7305 | 14/18723 | 4.31e-05 | 3.71e-04 | 13 |
| GO:01404674 | Oral cavity | OSCC | integrated stress response signaling | 18/7305 | 22/18723 | 5.05e-05 | 4.23e-04 | 18 |
| GO:19909283 | Oral cavity | OSCC | response to amino acid starvation | 33/7305 | 49/18723 | 5.49e-05 | 4.54e-04 | 33 |
| GO:00094164 | Oral cavity | OSCC | response to light stimulus | 159/7305 | 320/18723 | 5.98e-05 | 4.92e-04 | 159 |
| GO:00506883 | Oral cavity | OSCC | regulation of defense response to virus | 42/7305 | 69/18723 | 1.92e-04 | 1.29e-03 | 42 |
| GO:00517029 | Oral cavity | OSCC | biological process involved in interaction with symbiont | 54/7305 | 94/18723 | 2.20e-04 | 1.44e-03 | 54 |
| GO:00341983 | Oral cavity | OSCC | cellular response to amino acid starvation | 30/7305 | 46/18723 | 2.86e-04 | 1.80e-03 | 30 |
| GO:00485889 | Oral cavity | OSCC | developmental cell growth | 116/7305 | 234/18723 | 6.20e-04 | 3.50e-03 | 116 |
| GO:00605609 | Oral cavity | OSCC | developmental growth involved in morphogenesis | 116/7305 | 234/18723 | 6.20e-04 | 3.50e-03 | 116 |
| GO:0071482 | Oral cavity | OSCC | cellular response to light stimulus | 66/7305 | 123/18723 | 6.74e-04 | 3.77e-03 | 66 |
| GO:00109984 | Oral cavity | OSCC | regulation of translational initiation by eIF2 alpha phosphorylation | 9/7305 | 10/18723 | 1.36e-03 | 6.62e-03 | 9 |
| GO:00447887 | Oral cavity | OSCC | modulation by host of viral process | 20/7305 | 30/18723 | 1.99e-03 | 9.23e-03 | 20 |
| GO:19901388 | Oral cavity | OSCC | neuron projection extension | 86/7305 | 172/18723 | 2.13e-03 | 9.80e-03 | 86 |
| Page: 1 2 3 4 5 6 7 8 9 10 11 12 13 14 15 16 17 18 19 20 21 22 23 24 25 26 27 28 29 30 |
| Pathway ID | Tissue | Disease Stage | Description | Gene Ratio | Bg Ratio | pvalue | p.adjust | qvalue | Count |
| hsa04141211 | Esophagus | ESCC | Protein processing in endoplasmic reticulum | 147/4205 | 174/8465 | 3.29e-22 | 1.10e-19 | 5.64e-20 | 147 |
| hsa0414010 | Esophagus | ESCC | Autophagy - animal | 101/4205 | 141/8465 | 7.60e-08 | 6.21e-07 | 3.18e-07 | 101 |
| hsa051609 | Esophagus | ESCC | Hepatitis C | 107/4205 | 157/8465 | 1.75e-06 | 1.08e-05 | 5.55e-06 | 107 |
| hsa051629 | Esophagus | ESCC | Measles | 90/4205 | 139/8465 | 2.16e-04 | 7.87e-04 | 4.03e-04 | 90 |
| hsa04141310 | Esophagus | ESCC | Protein processing in endoplasmic reticulum | 147/4205 | 174/8465 | 3.29e-22 | 1.10e-19 | 5.64e-20 | 147 |
| hsa0414015 | Esophagus | ESCC | Autophagy - animal | 101/4205 | 141/8465 | 7.60e-08 | 6.21e-07 | 3.18e-07 | 101 |
| hsa0516016 | Esophagus | ESCC | Hepatitis C | 107/4205 | 157/8465 | 1.75e-06 | 1.08e-05 | 5.55e-06 | 107 |
| hsa0516213 | Esophagus | ESCC | Measles | 90/4205 | 139/8465 | 2.16e-04 | 7.87e-04 | 4.03e-04 | 90 |
| hsa0414122 | Liver | HCC | Protein processing in endoplasmic reticulum | 146/4020 | 174/8465 | 7.34e-24 | 2.46e-21 | 1.37e-21 | 146 |
| hsa0414021 | Liver | HCC | Autophagy - animal | 99/4020 | 141/8465 | 3.08e-08 | 4.70e-07 | 2.61e-07 | 99 |
| hsa0516021 | Liver | HCC | Hepatitis C | 94/4020 | 157/8465 | 1.11e-03 | 4.10e-03 | 2.28e-03 | 94 |
| hsa0414132 | Liver | HCC | Protein processing in endoplasmic reticulum | 146/4020 | 174/8465 | 7.34e-24 | 2.46e-21 | 1.37e-21 | 146 |
| hsa0414031 | Liver | HCC | Autophagy - animal | 99/4020 | 141/8465 | 3.08e-08 | 4.70e-07 | 2.61e-07 | 99 |
| hsa0516031 | Liver | HCC | Hepatitis C | 94/4020 | 157/8465 | 1.11e-03 | 4.10e-03 | 2.28e-03 | 94 |
| hsa0414130 | Oral cavity | OSCC | Protein processing in endoplasmic reticulum | 143/3704 | 174/8465 | 6.82e-26 | 2.28e-23 | 1.16e-23 | 143 |
| hsa051608 | Oral cavity | OSCC | Hepatitis C | 103/3704 | 157/8465 | 2.17e-08 | 1.96e-07 | 9.99e-08 | 103 |
| hsa041409 | Oral cavity | OSCC | Autophagy - animal | 94/3704 | 141/8465 | 2.73e-08 | 2.38e-07 | 1.21e-07 | 94 |
| hsa051628 | Oral cavity | OSCC | Measles | 90/3704 | 139/8465 | 4.10e-07 | 2.50e-06 | 1.27e-06 | 90 |
| hsa04141113 | Oral cavity | OSCC | Protein processing in endoplasmic reticulum | 143/3704 | 174/8465 | 6.82e-26 | 2.28e-23 | 1.16e-23 | 143 |
| hsa0516015 | Oral cavity | OSCC | Hepatitis C | 103/3704 | 157/8465 | 2.17e-08 | 1.96e-07 | 9.99e-08 | 103 |
| Page: 1 2 3 |
Top |
Cell-cell communication analysis |
| Identification of potential cell-cell interactions between two cell types and their ligand-receptor pairs for different disease states |
| Ligand | Receptor | LRpair | Pathway | Tissue | Disease Stage |
| Page: 1 |
Top |
Single-cell gene regulatory network inference analysis |
| Find out the significant the regulons (TFs) and the target genes of each regulon across cell types for different disease states |
| TF | Cell Type | Tissue | Disease Stage | Target Gene | RSS | Regulon Activity |
| ∗The dot plots of a searched regulon are shown for all cell subpopulations in each disease state of each tissue based on the regulon specific score inferred using pySCENIC and by calculating the average expression. |
| Page: 1 |
Top |
Somatic mutation of malignant transformation related genes |
| Annotation of somatic variants for genes involved in malignant transformation |
| Hugo Symbol | Variant Class | Variant Classification | dbSNP RS | HGVSc | HGVSp | HGVSp Short | SWISSPROT | BIOTYPE | SIFT | PolyPhen | Tumor Sample Barcode | Tissue | Histology | Sex | Age | Stage | Therapy Types | Drugs | Outcome |
| EIF2AK4 | SNV | Missense_Mutation | novel | c.1790N>T | p.Gly597Val | p.G597V | Q9P2K8 | protein_coding | deleterious(0) | probably_damaging(1) | TCGA-A2-A4RX-01 | Breast | breast invasive carcinoma | Female | >=65 | I/II | Unknown | Unknown | SD |
| EIF2AK4 | SNV | Missense_Mutation | novel | c.236N>A | p.Cys79Tyr | p.C79Y | Q9P2K8 | protein_coding | deleterious(0) | probably_damaging(1) | TCGA-A7-A6VV-01 | Breast | breast invasive carcinoma | Female | <65 | I/II | Chemotherapy | cyclophosphamide | CR |
| EIF2AK4 | SNV | Missense_Mutation | c.3685G>A | p.Asp1229Asn | p.D1229N | Q9P2K8 | protein_coding | deleterious(0.03) | probably_damaging(0.999) | TCGA-AC-A23H-01 | Breast | breast invasive carcinoma | Female | >=65 | I/II | Unknown | Unknown | PD | |
| EIF2AK4 | SNV | Missense_Mutation | c.3796G>A | p.Asp1266Asn | p.D1266N | Q9P2K8 | protein_coding | tolerated(0.96) | benign(0.01) | TCGA-AC-A23H-01 | Breast | breast invasive carcinoma | Female | >=65 | I/II | Unknown | Unknown | PD | |
| EIF2AK4 | SNV | Missense_Mutation | c.1724N>C | p.Phe575Ser | p.F575S | Q9P2K8 | protein_coding | tolerated(0.2) | benign(0.003) | TCGA-AO-A1KR-01 | Breast | breast invasive carcinoma | Female | <65 | I/II | Chemotherapy | cyclophosphamide | SD | |
| EIF2AK4 | SNV | Missense_Mutation | rs763402151 | c.1378N>C | p.Glu460Gln | p.E460Q | Q9P2K8 | protein_coding | tolerated(0.09) | probably_damaging(0.999) | TCGA-BH-A0B6-01 | Breast | breast invasive carcinoma | Female | <65 | I/II | Unknown | Unknown | SD |
| EIF2AK4 | SNV | Missense_Mutation | c.4701N>C | p.Gln1567His | p.Q1567H | Q9P2K8 | protein_coding | tolerated(0.76) | benign(0.007) | TCGA-BH-A0H5-01 | Breast | breast invasive carcinoma | Female | <65 | I/II | Chemotherapy | cytoxan | CR | |
| EIF2AK4 | SNV | Missense_Mutation | rs752767858 | c.2345N>C | p.Gly782Ala | p.G782A | Q9P2K8 | protein_coding | tolerated(0.67) | benign(0.019) | TCGA-C8-A12X-01 | Breast | breast invasive carcinoma | Female | <65 | I/II | Unknown | Unknown | SD |
| EIF2AK4 | SNV | Missense_Mutation | novel | c.301G>A | p.Glu101Lys | p.E101K | Q9P2K8 | protein_coding | deleterious(0.01) | possibly_damaging(0.808) | TCGA-C8-A26Y-01 | Breast | breast invasive carcinoma | Female | >=65 | I/II | Unknown | Unknown | SD |
| EIF2AK4 | SNV | Missense_Mutation | c.3791A>C | p.Lys1264Thr | p.K1264T | Q9P2K8 | protein_coding | deleterious(0.01) | probably_damaging(1) | TCGA-D8-A1JL-01 | Breast | breast invasive carcinoma | Female | >=65 | I/II | Unknown | Unknown | SD |
| Page: 1 2 3 4 5 6 7 8 9 10 11 12 13 14 |
Top |
Related drugs of malignant transformation related genes |
| Identification of chemicals and drugs interact with genes involved in malignant transfromation |
| (DGIdb 4.0) |
| Entrez ID | Symbol | Category | Interaction Types | Drug Claim Name | Drug Name | PMIDs |
| 440275 | EIF2AK4 | KINASE, ENZYME, SERINE THREONINE KINASE, DRUGGABLE GENOME | olanzapine | OLANZAPINE | 24751813 | |
| 440275 | EIF2AK4 | KINASE, ENZYME, SERINE THREONINE KINASE, DRUGGABLE GENOME | risperidone | RISPERIDONE | 24751813 | |
| 440275 | EIF2AK4 | KINASE, ENZYME, SERINE THREONINE KINASE, DRUGGABLE GENOME | inhibitor | 249565849 | ||
| 440275 | EIF2AK4 | KINASE, ENZYME, SERINE THREONINE KINASE, DRUGGABLE GENOME | quetiapine | QUETIAPINE | 24751813 | |
| 440275 | EIF2AK4 | KINASE, ENZYME, SERINE THREONINE KINASE, DRUGGABLE GENOME | inhibitor | HESPERADIN | HESPERADIN | 19035792 |
| 440275 | EIF2AK4 | KINASE, ENZYME, SERINE THREONINE KINASE, DRUGGABLE GENOME | haloperidol | HALOPERIDOL | 27023437,24751813 | |
| 440275 | EIF2AK4 | KINASE, ENZYME, SERINE THREONINE KINASE, DRUGGABLE GENOME | ziprasidone | ZIPRASIDONE | 24751813 |
| Page: 1 |

Copyright 2023-Present -The University of Texas Health Science Center at Houston |