
|
|||||
|
 | |
| |
| |
| |
| |
| |
|
Gene: DGUOK |
Gene summary for DGUOK |
| Gene information | Species | Human | Gene symbol | DGUOK | Gene ID | 1716 |
| Gene name | deoxyguanosine kinase | |
| Gene Alias | MTDPS3 | |
| Cytomap | 2p13.1 | |
| Gene Type | protein-coding | GO ID | GO:0006091 | UniProtAcc | Q16854 |
Top |
Malignant transformation analysis |
| Identification of the aberrant gene expression in precancerous and cancerous lesions by comparing the gene expression of stem-like cells in diseased tissues with normal stem cells |
| Entrez ID | Symbol | Replicates | Species | Organ | Tissue | Adj P-value | Log2FC | Malignancy |
| 1716 | DGUOK | AEH-subject1 | Human | Endometrium | AEH | 2.33e-13 | -3.34e-01 | -0.3059 |
| 1716 | DGUOK | AEH-subject2 | Human | Endometrium | AEH | 1.99e-10 | -2.91e-01 | -0.2525 |
| 1716 | DGUOK | AEH-subject3 | Human | Endometrium | AEH | 1.90e-12 | -3.24e-01 | -0.2576 |
| 1716 | DGUOK | AEH-subject4 | Human | Endometrium | AEH | 1.72e-13 | -4.23e-01 | -0.2657 |
| 1716 | DGUOK | AEH-subject5 | Human | Endometrium | AEH | 2.46e-02 | -2.26e-01 | -0.2953 |
| 1716 | DGUOK | EEC-subject1 | Human | Endometrium | EEC | 4.37e-13 | -3.24e-01 | -0.2682 |
| 1716 | DGUOK | EEC-subject2 | Human | Endometrium | EEC | 3.38e-21 | -3.91e-01 | -0.2607 |
| 1716 | DGUOK | EEC-subject3 | Human | Endometrium | EEC | 1.66e-38 | -4.44e-01 | -0.2525 |
| 1716 | DGUOK | EEC-subject4 | Human | Endometrium | EEC | 7.56e-08 | -2.28e-01 | -0.2571 |
| 1716 | DGUOK | EEC-subject5 | Human | Endometrium | EEC | 7.12e-08 | -2.69e-01 | -0.249 |
| 1716 | DGUOK | GSM5276934 | Human | Endometrium | EEC | 1.90e-03 | -1.29e-01 | -0.0913 |
| 1716 | DGUOK | GSM6177620_NYU_UCEC1_lib1_lib1 | Human | Endometrium | EEC | 4.95e-29 | -2.20e-01 | -0.1869 |
| 1716 | DGUOK | GSM6177620_NYU_UCEC1_lib2_lib2 | Human | Endometrium | EEC | 8.42e-35 | -2.42e-01 | -0.1875 |
| 1716 | DGUOK | GSM6177620_NYU_UCEC1_lib3_lib3 | Human | Endometrium | EEC | 2.37e-37 | -1.25e-01 | -0.1883 |
| 1716 | DGUOK | GSM6177621_NYU_UCEC2_lib1_lib1 | Human | Endometrium | EEC | 1.47e-27 | -1.86e-01 | -0.1934 |
| 1716 | DGUOK | GSM6177622_NYU_UCEC3_lib1_lib1 | Human | Endometrium | EEC | 1.82e-51 | -2.79e-01 | -0.1917 |
| 1716 | DGUOK | GSM6177622_NYU_UCEC3_lib2_lib2 | Human | Endometrium | EEC | 1.33e-45 | -3.46e-01 | -0.1916 |
| 1716 | DGUOK | GSM6177623_NYU_UCEC3_Vis | Human | Endometrium | EEC | 1.17e-09 | -1.60e-01 | -0.1269 |
| 1716 | DGUOK | LZE2T | Human | Esophagus | ESCC | 1.20e-04 | 1.33e+00 | 0.082 |
| 1716 | DGUOK | LZE4T | Human | Esophagus | ESCC | 1.51e-25 | 1.08e+00 | 0.0811 |
| Page: 1 2 3 4 5 6 7 8 |
| Tissue | Expression Dynamics | Abbreviation |
| Endometrium |  | AEH: Atypical endometrial hyperplasia |
| EEC: Endometrioid Cancer | ||
| Esophagus | 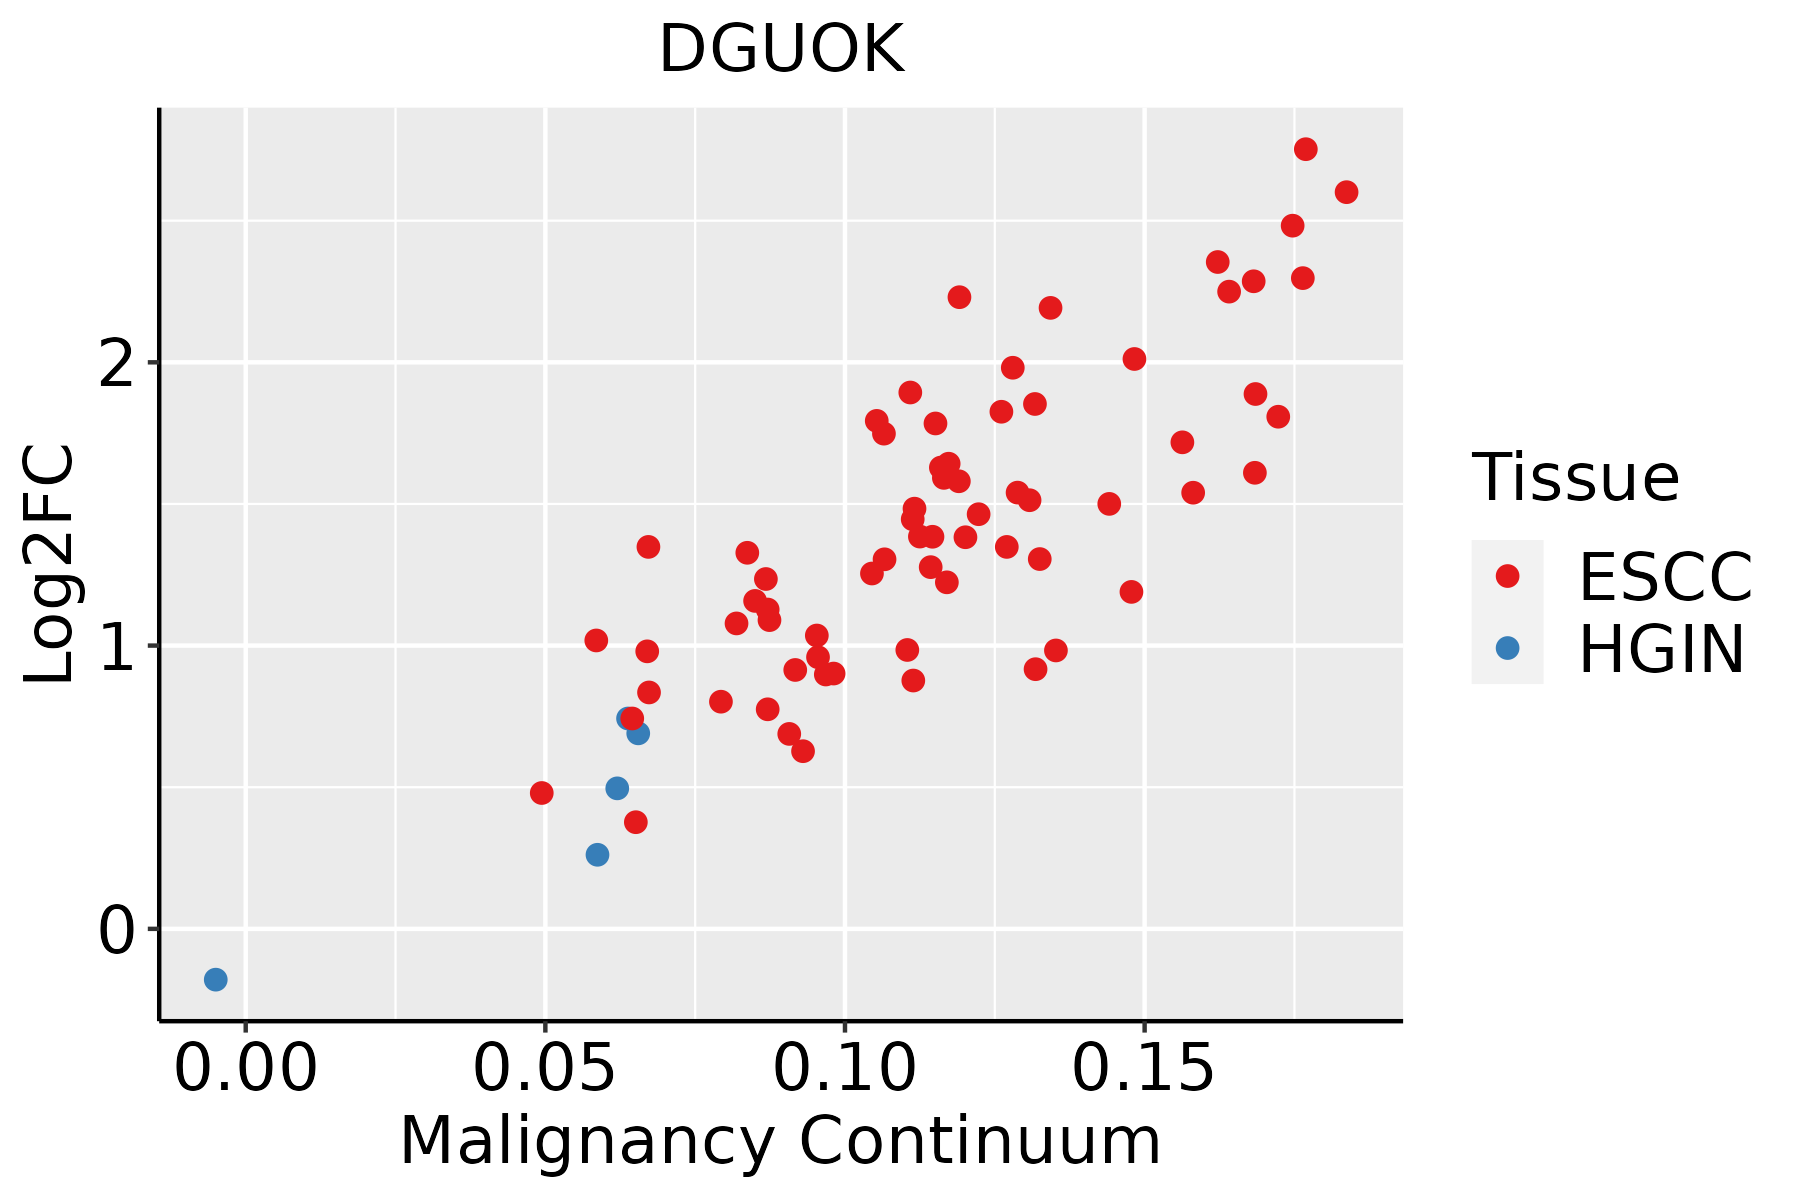 | ESCC: Esophageal squamous cell carcinoma |
| HGIN: High-grade intraepithelial neoplasias | ||
| LGIN: Low-grade intraepithelial neoplasias | ||
| Liver | 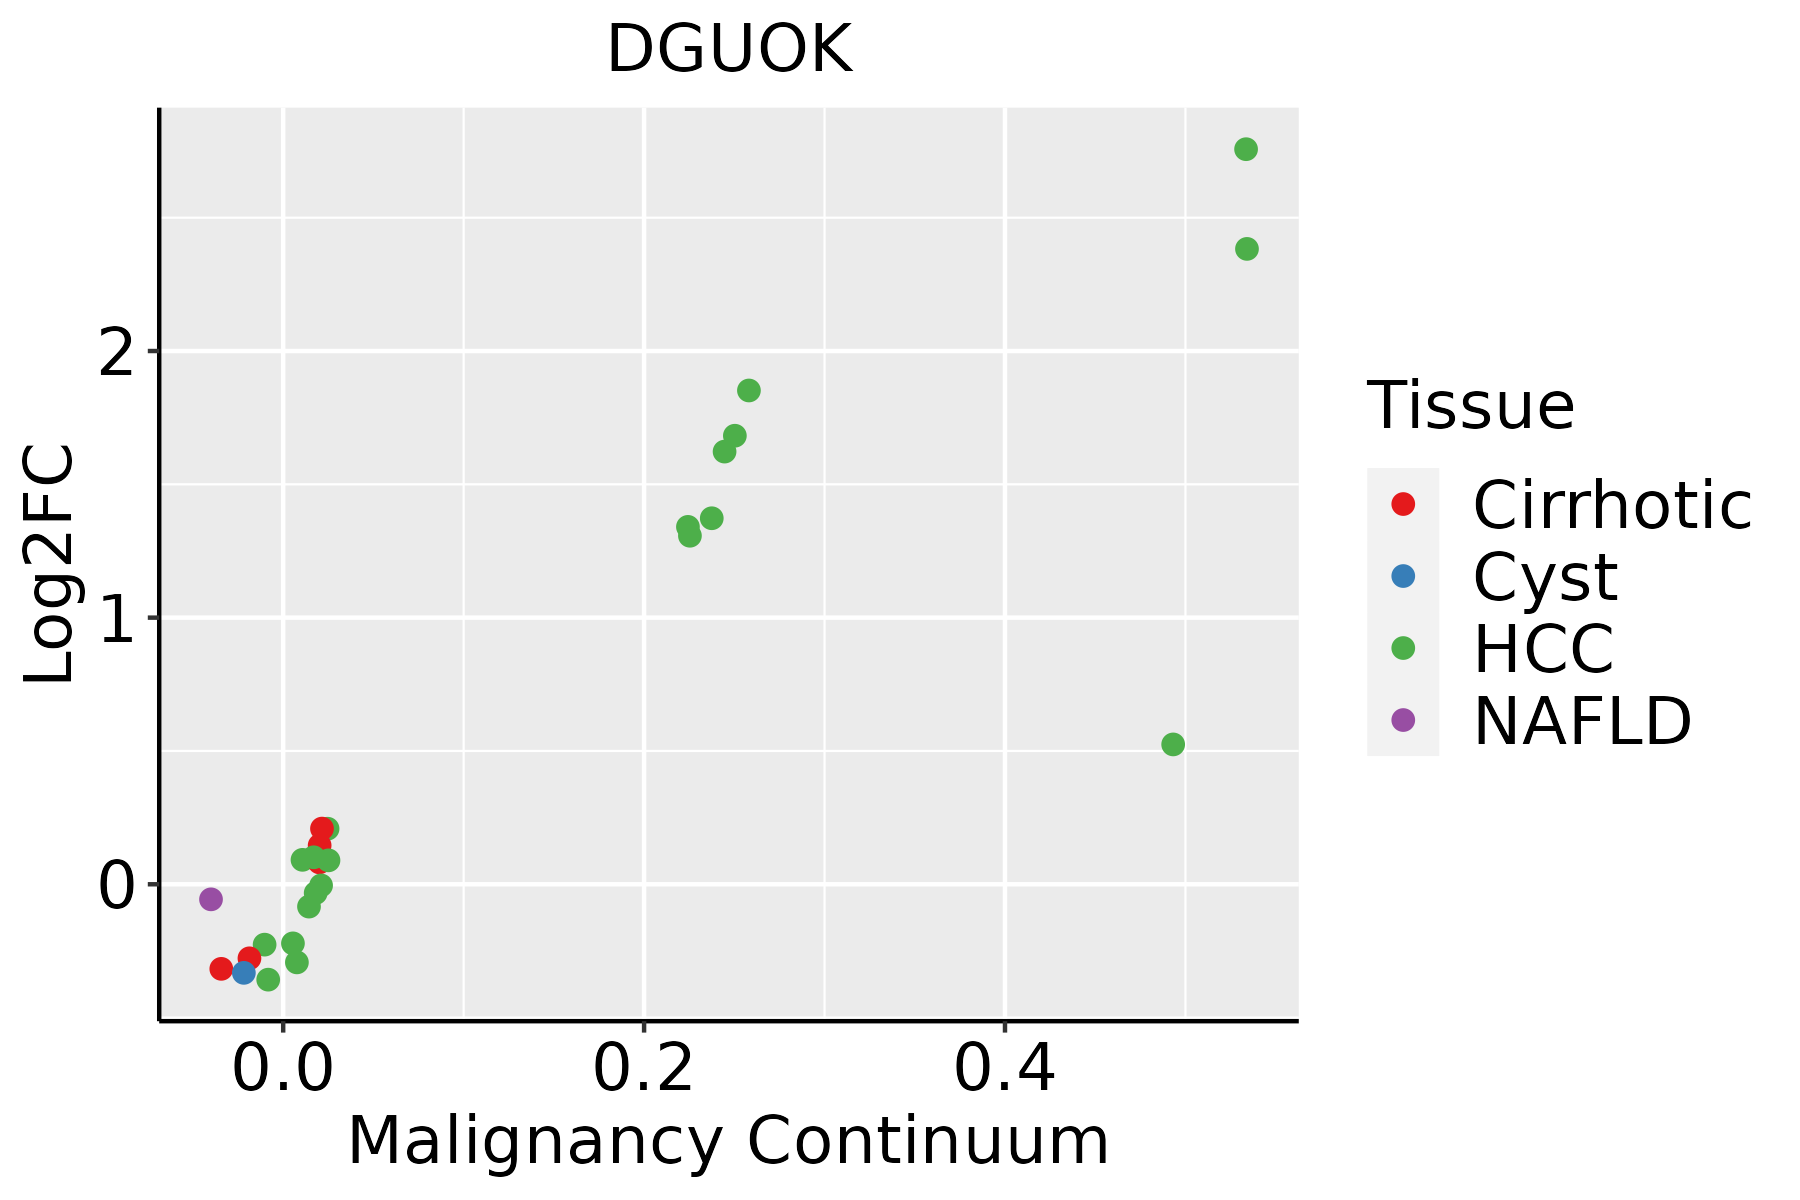 | HCC: Hepatocellular carcinoma |
| NAFLD: Non-alcoholic fatty liver disease | ||
| Oral Cavity | 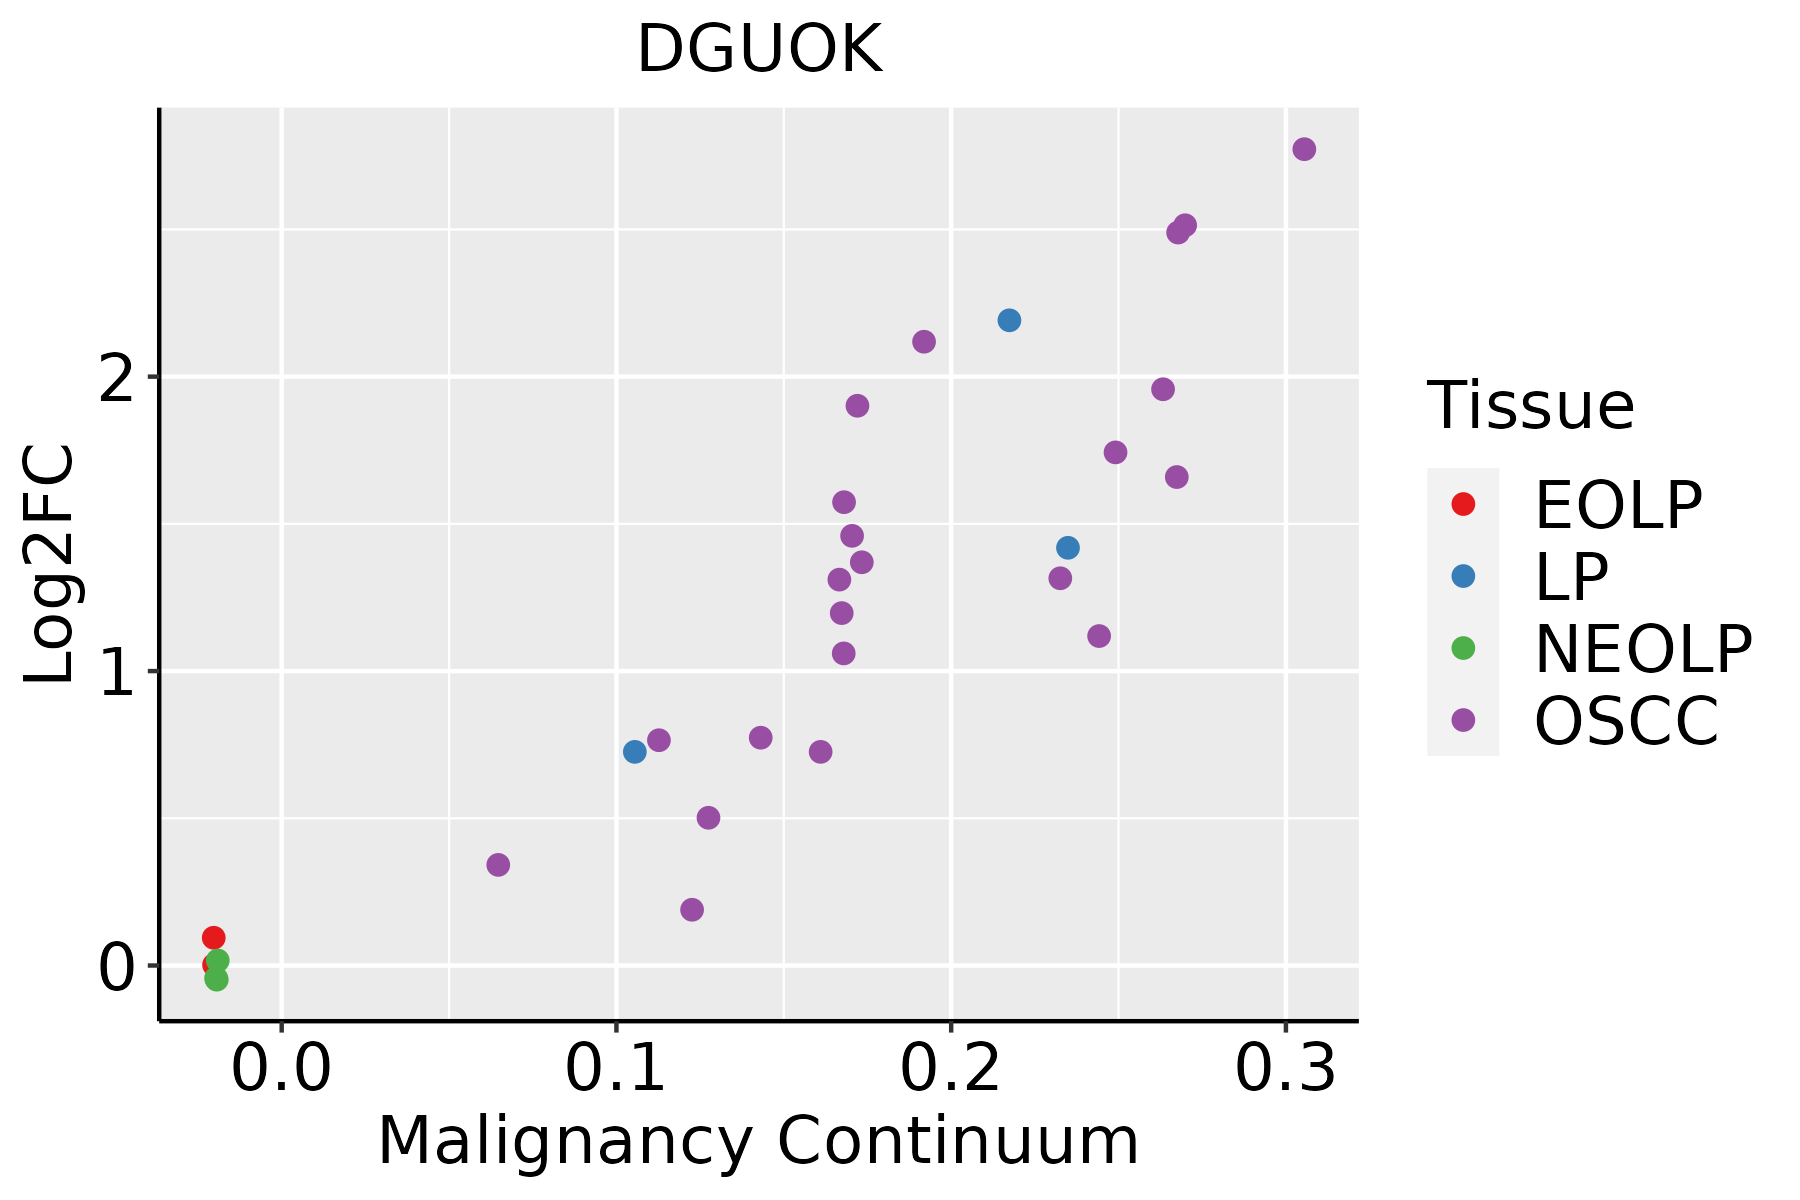 | EOLP: Erosive Oral lichen planus |
| LP: leukoplakia | ||
| NEOLP: Non-erosive oral lichen planus | ||
| OSCC: Oral squamous cell carcinoma | ||
| Skin |  | AK: Actinic keratosis |
| cSCC: Cutaneous squamous cell carcinoma | ||
| SCCIS:squamous cell carcinoma in situ | ||
| Thyroid | 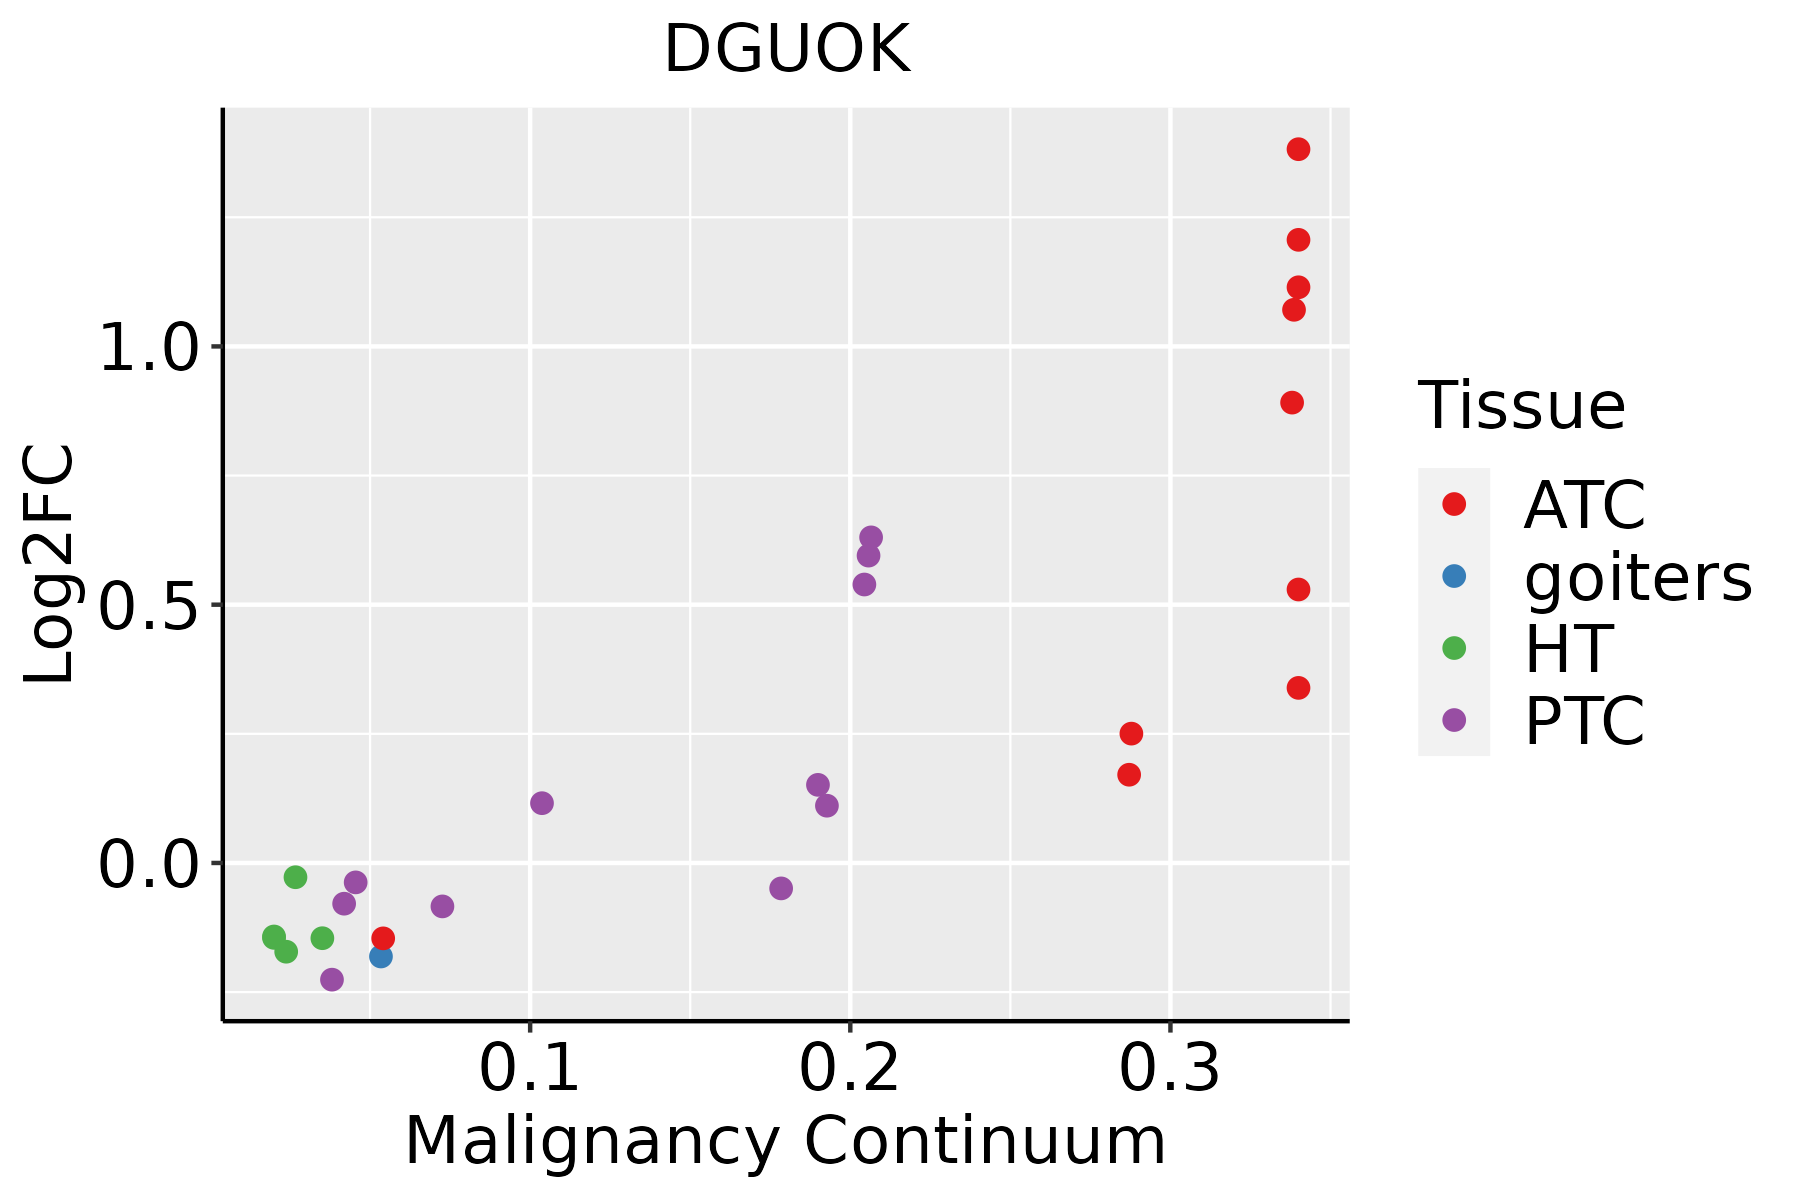 | ATC: Anaplastic thyroid cancer |
| HT: Hashimoto's thyroiditis | ||
| PTC: Papillary thyroid cancer |
| ∗log2FC in expression of this searched gene in stem-like cells from each diseased tissue sample relative to stem-like cells in normal samples in each tissue plotted against the malignancy continuum. Samples are colored based on if they are from different disease stage. |
Top |
Malignant transformation related pathway analysis |
| Find out the enriched GO biological processes and KEGG pathways involved in transition from healthy to precancer to cancer |
| Tissue | Disease Stage | Enriched GO biological Processes |
| Colorectum | AD |  |
| Colorectum | SER |  |
| Colorectum | MSS |  |
| Colorectum | MSI-H |  |
| Colorectum | FAP |  |
| ∗Top 15 enriched GO BP terms are showed in the bar plot of each disease state in each tissue. Each row represents a significant GO biological process which is colored according to the -log10(p.adjust). |
| Page: 1 2 3 4 5 6 7 8 9 |
| GO ID | Tissue | Disease Stage | Description | Gene Ratio | Bg Ratio | pvalue | p.adjust | Count |
| GO:001598012 | Liver | Cirrhotic | energy derivation by oxidation of organic compounds | 154/4634 | 318/18723 | 3.11e-20 | 8.87e-18 | 154 |
| GO:00061197 | Liver | Cirrhotic | oxidative phosphorylation | 86/4634 | 141/18723 | 6.08e-20 | 1.66e-17 | 86 |
| GO:000675312 | Liver | Cirrhotic | nucleoside phosphate metabolic process | 190/4634 | 497/18723 | 1.10e-11 | 6.96e-10 | 190 |
| GO:000911712 | Liver | Cirrhotic | nucleotide metabolic process | 187/4634 | 489/18723 | 1.55e-11 | 9.63e-10 | 187 |
| GO:001969312 | Liver | Cirrhotic | ribose phosphate metabolic process | 156/4634 | 396/18723 | 5.83e-11 | 3.23e-09 | 156 |
| GO:000925912 | Liver | Cirrhotic | ribonucleotide metabolic process | 151/4634 | 385/18723 | 1.72e-10 | 8.70e-09 | 151 |
| GO:007252112 | Liver | Cirrhotic | purine-containing compound metabolic process | 156/4634 | 416/18723 | 3.74e-09 | 1.52e-07 | 156 |
| GO:000915012 | Liver | Cirrhotic | purine ribonucleotide metabolic process | 141/4634 | 368/18723 | 4.22e-09 | 1.70e-07 | 141 |
| GO:000616312 | Liver | Cirrhotic | purine nucleotide metabolic process | 146/4634 | 396/18723 | 4.12e-08 | 1.34e-06 | 146 |
| GO:00091232 | Liver | Cirrhotic | nucleoside monophosphate metabolic process | 36/4634 | 76/18723 | 1.55e-05 | 2.11e-04 | 36 |
| GO:00196922 | Liver | Cirrhotic | deoxyribose phosphate metabolic process | 23/4634 | 42/18723 | 2.97e-05 | 3.75e-04 | 23 |
| GO:00093942 | Liver | Cirrhotic | 2'-deoxyribonucleotide metabolic process | 22/4634 | 40/18723 | 4.04e-05 | 4.82e-04 | 22 |
| GO:00463905 | Liver | Cirrhotic | ribose phosphate biosynthetic process | 71/4634 | 190/18723 | 7.09e-05 | 7.98e-04 | 71 |
| GO:00091265 | Liver | Cirrhotic | purine nucleoside monophosphate metabolic process | 23/4634 | 44/18723 | 7.87e-05 | 8.61e-04 | 23 |
| GO:00092622 | Liver | Cirrhotic | deoxyribonucleotide metabolic process | 23/4634 | 44/18723 | 7.87e-05 | 8.61e-04 | 23 |
| GO:00092605 | Liver | Cirrhotic | ribonucleotide biosynthetic process | 68/4634 | 182/18723 | 1.00e-04 | 1.05e-03 | 68 |
| GO:00091654 | Liver | Cirrhotic | nucleotide biosynthetic process | 89/4634 | 254/18723 | 1.45e-04 | 1.40e-03 | 89 |
| GO:19012934 | Liver | Cirrhotic | nucleoside phosphate biosynthetic process | 89/4634 | 256/18723 | 1.97e-04 | 1.82e-03 | 89 |
| GO:19016572 | Liver | Cirrhotic | glycosyl compound metabolic process | 37/4634 | 88/18723 | 2.70e-04 | 2.40e-03 | 37 |
| GO:00091526 | Liver | Cirrhotic | purine ribonucleotide biosynthetic process | 62/4634 | 169/18723 | 3.52e-04 | 3.00e-03 | 62 |
| Page: 1 2 3 4 5 6 7 8 9 10 11 12 13 14 15 16 17 18 19 20 21 22 |
| Pathway ID | Tissue | Disease Stage | Description | Gene Ratio | Bg Ratio | pvalue | p.adjust | qvalue | Count |
| hsa012325 | Esophagus | ESCC | Nucleotide metabolism | 59/4205 | 85/8465 | 1.67e-04 | 6.58e-04 | 3.37e-04 | 59 |
| hsa0123212 | Esophagus | ESCC | Nucleotide metabolism | 59/4205 | 85/8465 | 1.67e-04 | 6.58e-04 | 3.37e-04 | 59 |
| hsa01232 | Liver | Cirrhotic | Nucleotide metabolism | 39/2530 | 85/8465 | 1.27e-03 | 6.73e-03 | 4.15e-03 | 39 |
| hsa012321 | Liver | Cirrhotic | Nucleotide metabolism | 39/2530 | 85/8465 | 1.27e-03 | 6.73e-03 | 4.15e-03 | 39 |
| hsa012322 | Liver | HCC | Nucleotide metabolism | 59/4020 | 85/8465 | 3.30e-05 | 1.88e-04 | 1.04e-04 | 59 |
| hsa012323 | Liver | HCC | Nucleotide metabolism | 59/4020 | 85/8465 | 3.30e-05 | 1.88e-04 | 1.04e-04 | 59 |
| hsa012324 | Oral cavity | OSCC | Nucleotide metabolism | 54/3704 | 85/8465 | 1.78e-04 | 5.95e-04 | 3.03e-04 | 54 |
| hsa0123211 | Oral cavity | OSCC | Nucleotide metabolism | 54/3704 | 85/8465 | 1.78e-04 | 5.95e-04 | 3.03e-04 | 54 |
| hsa0123221 | Oral cavity | LP | Nucleotide metabolism | 42/2418 | 85/8465 | 3.62e-05 | 2.36e-04 | 1.52e-04 | 42 |
| hsa0123231 | Oral cavity | LP | Nucleotide metabolism | 42/2418 | 85/8465 | 3.62e-05 | 2.36e-04 | 1.52e-04 | 42 |
| Page: 1 |
Top |
Cell-cell communication analysis |
| Identification of potential cell-cell interactions between two cell types and their ligand-receptor pairs for different disease states |
| Ligand | Receptor | LRpair | Pathway | Tissue | Disease Stage |
| Page: 1 |
Top |
Single-cell gene regulatory network inference analysis |
| Find out the significant the regulons (TFs) and the target genes of each regulon across cell types for different disease states |
| TF | Cell Type | Tissue | Disease Stage | Target Gene | RSS | Regulon Activity |
| ∗The dot plots of a searched regulon are shown for all cell subpopulations in each disease state of each tissue based on the regulon specific score inferred using pySCENIC and by calculating the average expression. |
| Page: 1 |
Top |
Somatic mutation of malignant transformation related genes |
| Annotation of somatic variants for genes involved in malignant transformation |
| Hugo Symbol | Variant Class | Variant Classification | dbSNP RS | HGVSc | HGVSp | HGVSp Short | SWISSPROT | BIOTYPE | SIFT | PolyPhen | Tumor Sample Barcode | Tissue | Histology | Sex | Age | Stage | Therapy Types | Drugs | Outcome |
| DGUOK | SNV | Missense_Mutation | c.469N>C | p.Glu157Gln | p.E157Q | Q16854 | protein_coding | deleterious(0) | probably_damaging(0.981) | TCGA-AR-A24H-01 | Breast | breast invasive carcinoma | Female | >=65 | I/II | Hormone Therapy | tamoxiphen | SD | |
| DGUOK | SNV | Missense_Mutation | c.603N>C | p.Lys201Asn | p.K201N | Q16854 | protein_coding | tolerated(0.47) | benign(0.4) | TCGA-C8-A26Y-01 | Breast | breast invasive carcinoma | Female | >=65 | I/II | Unknown | Unknown | SD | |
| DGUOK | SNV | Missense_Mutation | c.521N>G | p.Ser174Cys | p.S174C | Q16854 | protein_coding | deleterious(0) | possibly_damaging(0.843) | TCGA-D8-A1J8-01 | Breast | breast invasive carcinoma | Female | >=65 | I/II | Hormone Therapy | nolvadex | SD | |
| DGUOK | SNV | Missense_Mutation | c.481N>G | p.Leu161Val | p.L161V | Q16854 | protein_coding | deleterious(0.02) | benign(0.324) | TCGA-IR-A3LK-01 | Cervix | cervical & endocervical cancer | Female | >=65 | I/II | Chemotherapy | cisplatin | PD | |
| DGUOK | SNV | Missense_Mutation | rs779549324 | c.548N>A | p.Arg183Gln | p.R183Q | Q16854 | protein_coding | tolerated(0.29) | benign(0.012) | TCGA-A6-5665-01 | Colorectum | colon adenocarcinoma | Female | >=65 | I/II | Unknown | Unknown | PD |
| DGUOK | SNV | Missense_Mutation | c.353G>A | p.Arg118His | p.R118H | Q16854 | protein_coding | deleterious(0) | probably_damaging(1) | TCGA-AA-3663-01 | Colorectum | colon adenocarcinoma | Male | <65 | I/II | Unknown | Unknown | SD | |
| DGUOK | SNV | Missense_Mutation | c.356T>A | p.Leu119Gln | p.L119Q | Q16854 | protein_coding | deleterious(0) | probably_damaging(0.991) | TCGA-AD-6895-01 | Colorectum | colon adenocarcinoma | Male | >=65 | III/IV | Unknown | Unknown | SD | |
| DGUOK | SNV | Missense_Mutation | rs769603983 | c.825N>T | p.Lys275Asn | p.K275N | Q16854 | protein_coding | tolerated(0.29) | benign(0.053) | TCGA-AZ-4315-01 | Colorectum | colon adenocarcinoma | Male | <65 | I/II | Unknown | Unknown | SD |
| DGUOK | SNV | Missense_Mutation | novel | c.640N>C | p.Ile214Leu | p.I214L | Q16854 | protein_coding | tolerated(0.09) | benign(0.017) | TCGA-CA-6717-01 | Colorectum | colon adenocarcinoma | Male | <65 | I/II | Chemotherapy | oxaliplatin | CR |
| DGUOK | SNV | Missense_Mutation | novel | c.310N>T | p.Ala104Ser | p.A104S | Q16854 | protein_coding | tolerated(0.41) | benign(0.003) | TCGA-A5-A0G2-01 | Endometrium | uterine corpus endometrioid carcinoma | Female | <65 | III/IV | Unknown | Unknown | SD |
| Page: 1 2 3 |
Top |
Related drugs of malignant transformation related genes |
| Identification of chemicals and drugs interact with genes involved in malignant transfromation |
| (DGIdb 4.0) |
| Entrez ID | Symbol | Category | Interaction Types | Drug Claim Name | Drug Name | PMIDs |
| Page: 1 |

Copyright 2023-Present -The University of Texas Health Science Center at Houston |