
|
|||||
|
 | |
| |
| |
| |
| |
| |
|
Gene: DCN |
Gene summary for DCN |
| Gene information | Species | Human | Gene symbol | DCN | Gene ID | 1634 |
| Gene name | decorin | |
| Gene Alias | CSCD | |
| Cytomap | 12q21.33 | |
| Gene Type | protein-coding | GO ID | GO:0000003 | UniProtAcc | P07585 |
Top |
Malignant transformation analysis |
| Identification of the aberrant gene expression in precancerous and cancerous lesions by comparing the gene expression of stem-like cells in diseased tissues with normal stem cells |
| Entrez ID | Symbol | Replicates | Species | Organ | Tissue | Adj P-value | Log2FC | Malignancy |
| 1634 | DCN | CA_HPV_3 | Human | Cervix | CC | 4.52e-35 | 7.84e-01 | 0.0414 |
| 1634 | DCN | N_HPV_2 | Human | Cervix | N_HPV | 1.22e-14 | 5.18e-01 | -0.0131 |
| 1634 | DCN | T1 | Human | Cervix | CC | 2.52e-02 | -1.67e-01 | 0.0918 |
| 1634 | DCN | AEH-subject1 | Human | Endometrium | AEH | 1.52e-43 | -9.66e-01 | -0.3059 |
| 1634 | DCN | AEH-subject2 | Human | Endometrium | AEH | 7.87e-43 | -1.11e+00 | -0.2525 |
| 1634 | DCN | AEH-subject3 | Human | Endometrium | AEH | 5.65e-46 | -1.10e+00 | -0.2576 |
| 1634 | DCN | AEH-subject4 | Human | Endometrium | AEH | 1.13e-08 | -6.38e-01 | -0.2657 |
| 1634 | DCN | AEH-subject5 | Human | Endometrium | AEH | 2.31e-52 | -1.14e+00 | -0.2953 |
| 1634 | DCN | EEC-subject1 | Human | Endometrium | EEC | 4.30e-54 | -1.15e+00 | -0.2682 |
| 1634 | DCN | EEC-subject2 | Human | Endometrium | EEC | 2.14e-57 | -1.18e+00 | -0.2607 |
| 1634 | DCN | EEC-subject3 | Human | Endometrium | EEC | 4.89e-42 | -9.52e-01 | -0.2525 |
| 1634 | DCN | EEC-subject4 | Human | Endometrium | EEC | 5.83e-35 | -9.00e-01 | -0.2571 |
| 1634 | DCN | EEC-subject5 | Human | Endometrium | EEC | 1.09e-49 | -1.09e+00 | -0.249 |
| 1634 | DCN | GSM5276935 | Human | Endometrium | EEC | 1.70e-54 | -1.14e+00 | -0.123 |
| 1634 | DCN | GSM5276937 | Human | Endometrium | EEC | 5.72e-14 | -6.91e-01 | -0.0897 |
| 1634 | DCN | GSM6177620_NYU_UCEC1_lib1_lib1 | Human | Endometrium | EEC | 2.21e-44 | -1.19e+00 | -0.1869 |
| 1634 | DCN | GSM6177620_NYU_UCEC1_lib2_lib2 | Human | Endometrium | EEC | 4.75e-43 | -1.20e+00 | -0.1875 |
| 1634 | DCN | GSM6177620_NYU_UCEC1_lib3_lib3 | Human | Endometrium | EEC | 2.73e-49 | -1.20e+00 | -0.1883 |
| 1634 | DCN | GSM6177621_NYU_UCEC2_lib1_lib1 | Human | Endometrium | EEC | 2.76e-62 | -1.19e+00 | -0.1934 |
| 1634 | DCN | GSM6177622_NYU_UCEC3_lib1_lib1 | Human | Endometrium | EEC | 2.62e-65 | -1.20e+00 | -0.1917 |
| Page: 1 2 3 4 5 |
| Tissue | Expression Dynamics | Abbreviation |
| Cervix | 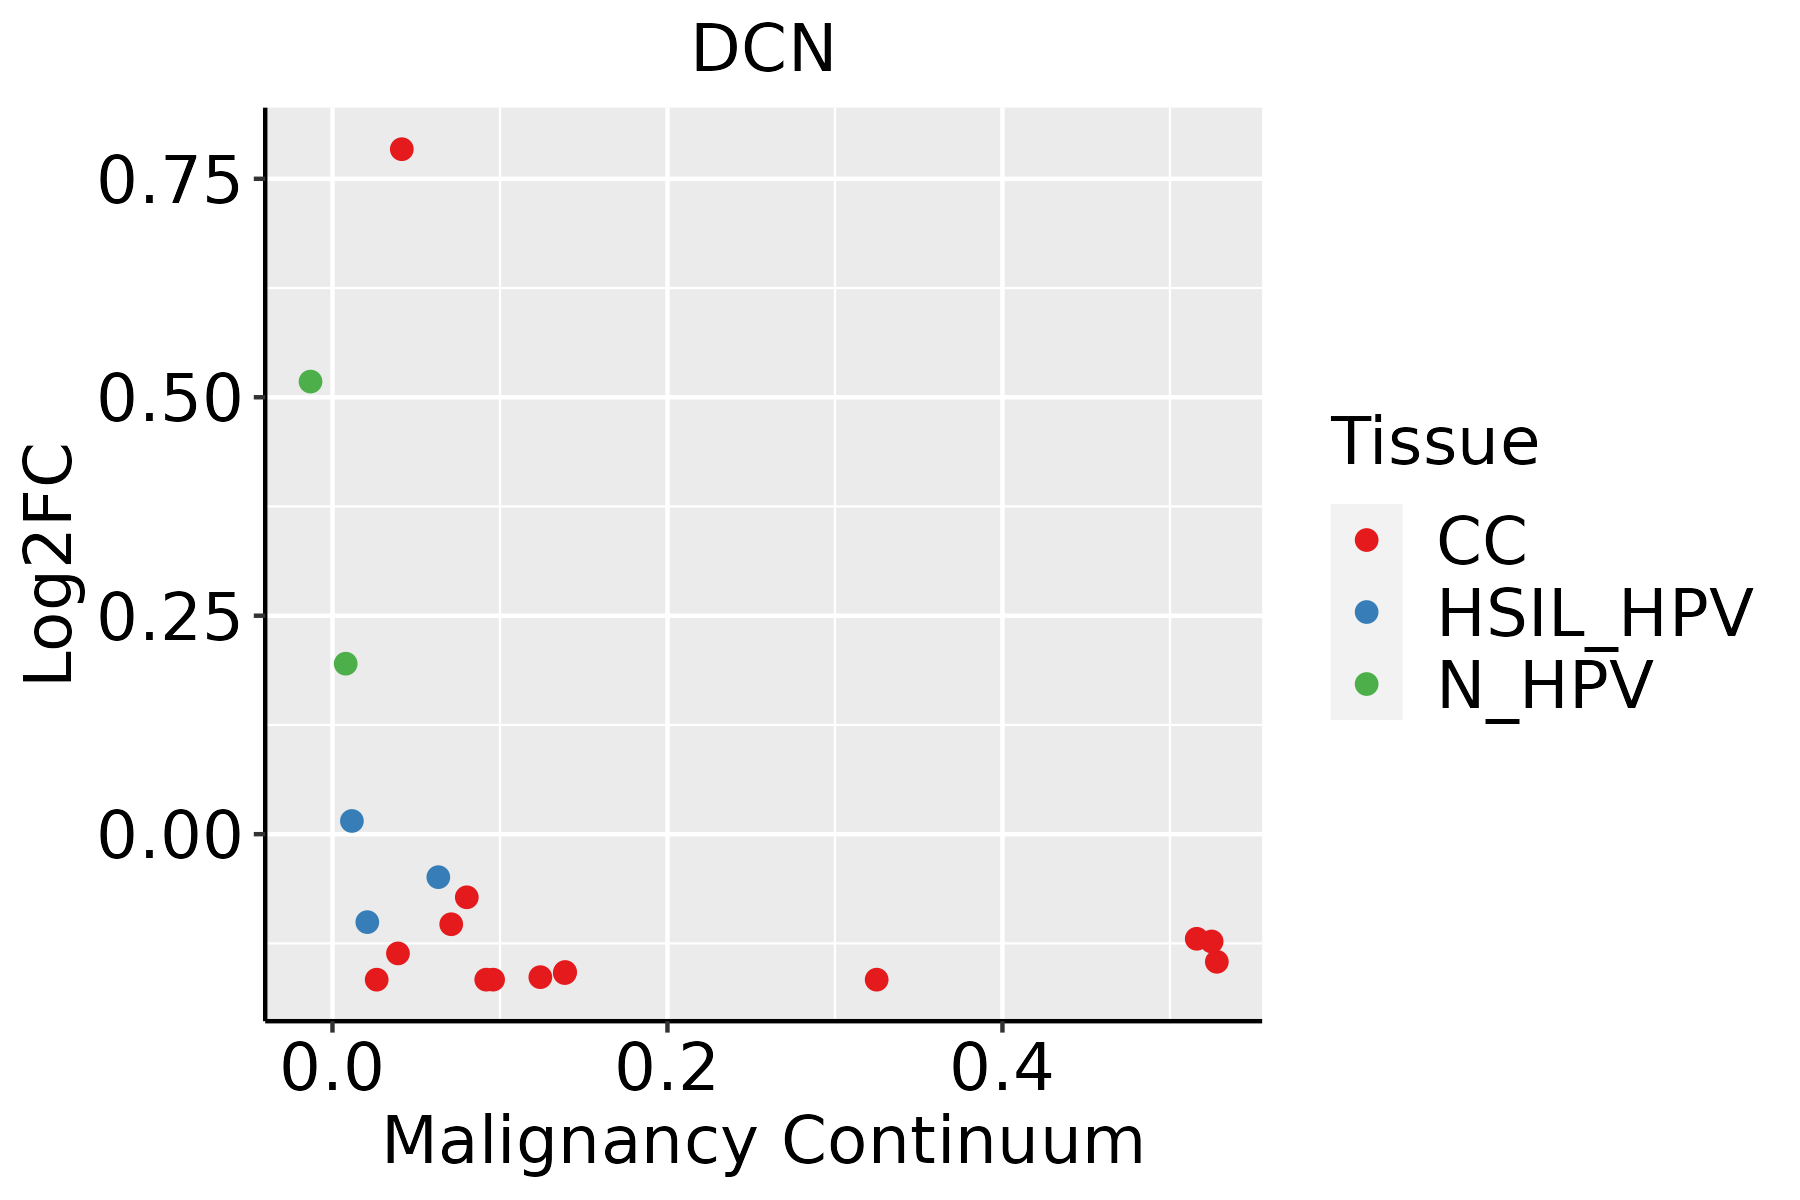 | CC: Cervix cancer |
| HSIL_HPV: HPV-infected high-grade squamous intraepithelial lesions | ||
| N_HPV: HPV-infected normal cervix | ||
| Endometrium | 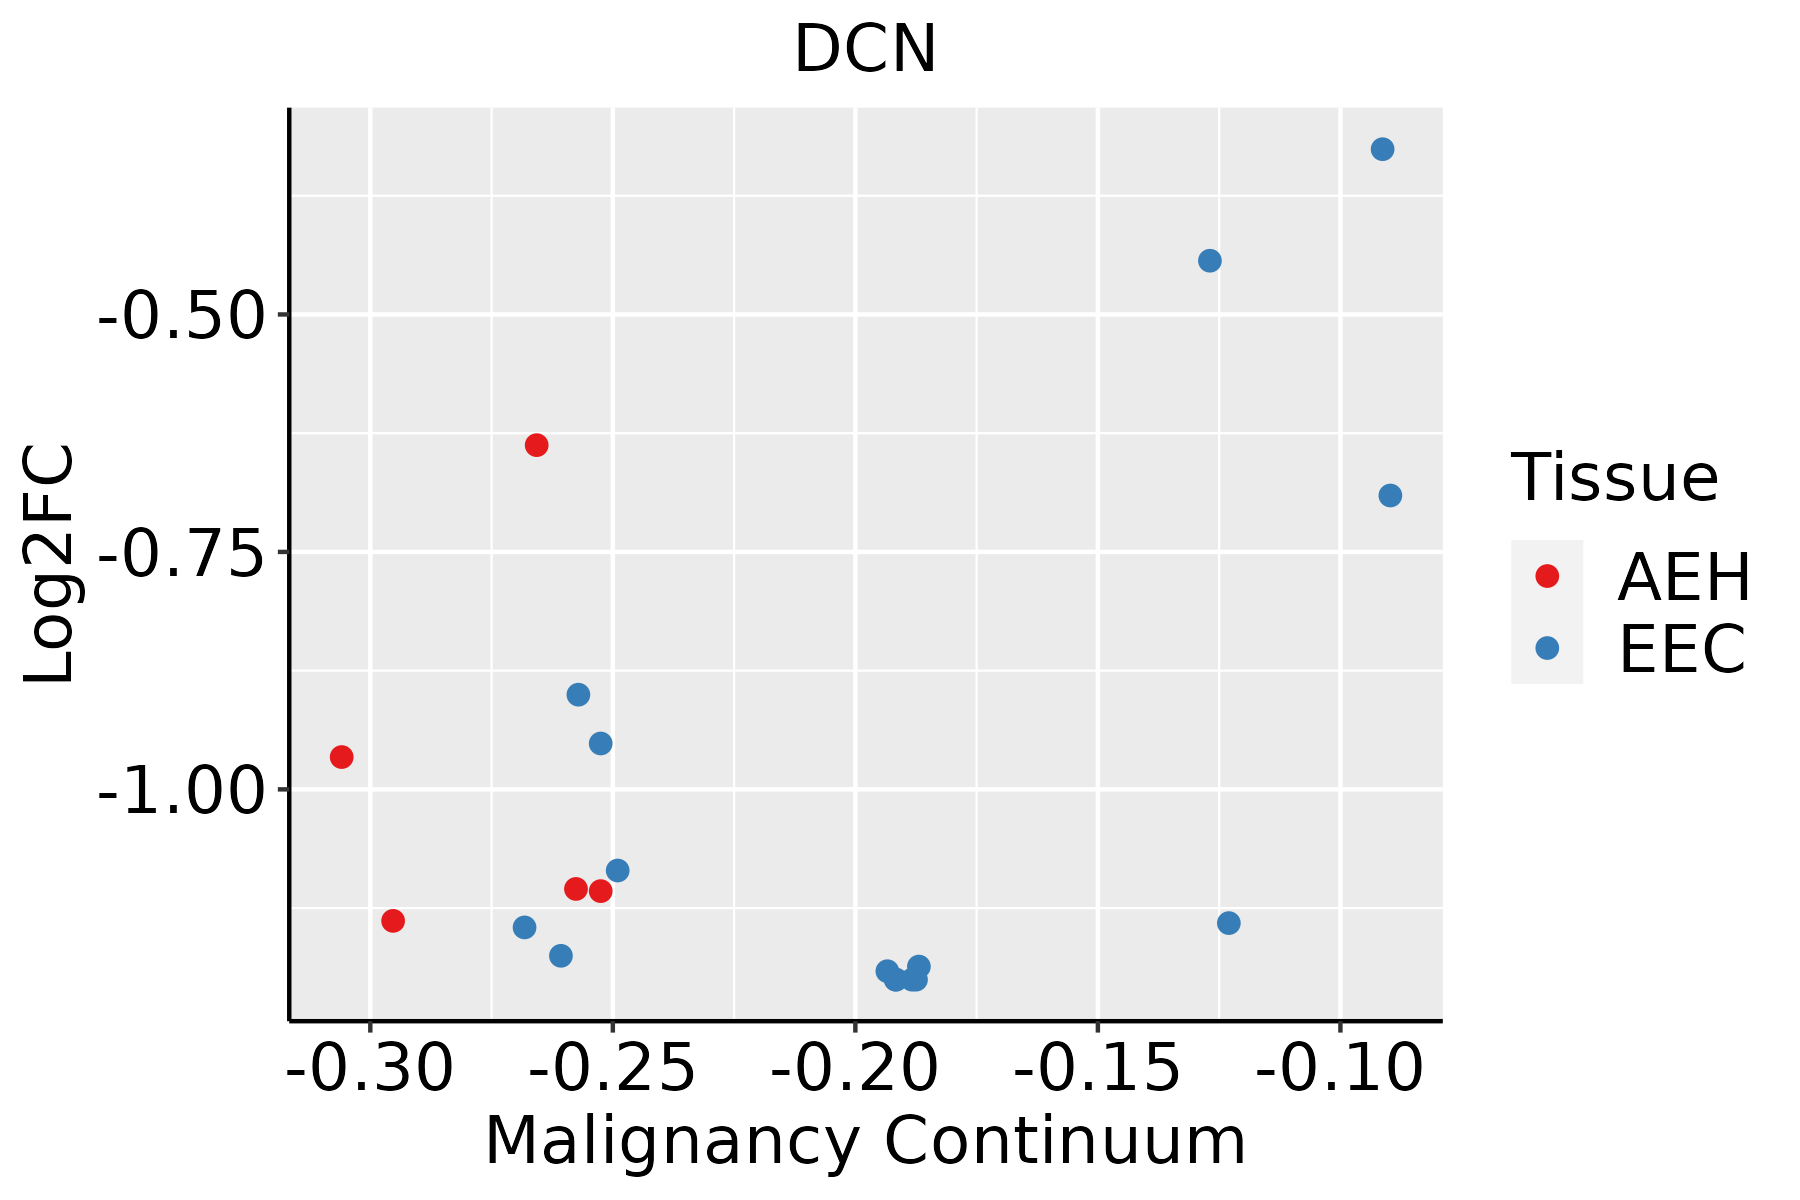 | AEH: Atypical endometrial hyperplasia |
| EEC: Endometrioid Cancer | ||
| Esophagus | 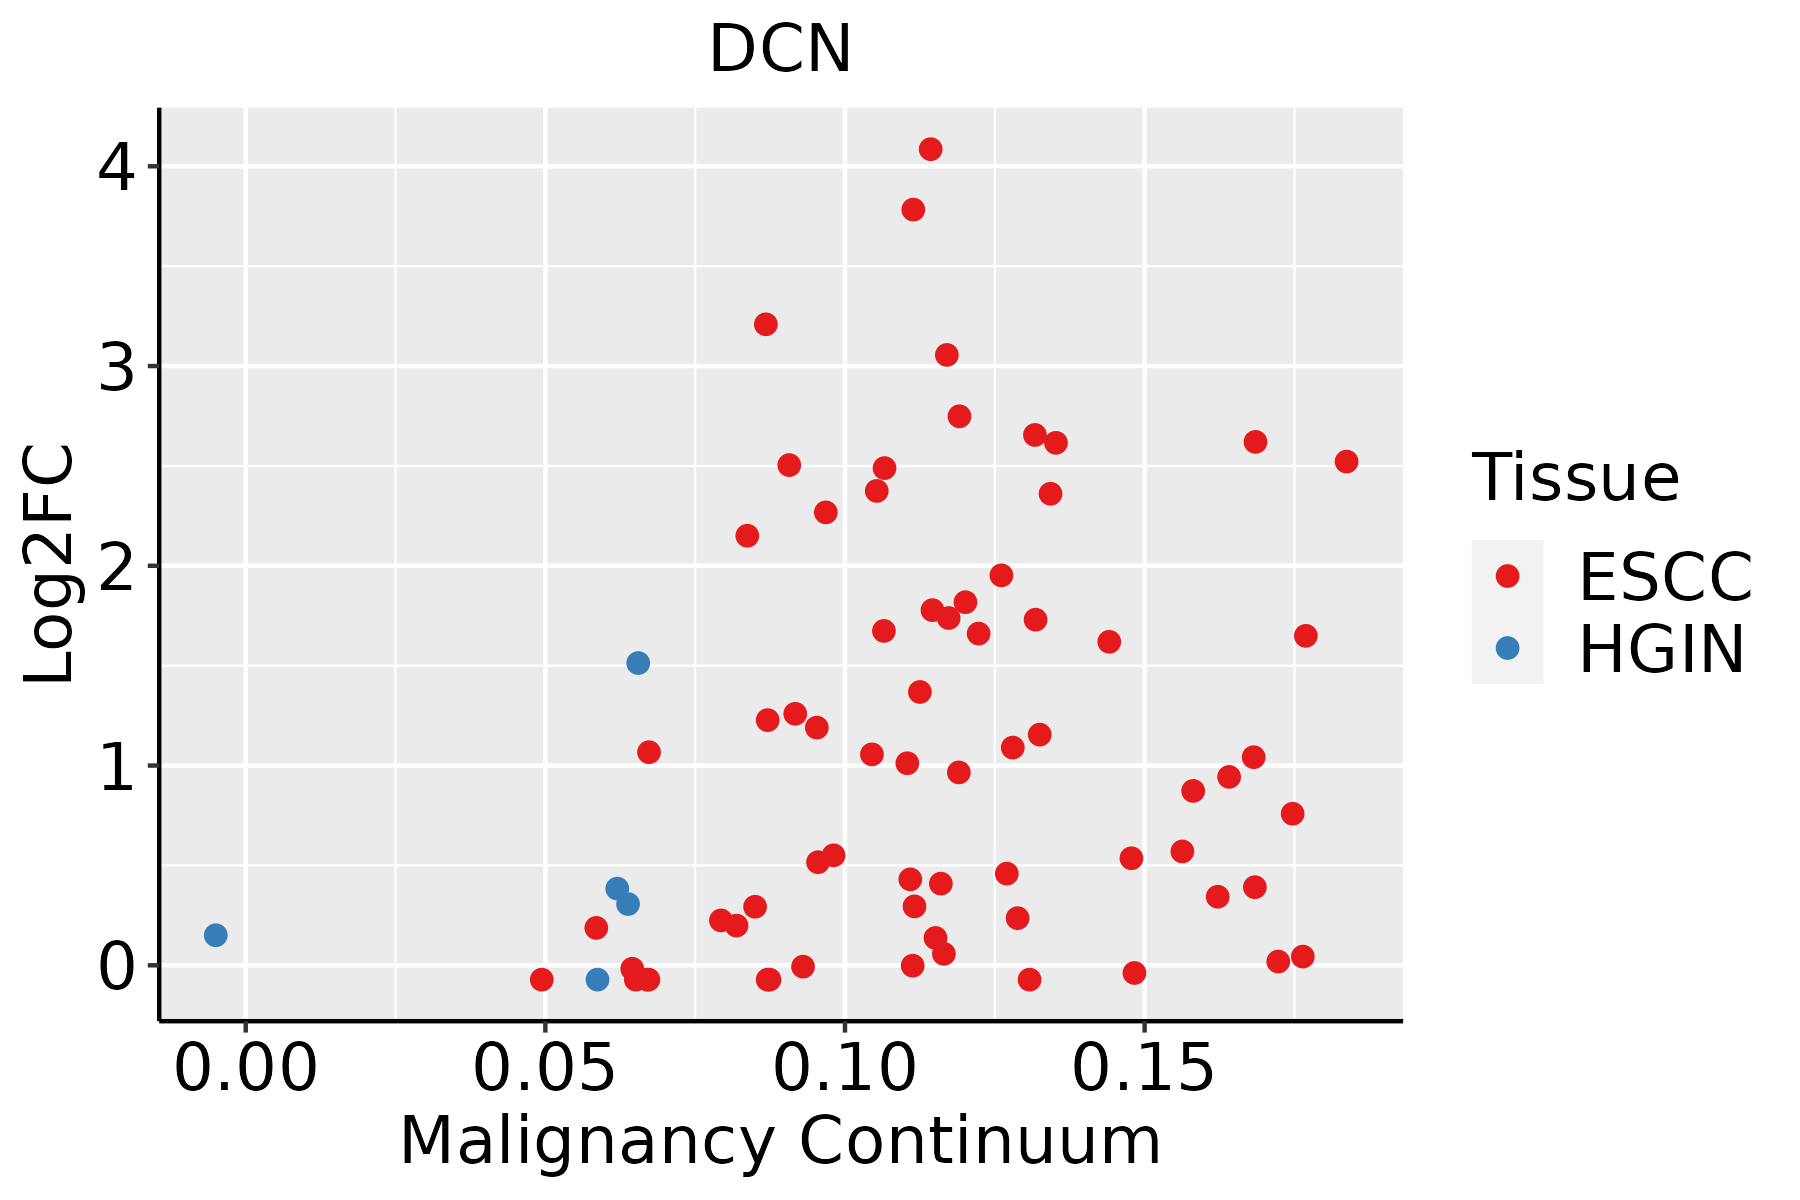 | ESCC: Esophageal squamous cell carcinoma |
| HGIN: High-grade intraepithelial neoplasias | ||
| LGIN: Low-grade intraepithelial neoplasias | ||
| Oral Cavity |  | EOLP: Erosive Oral lichen planus |
| LP: leukoplakia | ||
| NEOLP: Non-erosive oral lichen planus | ||
| OSCC: Oral squamous cell carcinoma | ||
| Skin | 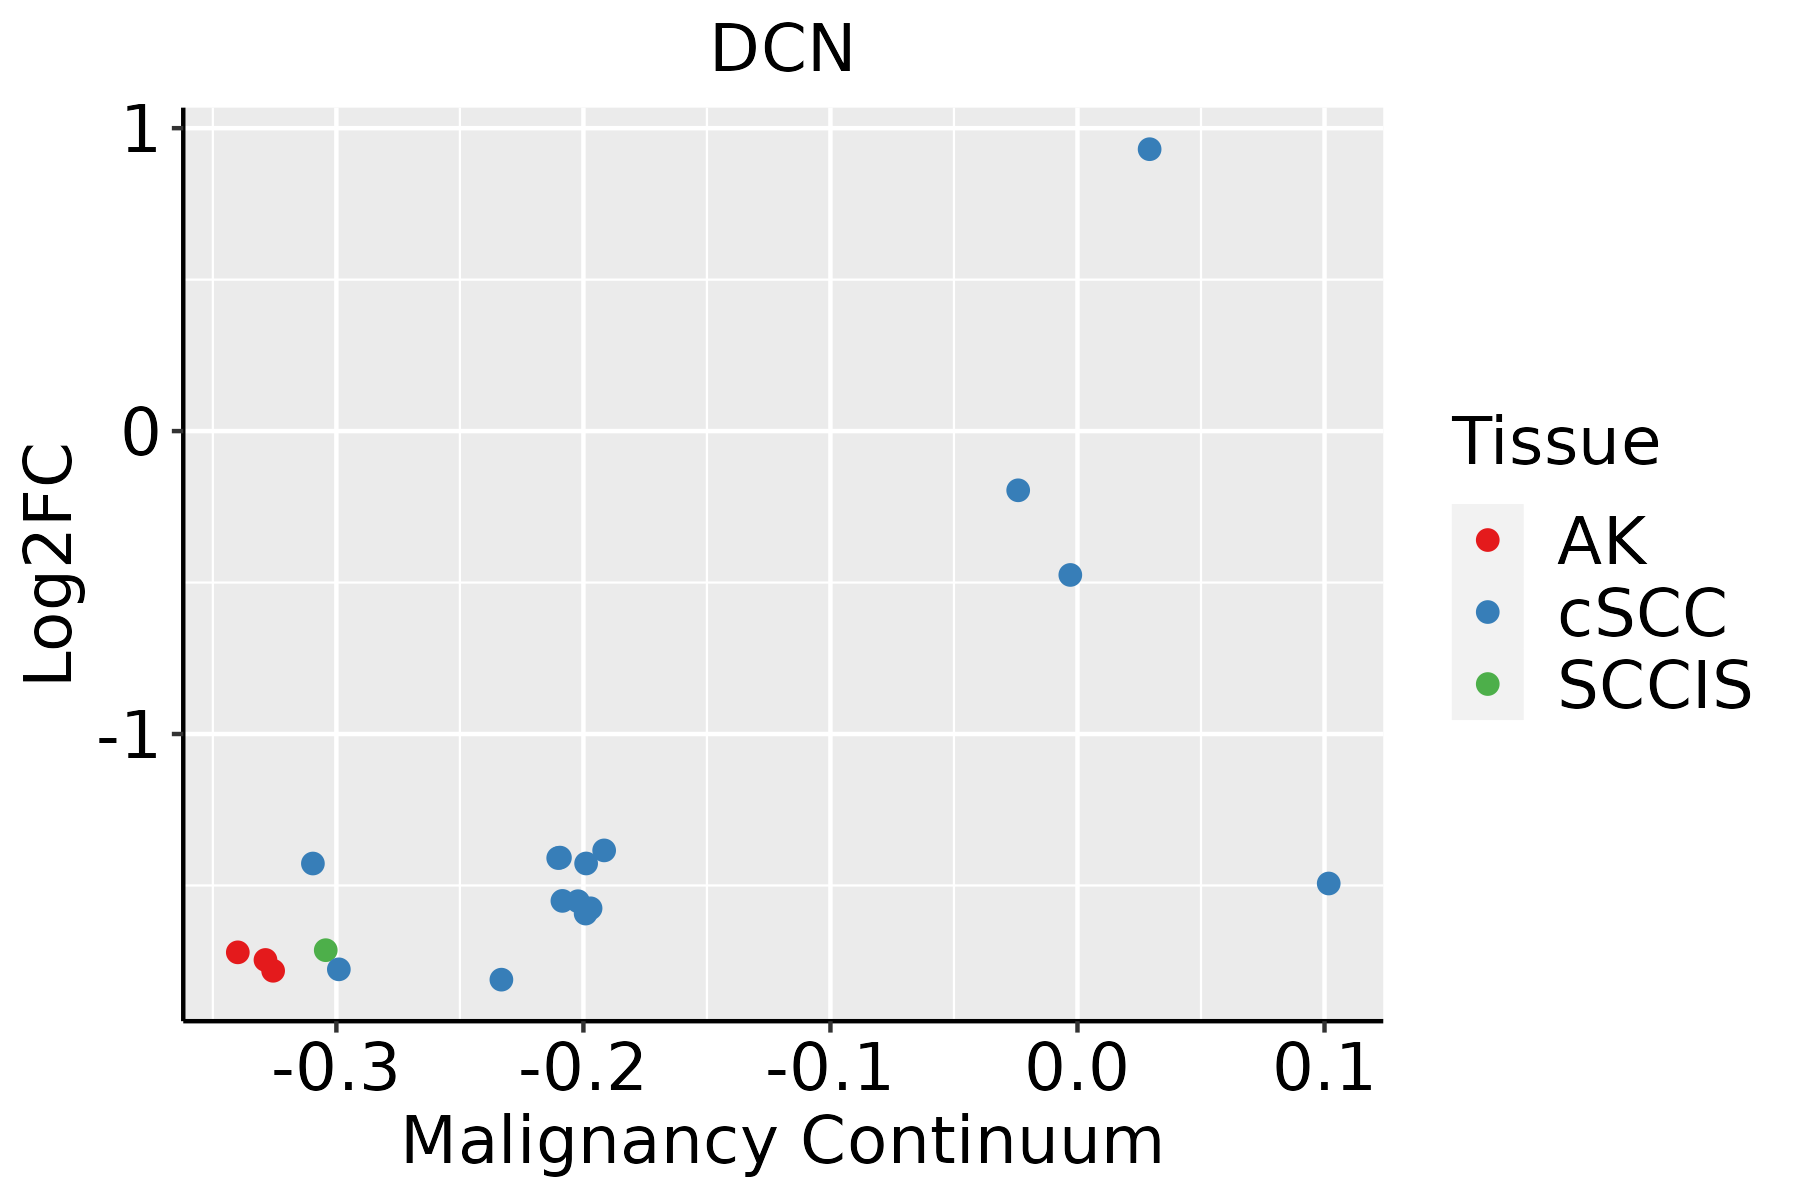 | AK: Actinic keratosis |
| cSCC: Cutaneous squamous cell carcinoma | ||
| SCCIS:squamous cell carcinoma in situ | ||
| Thyroid | 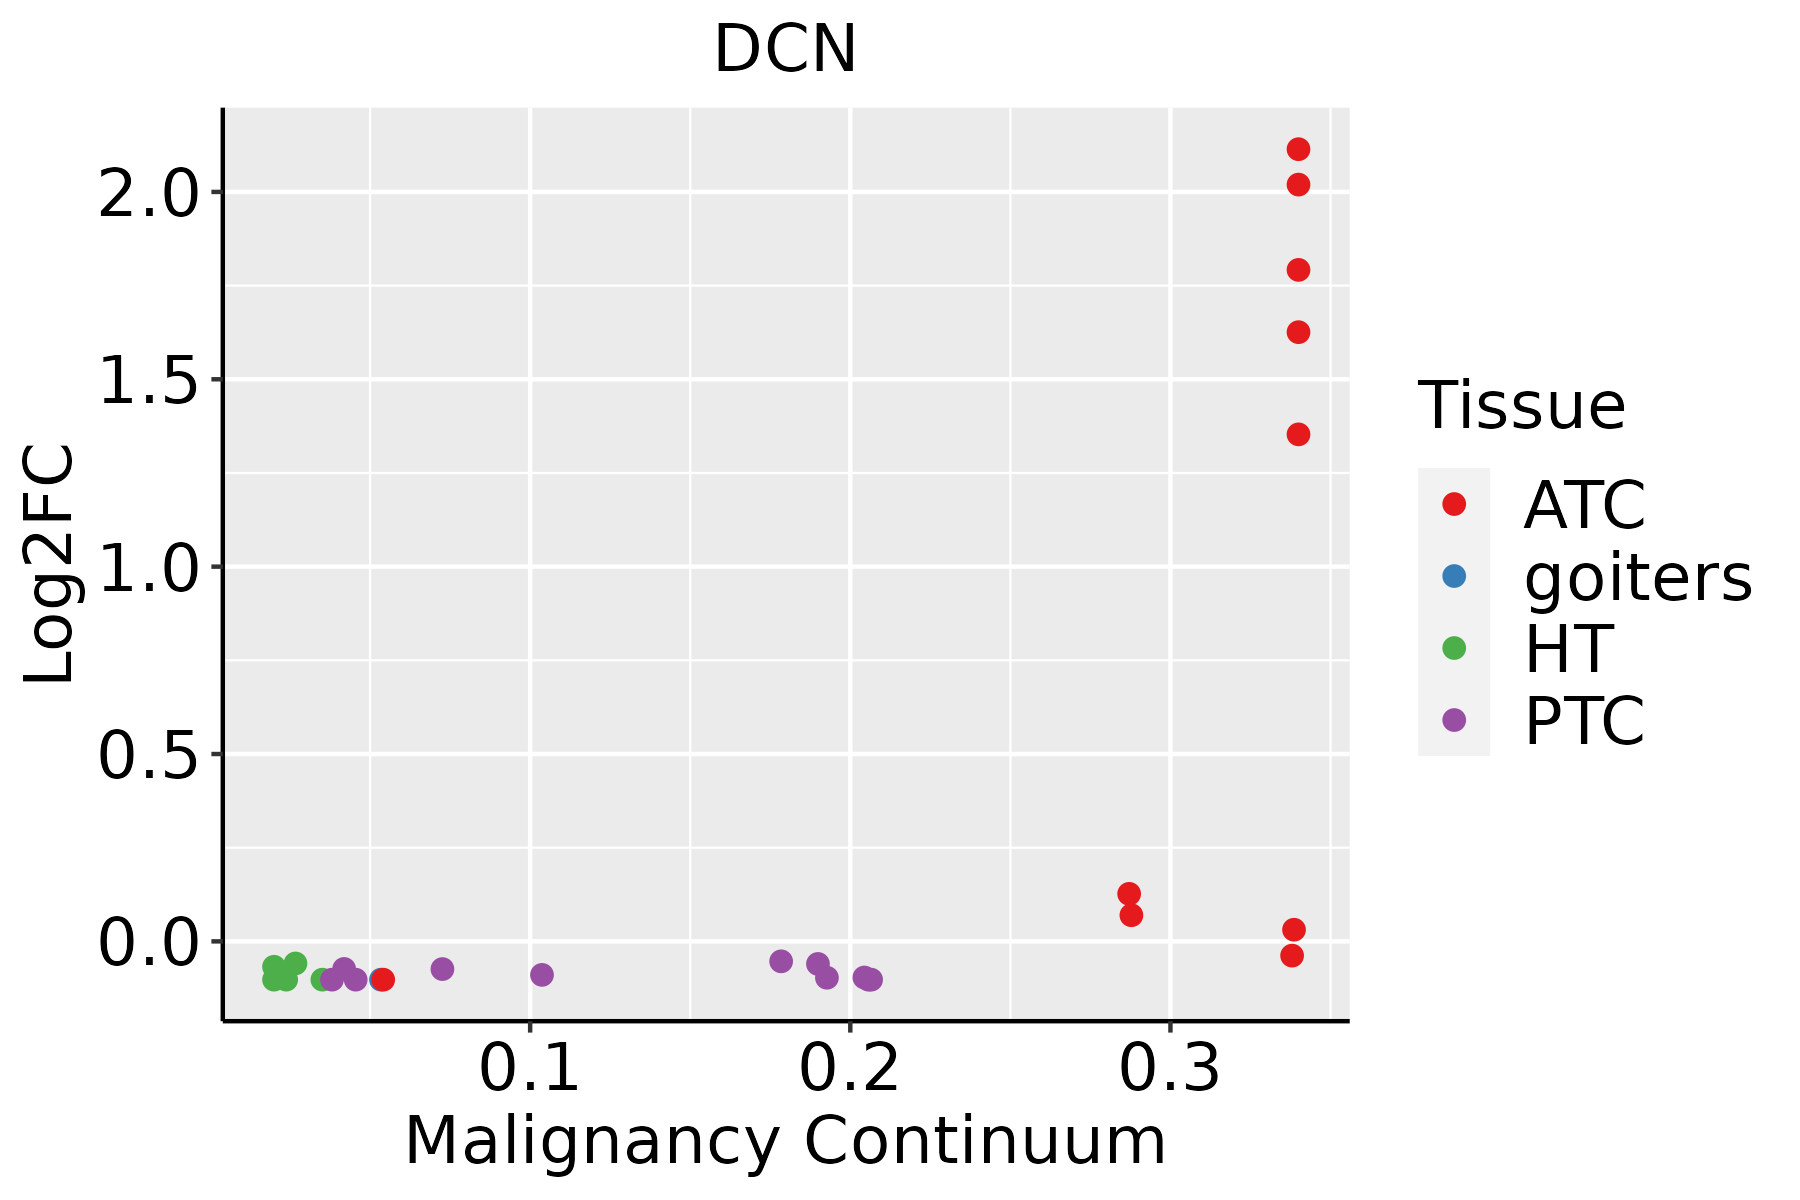 | ATC: Anaplastic thyroid cancer |
| HT: Hashimoto's thyroiditis | ||
| PTC: Papillary thyroid cancer |
| ∗log2FC in expression of this searched gene in stem-like cells from each diseased tissue sample relative to stem-like cells in normal samples in each tissue plotted against the malignancy continuum. Samples are colored based on if they are from different disease stage. |
Top |
Malignant transformation related pathway analysis |
| Find out the enriched GO biological processes and KEGG pathways involved in transition from healthy to precancer to cancer |
| Tissue | Disease Stage | Enriched GO biological Processes |
| Colorectum | AD |  |
| Colorectum | SER |  |
| Colorectum | MSS |  |
| Colorectum | MSI-H |  |
| Colorectum | FAP |  |
| ∗Top 15 enriched GO BP terms are showed in the bar plot of each disease state in each tissue. Each row represents a significant GO biological process which is colored according to the -log10(p.adjust). |
| Page: 1 2 3 4 5 6 7 8 9 |
| GO ID | Tissue | Disease Stage | Description | Gene Ratio | Bg Ratio | pvalue | p.adjust | Count |
| GO:001063120 | Esophagus | ESCC | epithelial cell migration | 187/8552 | 357/18723 | 6.05e-03 | 2.23e-02 | 187 |
| GO:009013220 | Esophagus | ESCC | epithelium migration | 188/8552 | 360/18723 | 6.96e-03 | 2.54e-02 | 188 |
| GO:00016559 | Esophagus | ESCC | urogenital system development | 177/8552 | 338/18723 | 7.51e-03 | 2.69e-02 | 177 |
| GO:009013020 | Esophagus | ESCC | tissue migration | 190/8552 | 365/18723 | 7.91e-03 | 2.82e-02 | 190 |
| GO:001470615 | Esophagus | ESCC | striated muscle tissue development | 197/8552 | 384/18723 | 1.46e-02 | 4.74e-02 | 197 |
| GO:000989620 | Oral cavity | OSCC | positive regulation of catabolic process | 307/7305 | 492/18723 | 2.29e-26 | 7.64e-24 | 307 |
| GO:003133120 | Oral cavity | OSCC | positive regulation of cellular catabolic process | 273/7305 | 427/18723 | 6.39e-26 | 2.02e-23 | 273 |
| GO:001623610 | Oral cavity | OSCC | macroautophagy | 192/7305 | 291/18723 | 7.01e-21 | 1.14e-18 | 192 |
| GO:001050610 | Oral cavity | OSCC | regulation of autophagy | 198/7305 | 317/18723 | 1.63e-17 | 1.51e-15 | 198 |
| GO:004206020 | Oral cavity | OSCC | wound healing | 237/7305 | 422/18723 | 4.51e-13 | 2.18e-11 | 237 |
| GO:00162417 | Oral cavity | OSCC | regulation of macroautophagy | 96/7305 | 141/18723 | 2.33e-12 | 9.75e-11 | 96 |
| GO:00482852 | Oral cavity | OSCC | organelle fission | 265/7305 | 488/18723 | 3.22e-12 | 1.27e-10 | 265 |
| GO:001082117 | Oral cavity | OSCC | regulation of mitochondrion organization | 97/7305 | 144/18723 | 4.78e-12 | 1.83e-10 | 97 |
| GO:000756818 | Oral cavity | OSCC | aging | 194/7305 | 339/18723 | 6.18e-12 | 2.33e-10 | 194 |
| GO:00108227 | Oral cavity | OSCC | positive regulation of mitochondrion organization | 53/7305 | 74/18723 | 1.26e-08 | 2.55e-07 | 53 |
| GO:000189017 | Oral cavity | OSCC | placenta development | 87/7305 | 144/18723 | 1.54e-07 | 2.56e-06 | 87 |
| GO:00105087 | Oral cavity | OSCC | positive regulation of autophagy | 77/7305 | 124/18723 | 1.59e-07 | 2.61e-06 | 77 |
| GO:006145817 | Oral cavity | OSCC | reproductive system development | 217/7305 | 427/18723 | 3.75e-07 | 5.63e-06 | 217 |
| GO:003249617 | Oral cavity | OSCC | response to lipopolysaccharide | 178/7305 | 343/18723 | 7.27e-07 | 1.03e-05 | 178 |
| GO:004860816 | Oral cavity | OSCC | reproductive structure development | 214/7305 | 424/18723 | 8.58e-07 | 1.18e-05 | 214 |
| Page: 1 2 3 4 5 6 7 8 9 10 11 12 13 14 15 16 17 18 19 20 |
| Pathway ID | Tissue | Disease Stage | Description | Gene Ratio | Bg Ratio | pvalue | p.adjust | qvalue | Count |
| hsa0520516 | Cervix | CC | Proteoglycans in cancer | 60/1267 | 205/8465 | 9.13e-08 | 1.18e-06 | 7.00e-07 | 60 |
| hsa0520517 | Cervix | CC | Proteoglycans in cancer | 60/1267 | 205/8465 | 9.13e-08 | 1.18e-06 | 7.00e-07 | 60 |
| hsa0520518 | Endometrium | AEH | Proteoglycans in cancer | 53/1197 | 205/8465 | 5.43e-06 | 6.53e-05 | 4.78e-05 | 53 |
| hsa043504 | Endometrium | AEH | TGF-beta signaling pathway | 26/1197 | 108/8465 | 3.82e-03 | 2.18e-02 | 1.59e-02 | 26 |
| hsa0520519 | Endometrium | AEH | Proteoglycans in cancer | 53/1197 | 205/8465 | 5.43e-06 | 6.53e-05 | 4.78e-05 | 53 |
| hsa0435011 | Endometrium | AEH | TGF-beta signaling pathway | 26/1197 | 108/8465 | 3.82e-03 | 2.18e-02 | 1.59e-02 | 26 |
| hsa0520524 | Endometrium | EEC | Proteoglycans in cancer | 52/1237 | 205/8465 | 3.01e-05 | 3.19e-04 | 2.38e-04 | 52 |
| hsa043502 | Endometrium | EEC | TGF-beta signaling pathway | 26/1237 | 108/8465 | 5.95e-03 | 3.12e-02 | 2.33e-02 | 26 |
| hsa0520534 | Endometrium | EEC | Proteoglycans in cancer | 52/1237 | 205/8465 | 3.01e-05 | 3.19e-04 | 2.38e-04 | 52 |
| hsa043503 | Endometrium | EEC | TGF-beta signaling pathway | 26/1237 | 108/8465 | 5.95e-03 | 3.12e-02 | 2.33e-02 | 26 |
| hsa0520529 | Esophagus | ESCC | Proteoglycans in cancer | 138/4205 | 205/8465 | 1.79e-07 | 1.40e-06 | 7.15e-07 | 138 |
| hsa043507 | Esophagus | ESCC | TGF-beta signaling pathway | 69/4205 | 108/8465 | 1.92e-03 | 5.54e-03 | 2.84e-03 | 69 |
| hsa0520537 | Esophagus | ESCC | Proteoglycans in cancer | 138/4205 | 205/8465 | 1.79e-07 | 1.40e-06 | 7.15e-07 | 138 |
| hsa0435014 | Esophagus | ESCC | TGF-beta signaling pathway | 69/4205 | 108/8465 | 1.92e-03 | 5.54e-03 | 2.84e-03 | 69 |
| hsa0520526 | Oral cavity | OSCC | Proteoglycans in cancer | 128/3704 | 205/8465 | 4.00e-08 | 3.12e-07 | 1.59e-07 | 128 |
| hsa043506 | Oral cavity | OSCC | TGF-beta signaling pathway | 60/3704 | 108/8465 | 8.66e-03 | 1.97e-02 | 1.00e-02 | 60 |
| hsa05205111 | Oral cavity | OSCC | Proteoglycans in cancer | 128/3704 | 205/8465 | 4.00e-08 | 3.12e-07 | 1.59e-07 | 128 |
| hsa0435013 | Oral cavity | OSCC | TGF-beta signaling pathway | 60/3704 | 108/8465 | 8.66e-03 | 1.97e-02 | 1.00e-02 | 60 |
| hsa0520527 | Oral cavity | LP | Proteoglycans in cancer | 77/2418 | 205/8465 | 3.01e-03 | 1.29e-02 | 8.35e-03 | 77 |
| hsa0520536 | Oral cavity | LP | Proteoglycans in cancer | 77/2418 | 205/8465 | 3.01e-03 | 1.29e-02 | 8.35e-03 | 77 |
| Page: 1 2 |
Top |
Cell-cell communication analysis |
| Identification of potential cell-cell interactions between two cell types and their ligand-receptor pairs for different disease states |
| Ligand | Receptor | LRpair | Pathway | Tissue | Disease Stage |
| Page: 1 |
Top |
Single-cell gene regulatory network inference analysis |
| Find out the significant the regulons (TFs) and the target genes of each regulon across cell types for different disease states |
| TF | Cell Type | Tissue | Disease Stage | Target Gene | RSS | Regulon Activity |
| ∗The dot plots of a searched regulon are shown for all cell subpopulations in each disease state of each tissue based on the regulon specific score inferred using pySCENIC and by calculating the average expression. |
| Page: 1 |
Top |
Somatic mutation of malignant transformation related genes |
| Annotation of somatic variants for genes involved in malignant transformation |
| Hugo Symbol | Variant Class | Variant Classification | dbSNP RS | HGVSc | HGVSp | HGVSp Short | SWISSPROT | BIOTYPE | SIFT | PolyPhen | Tumor Sample Barcode | Tissue | Histology | Sex | Age | Stage | Therapy Types | Drugs | Outcome |
| DCN | SNV | Missense_Mutation | c.912N>G | p.Ile304Met | p.I304M | P07585 | protein_coding | deleterious(0) | probably_damaging(0.999) | TCGA-AC-A23H-01 | Breast | breast invasive carcinoma | Female | >=65 | I/II | Unknown | Unknown | PD | |
| DCN | SNV | Missense_Mutation | rs777073492 | c.569N>A | p.Gly190Glu | p.G190E | P07585 | protein_coding | tolerated(0.06) | probably_damaging(1) | TCGA-AN-A046-01 | Breast | breast invasive carcinoma | Female | >=65 | I/II | Unknown | Unknown | SD |
| DCN | SNV | Missense_Mutation | c.368N>C | p.Gly123Ala | p.G123A | P07585 | protein_coding | tolerated(0.15) | benign(0.003) | TCGA-D8-A1J8-01 | Breast | breast invasive carcinoma | Female | >=65 | I/II | Hormone Therapy | nolvadex | SD | |
| DCN | insertion | Nonsense_Mutation | novel | c.404_405insGTGCTTAACTACAGATATTTTGAGATACC | p.Tyr135Ter | p.Y135* | P07585 | protein_coding | TCGA-A8-A08P-01 | Breast | breast invasive carcinoma | Female | >=65 | III/IV | Chemotherapy | 5-fluorouracil | CR | ||
| DCN | insertion | Frame_Shift_Ins | novel | c.390_391insGATATTATAAGGAATAGGAGACTATGTCCAATCACGTTCTGTCAGA | p.Leu131AspfsTer44 | p.L131Dfs*44 | P07585 | protein_coding | TCGA-A8-A09K-01 | Breast | breast invasive carcinoma | Female | >=65 | I/II | Unknown | Unknown | SD | ||
| DCN | SNV | Missense_Mutation | novel | c.849N>C | p.Arg283Ser | p.R283S | P07585 | protein_coding | tolerated(0.31) | benign(0.001) | TCGA-AA-3966-01 | Colorectum | colon adenocarcinoma | Female | >=65 | I/II | Unknown | Unknown | SD |
| DCN | SNV | Missense_Mutation | c.425N>C | p.Lys142Thr | p.K142T | P07585 | protein_coding | tolerated(1) | benign(0.011) | TCGA-AD-6548-01 | Colorectum | colon adenocarcinoma | Female | >=65 | I/II | Unknown | Unknown | SD | |
| DCN | SNV | Missense_Mutation | novel | c.449N>C | p.Lys150Thr | p.K150T | P07585 | protein_coding | tolerated(0.07) | possibly_damaging(0.467) | TCGA-CA-6717-01 | Colorectum | colon adenocarcinoma | Male | <65 | I/II | Chemotherapy | oxaliplatin | CR |
| DCN | SNV | Missense_Mutation | c.283N>A | p.Glu95Lys | p.E95K | P07585 | protein_coding | tolerated(0.09) | probably_damaging(0.995) | TCGA-CA-6717-01 | Colorectum | colon adenocarcinoma | Male | <65 | I/II | Chemotherapy | oxaliplatin | CR | |
| DCN | SNV | Missense_Mutation | c.563N>T | p.Ser188Ile | p.S188I | P07585 | protein_coding | deleterious(0) | probably_damaging(0.921) | TCGA-CK-6746-01 | Colorectum | colon adenocarcinoma | Female | >=65 | I/II | Unknown | Unknown | SD |
| Page: 1 2 3 4 5 6 7 |
Top |
Related drugs of malignant transformation related genes |
| Identification of chemicals and drugs interact with genes involved in malignant transfromation |
| (DGIdb 4.0) |
| Entrez ID | Symbol | Category | Interaction Types | Drug Claim Name | Drug Name | PMIDs |
| 1634 | DCN | DRUGGABLE GENOME | IFN | 12707320 | ||
| 1634 | DCN | DRUGGABLE GENOME | HSP70 | 9292805 | ||
| 1634 | DCN | DRUGGABLE GENOME | ASCORBIC ACID | 7944410 | ||
| 1634 | DCN | DRUGGABLE GENOME | RAPAMYCIN | SIROLIMUS | 17200203 |
| Page: 1 |

Copyright 2023-Present -The University of Texas Health Science Center at Houston |