
|
|||||
|
 | |
| |
| |
| |
| |
| |
|
Gene: CTHRC1 |
Gene summary for CTHRC1 |
| Gene information | Species | Human | Gene symbol | CTHRC1 | Gene ID | 115908 |
| Gene name | collagen triple helix repeat containing 1 | |
| Gene Alias | CTHRC1 | |
| Cytomap | 8q22.3 | |
| Gene Type | protein-coding | GO ID | GO:0001503 | UniProtAcc | Q96CG8 |
Top |
Malignant transformation analysis |
| Identification of the aberrant gene expression in precancerous and cancerous lesions by comparing the gene expression of stem-like cells in diseased tissues with normal stem cells |
| Entrez ID | Symbol | Replicates | Species | Organ | Tissue | Adj P-value | Log2FC | Malignancy |
| 115908 | CTHRC1 | GSM4909281 | Human | Breast | IDC | 2.39e-56 | 9.28e-01 | 0.21 |
| 115908 | CTHRC1 | GSM4909282 | Human | Breast | IDC | 7.07e-41 | 7.22e-01 | -0.0288 |
| 115908 | CTHRC1 | GSM4909285 | Human | Breast | IDC | 5.61e-07 | 2.31e-01 | 0.21 |
| 115908 | CTHRC1 | GSM4909286 | Human | Breast | IDC | 5.87e-35 | 5.66e-01 | 0.1081 |
| 115908 | CTHRC1 | GSM4909287 | Human | Breast | IDC | 3.41e-16 | 4.42e-01 | 0.2057 |
| 115908 | CTHRC1 | GSM4909290 | Human | Breast | IDC | 3.64e-39 | 8.20e-01 | 0.2096 |
| 115908 | CTHRC1 | GSM4909302 | Human | Breast | IDC | 6.88e-11 | 3.79e-01 | 0.1545 |
| 115908 | CTHRC1 | GSM4909306 | Human | Breast | IDC | 1.97e-47 | 8.06e-01 | 0.1564 |
| 115908 | CTHRC1 | GSM4909319 | Human | Breast | IDC | 1.02e-16 | 7.08e-01 | 0.1563 |
| 115908 | CTHRC1 | Tumor | Human | Cervix | CC | 1.79e-63 | 9.69e-01 | 0.1241 |
| 115908 | CTHRC1 | sample3 | Human | Cervix | CC | 9.17e-47 | 7.69e-01 | 0.1387 |
| 115908 | CTHRC1 | T3 | Human | Cervix | CC | 4.94e-47 | 7.66e-01 | 0.1389 |
| 115908 | CTHRC1 | LZE5T | Human | Esophagus | ESCC | 7.29e-06 | 5.02e-01 | 0.0514 |
| 115908 | CTHRC1 | LZE24T | Human | Esophagus | ESCC | 1.08e-03 | 1.08e-01 | 0.0596 |
| 115908 | CTHRC1 | LZE21T | Human | Esophagus | ESCC | 1.41e-04 | 5.53e-01 | 0.0655 |
| 115908 | CTHRC1 | P2T-E | Human | Esophagus | ESCC | 1.30e-23 | 5.53e-01 | 0.1177 |
| 115908 | CTHRC1 | P4T-E | Human | Esophagus | ESCC | 2.57e-18 | 2.13e+00 | 0.1323 |
| 115908 | CTHRC1 | P5T-E | Human | Esophagus | ESCC | 2.59e-07 | 1.61e+00 | 0.1327 |
| 115908 | CTHRC1 | P8T-E | Human | Esophagus | ESCC | 4.54e-41 | 9.14e-01 | 0.0889 |
| 115908 | CTHRC1 | P9T-E | Human | Esophagus | ESCC | 3.70e-21 | 2.20e+00 | 0.1131 |
| Page: 1 2 3 4 5 6 |
| Tissue | Expression Dynamics | Abbreviation |
| Breast |  | IDC: Invasive ductal carcinoma |
| DCIS: Ductal carcinoma in situ | ||
| Precancer(BRCA1-mut): Precancerous lesion from BRCA1 mutation carriers | ||
| Cervix | 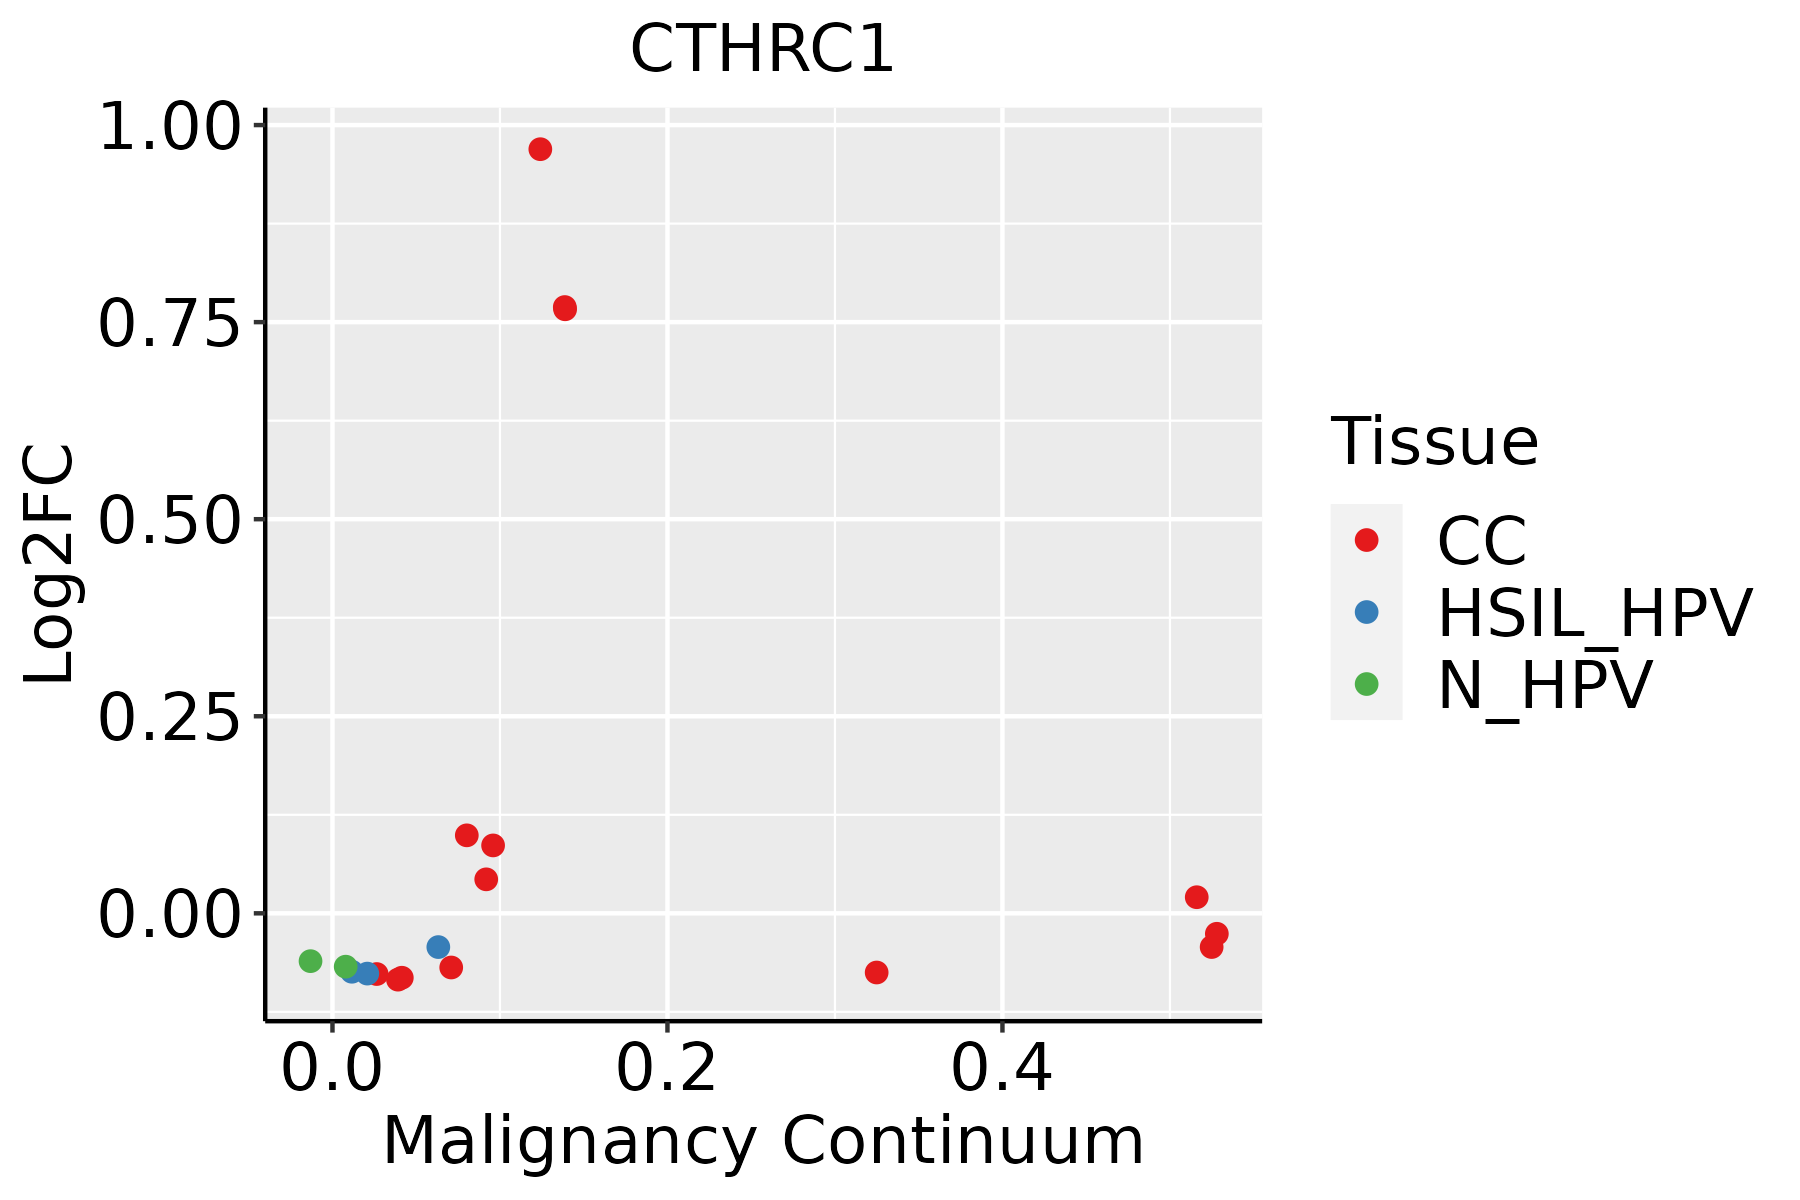 | CC: Cervix cancer |
| HSIL_HPV: HPV-infected high-grade squamous intraepithelial lesions | ||
| N_HPV: HPV-infected normal cervix | ||
| Esophagus |  | ESCC: Esophageal squamous cell carcinoma |
| HGIN: High-grade intraepithelial neoplasias | ||
| LGIN: Low-grade intraepithelial neoplasias | ||
| Liver | 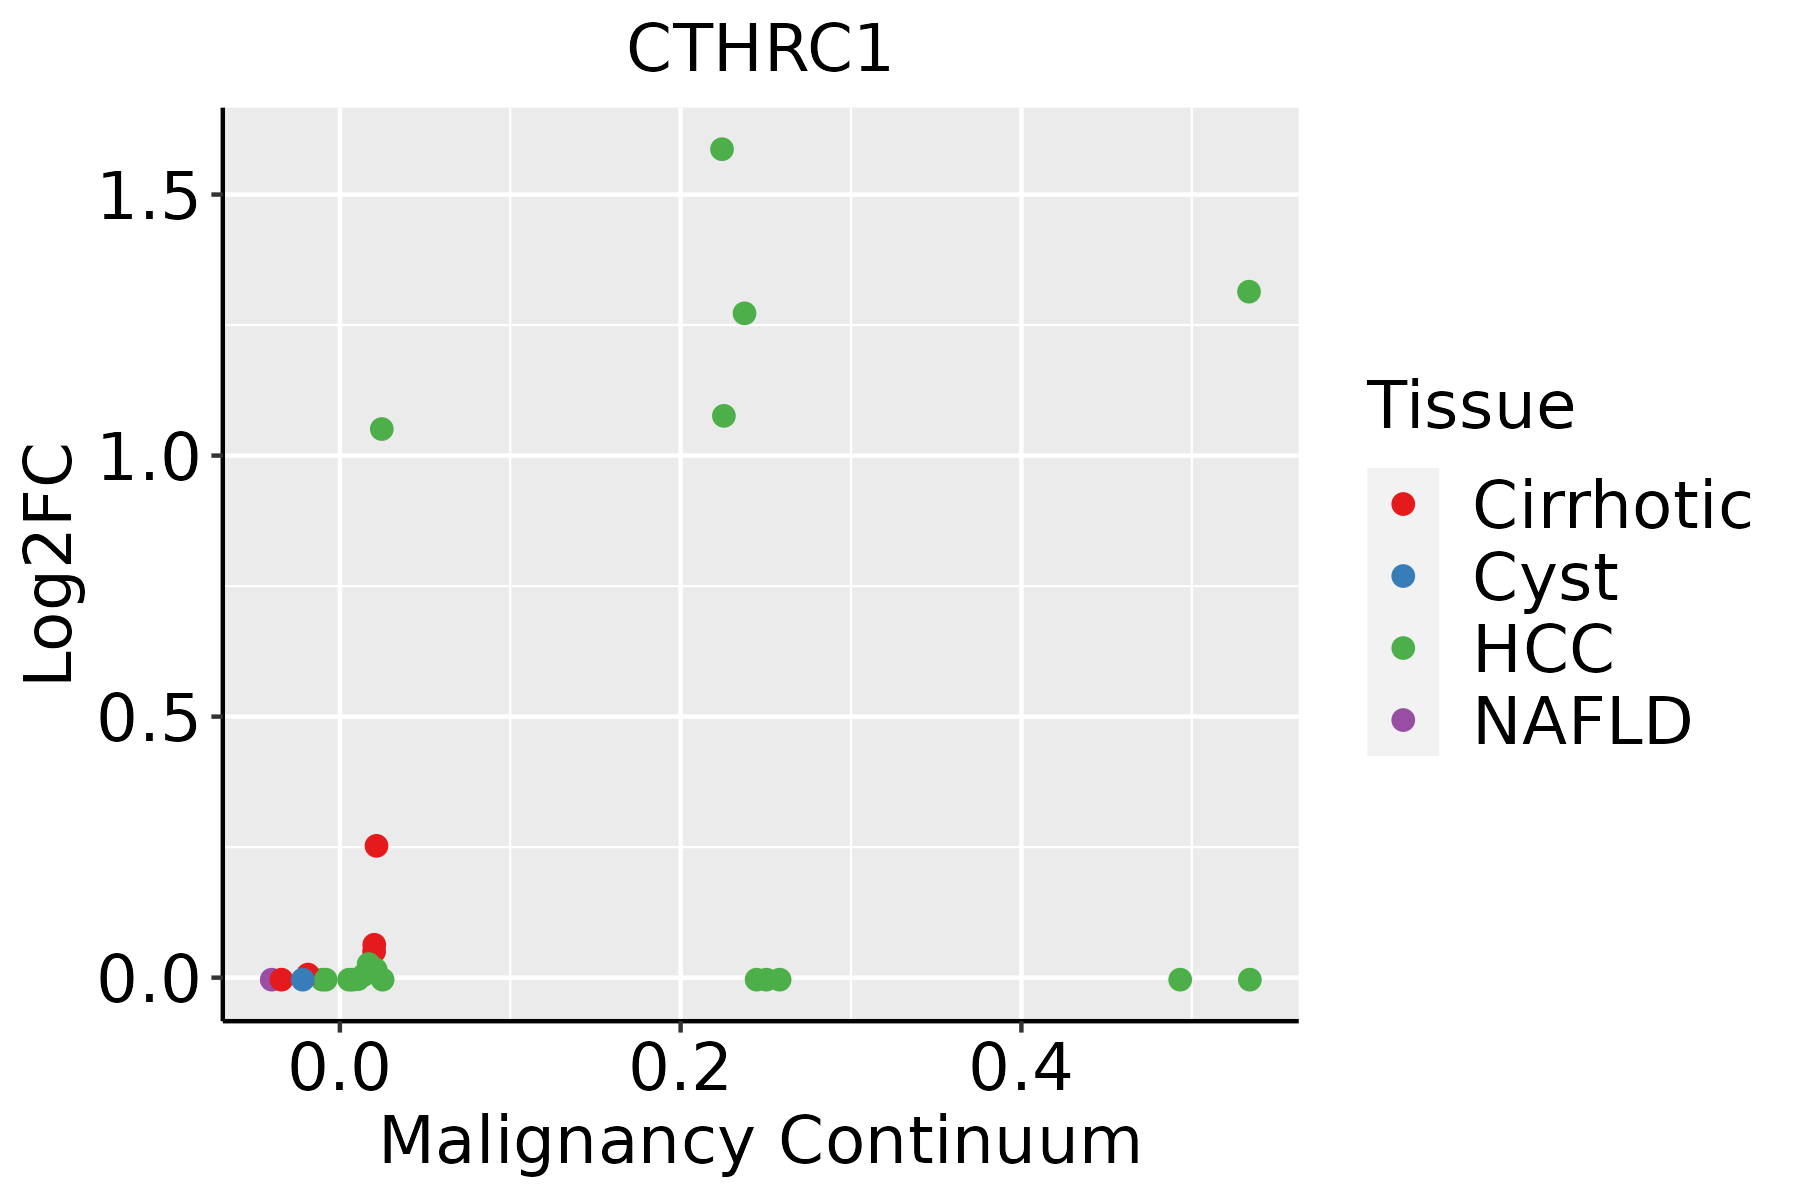 | HCC: Hepatocellular carcinoma |
| NAFLD: Non-alcoholic fatty liver disease | ||
| Oral Cavity | 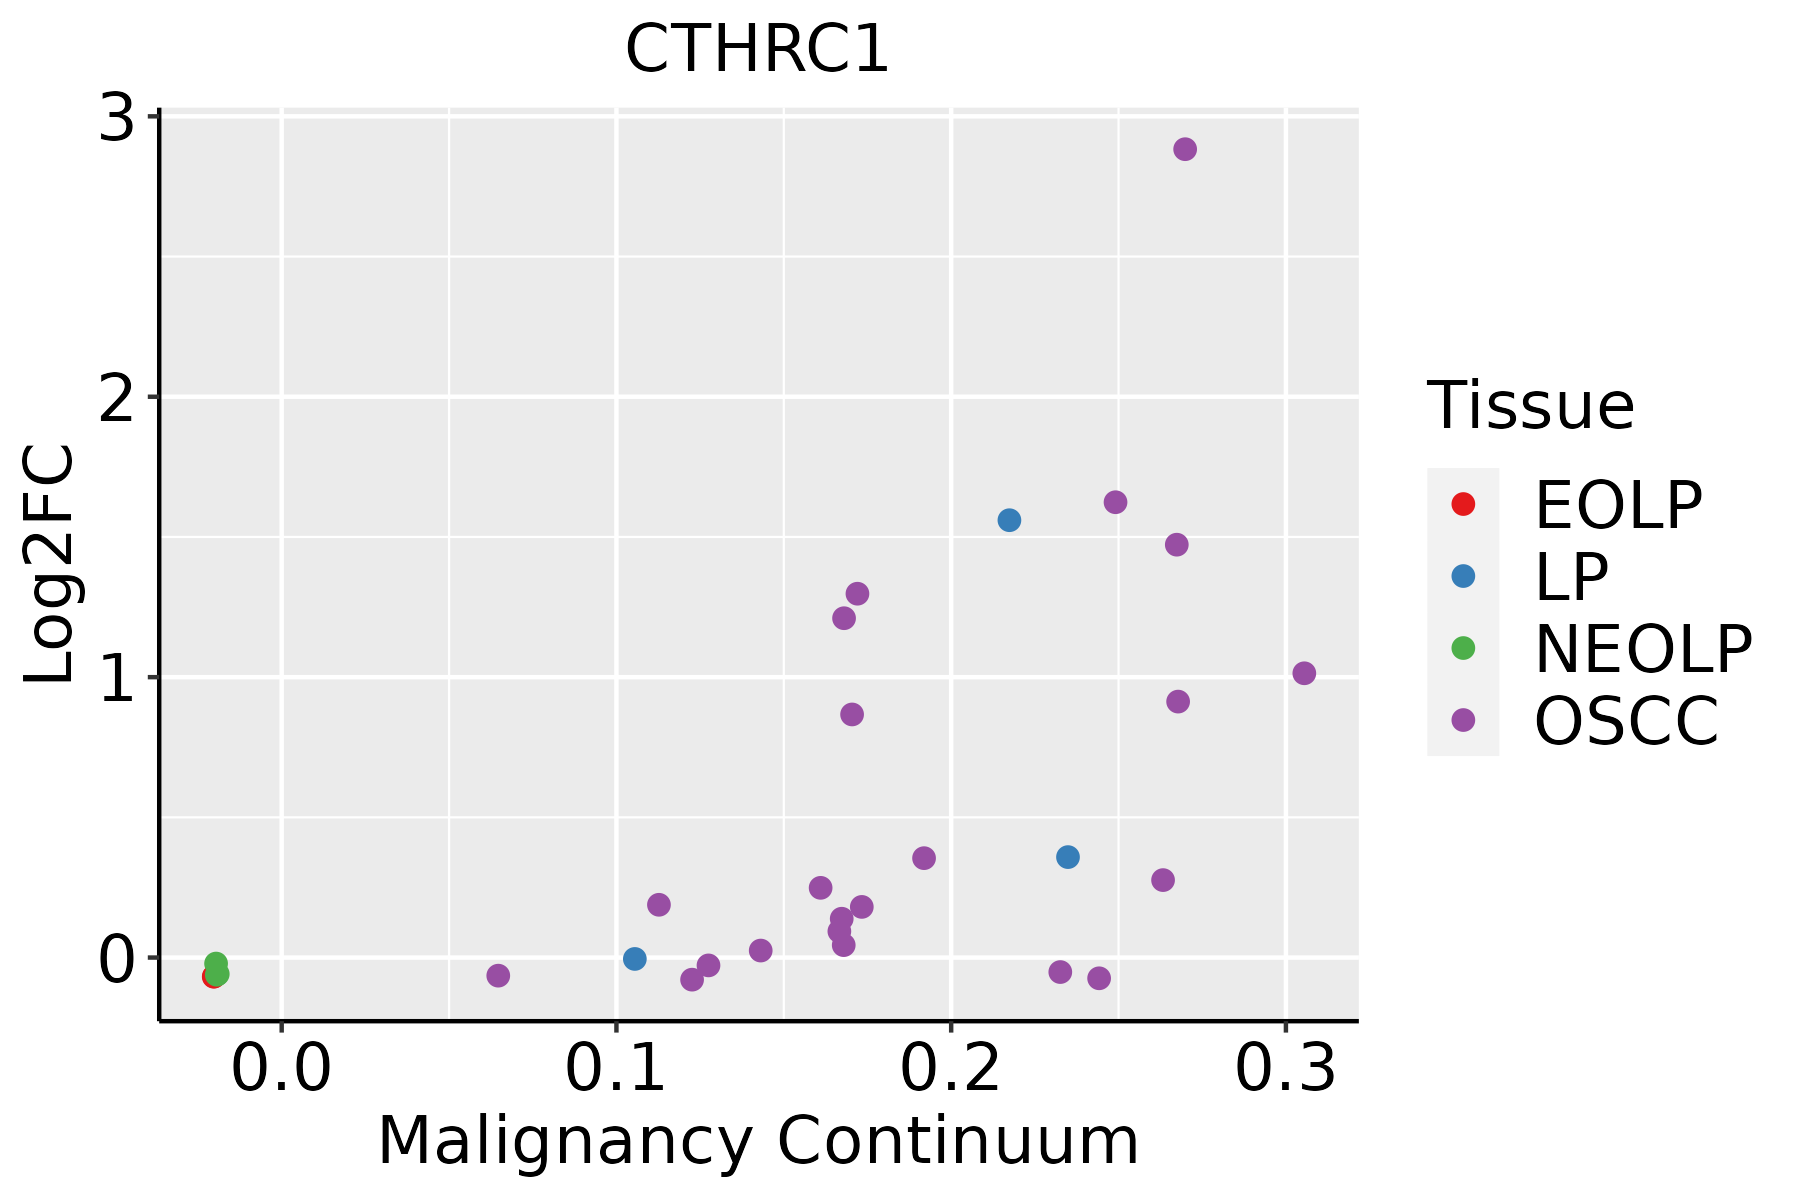 | EOLP: Erosive Oral lichen planus |
| LP: leukoplakia | ||
| NEOLP: Non-erosive oral lichen planus | ||
| OSCC: Oral squamous cell carcinoma | ||
| Skin | 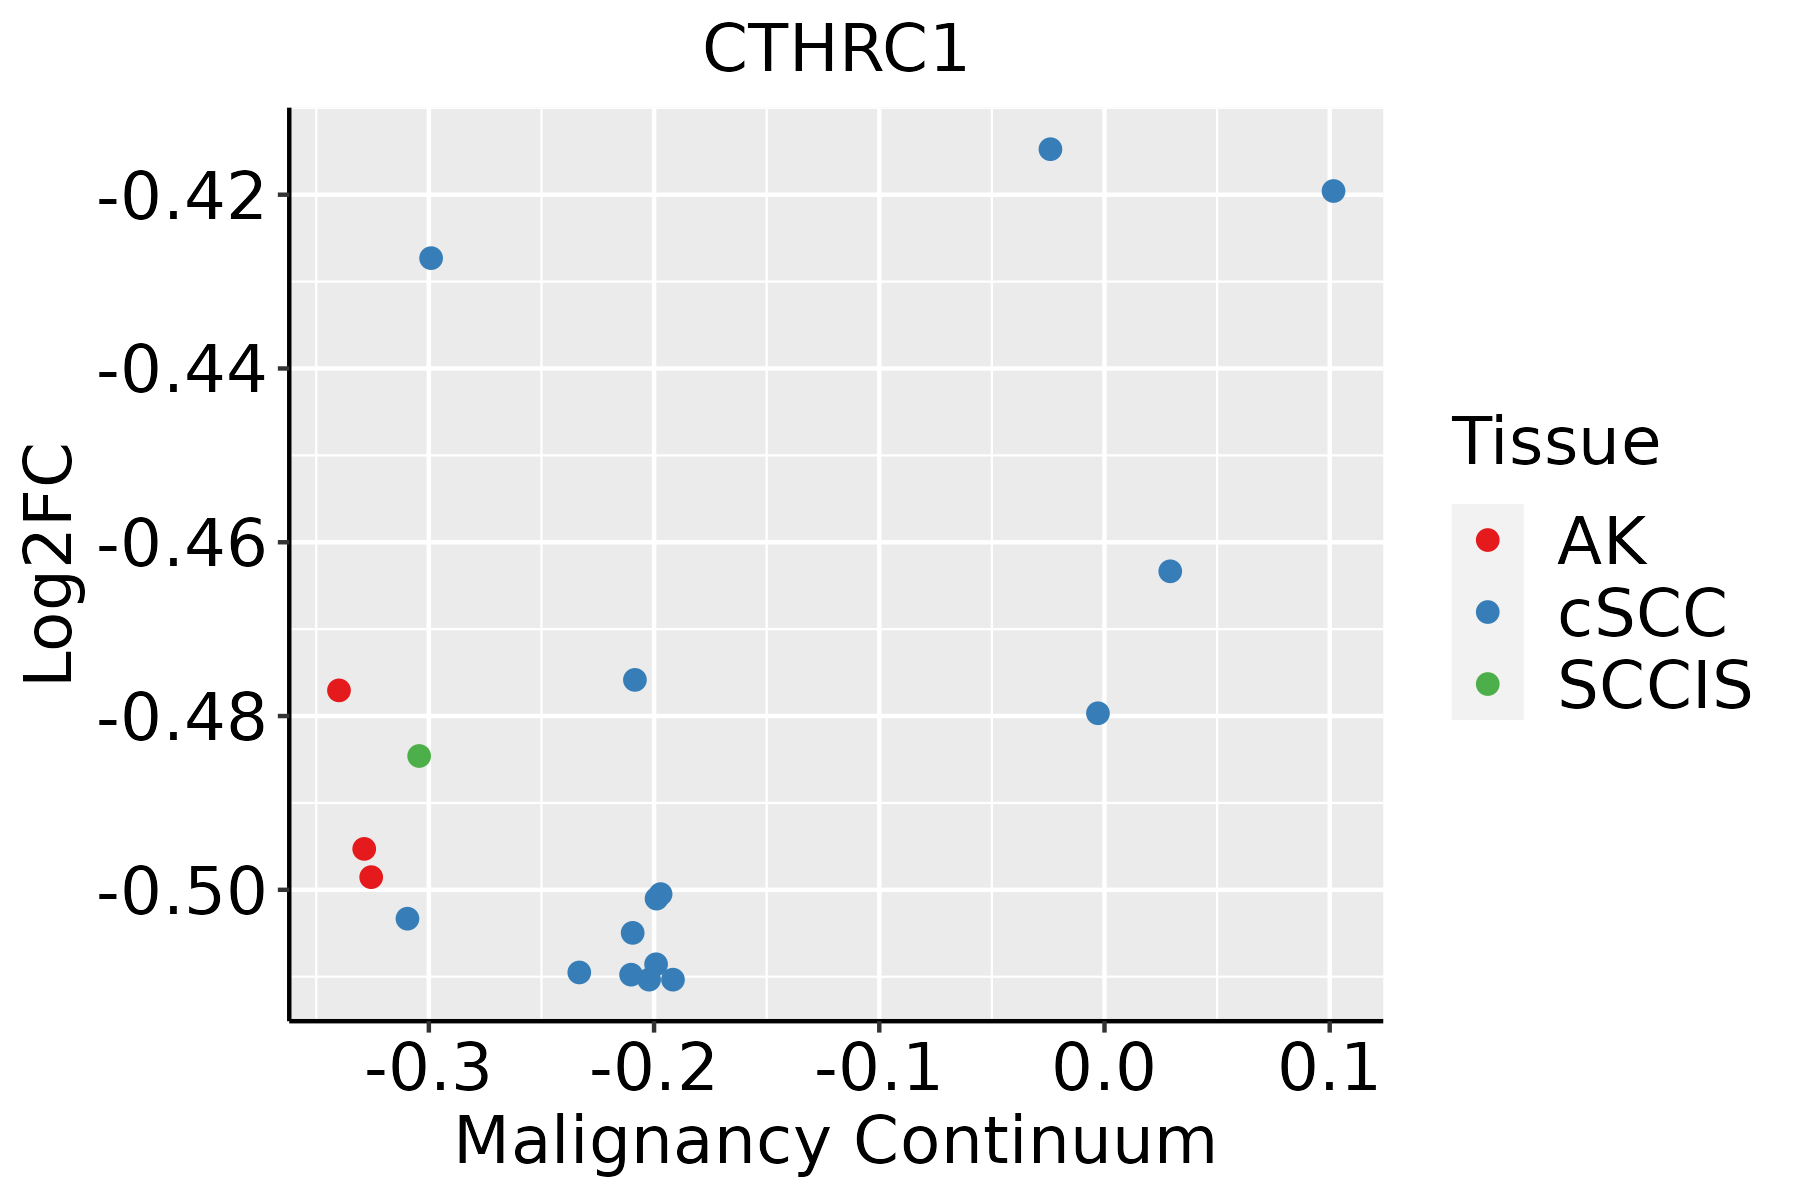 | AK: Actinic keratosis |
| cSCC: Cutaneous squamous cell carcinoma | ||
| SCCIS:squamous cell carcinoma in situ | ||
| Thyroid | 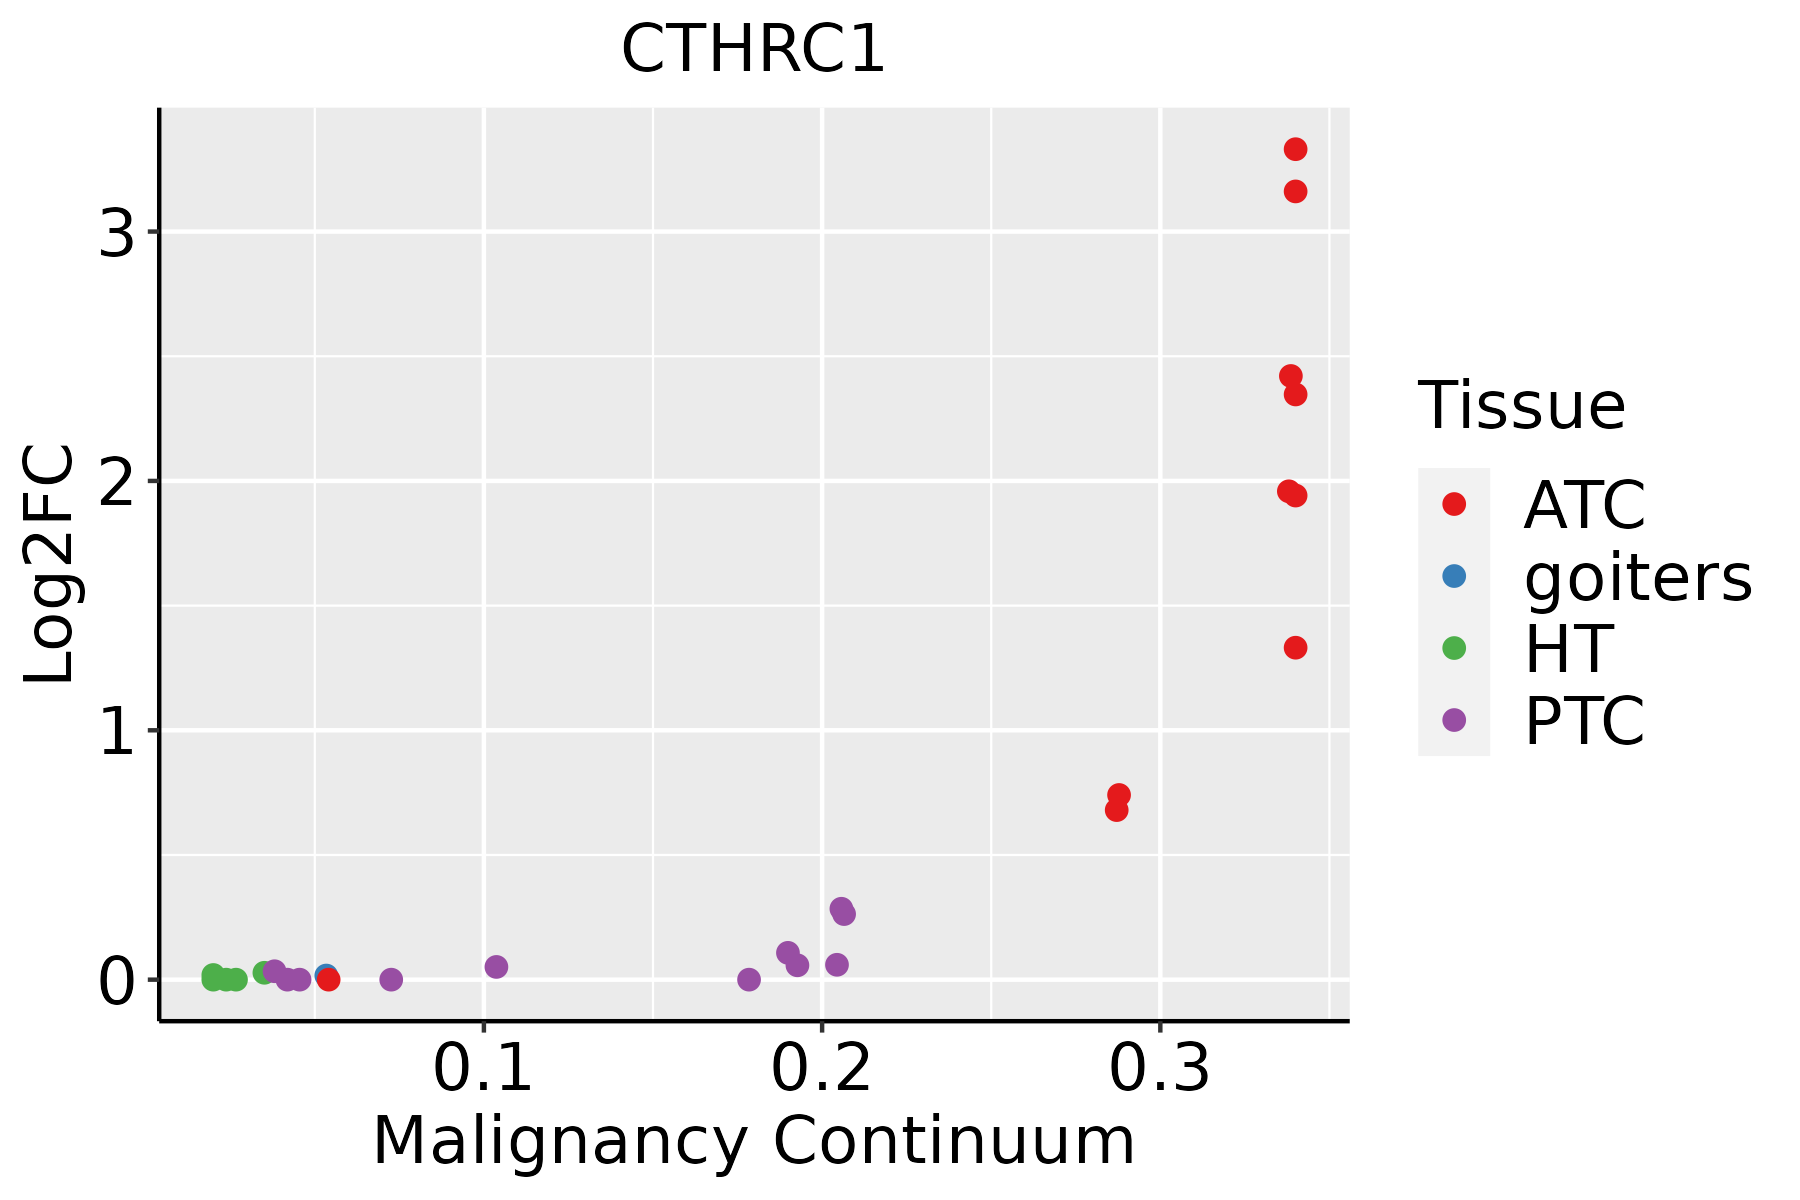 | ATC: Anaplastic thyroid cancer |
| HT: Hashimoto's thyroiditis | ||
| PTC: Papillary thyroid cancer |
| ∗log2FC in expression of this searched gene in stem-like cells from each diseased tissue sample relative to stem-like cells in normal samples in each tissue plotted against the malignancy continuum. Samples are colored based on if they are from different disease stage. |
Top |
Malignant transformation related pathway analysis |
| Find out the enriched GO biological processes and KEGG pathways involved in transition from healthy to precancer to cancer |
| Tissue | Disease Stage | Enriched GO biological Processes |
| Colorectum | AD |  |
| Colorectum | SER |  |
| Colorectum | MSS |  |
| Colorectum | MSI-H |  |
| Colorectum | FAP |  |
| ∗Top 15 enriched GO BP terms are showed in the bar plot of each disease state in each tissue. Each row represents a significant GO biological process which is colored according to the -log10(p.adjust). |
| Page: 1 2 3 4 5 6 7 8 9 |
| GO ID | Tissue | Disease Stage | Description | Gene Ratio | Bg Ratio | pvalue | p.adjust | Count |
| GO:002191510 | Skin | AK | neural tube development | 28/1910 | 152/18723 | 1.44e-03 | 1.06e-02 | 28 |
| GO:00600715 | Skin | AK | Wnt signaling pathway, planar cell polarity pathway | 13/1910 | 52/18723 | 1.75e-03 | 1.23e-02 | 13 |
| GO:001402010 | Skin | AK | primary neural tube formation | 19/1910 | 94/18723 | 2.72e-03 | 1.74e-02 | 19 |
| GO:00901754 | Skin | AK | regulation of establishment of planar polarity | 13/1910 | 56/18723 | 3.55e-03 | 2.15e-02 | 13 |
| GO:20000275 | Skin | AK | regulation of animal organ morphogenesis | 23/1910 | 125/18723 | 3.72e-03 | 2.22e-02 | 23 |
| GO:00017362 | Skin | AK | establishment of planar polarity | 15/1910 | 72/18723 | 5.43e-03 | 3.01e-02 | 15 |
| GO:00071642 | Skin | AK | establishment of tissue polarity | 15/1910 | 72/18723 | 5.43e-03 | 3.01e-02 | 15 |
| GO:00487714 | Skin | AK | tissue remodeling | 29/1910 | 175/18723 | 5.97e-03 | 3.23e-02 | 29 |
| GO:00018439 | Skin | AK | neural tube closure | 17/1910 | 88/18723 | 7.11e-03 | 3.64e-02 | 17 |
| GO:00606068 | Skin | AK | tube closure | 17/1910 | 89/18723 | 7.98e-03 | 4.03e-02 | 17 |
| GO:0001649110 | Skin | SCCIS | osteoblast differentiation | 34/919 | 229/18723 | 7.78e-09 | 2.95e-06 | 34 |
| GO:001605519 | Skin | SCCIS | Wnt signaling pathway | 51/919 | 444/18723 | 1.48e-08 | 4.37e-06 | 51 |
| GO:019873819 | Skin | SCCIS | cell-cell signaling by wnt | 51/919 | 446/18723 | 1.72e-08 | 4.81e-06 | 51 |
| GO:003011119 | Skin | SCCIS | regulation of Wnt signaling pathway | 41/919 | 328/18723 | 3.79e-08 | 7.72e-06 | 41 |
| GO:000150319 | Skin | SCCIS | ossification | 47/919 | 408/18723 | 5.02e-08 | 8.19e-06 | 47 |
| GO:006007018 | Skin | SCCIS | canonical Wnt signaling pathway | 36/919 | 303/18723 | 8.82e-07 | 6.24e-05 | 36 |
| GO:006082819 | Skin | SCCIS | regulation of canonical Wnt signaling pathway | 31/919 | 253/18723 | 2.62e-06 | 1.28e-04 | 31 |
| GO:0051099112 | Skin | SCCIS | positive regulation of binding | 24/919 | 173/18723 | 4.14e-06 | 1.82e-04 | 24 |
| GO:0051098112 | Skin | SCCIS | regulation of binding | 38/919 | 363/18723 | 9.41e-06 | 3.35e-04 | 38 |
| GO:003209218 | Skin | SCCIS | positive regulation of protein binding | 13/919 | 85/18723 | 2.45e-04 | 4.48e-03 | 13 |
| Page: 1 2 3 4 5 6 7 8 9 10 11 12 13 14 |
| Pathway ID | Tissue | Disease Stage | Description | Gene Ratio | Bg Ratio | pvalue | p.adjust | qvalue | Count |
| Page: 1 |
Top |
Cell-cell communication analysis |
| Identification of potential cell-cell interactions between two cell types and their ligand-receptor pairs for different disease states |
| Ligand | Receptor | LRpair | Pathway | Tissue | Disease Stage |
| Page: 1 |
Top |
Single-cell gene regulatory network inference analysis |
| Find out the significant the regulons (TFs) and the target genes of each regulon across cell types for different disease states |
| TF | Cell Type | Tissue | Disease Stage | Target Gene | RSS | Regulon Activity |
| ∗The dot plots of a searched regulon are shown for all cell subpopulations in each disease state of each tissue based on the regulon specific score inferred using pySCENIC and by calculating the average expression. |
| Page: 1 |
Top |
Somatic mutation of malignant transformation related genes |
| Annotation of somatic variants for genes involved in malignant transformation |
| Hugo Symbol | Variant Class | Variant Classification | dbSNP RS | HGVSc | HGVSp | HGVSp Short | SWISSPROT | BIOTYPE | SIFT | PolyPhen | Tumor Sample Barcode | Tissue | Histology | Sex | Age | Stage | Therapy Types | Drugs | Outcome |
| CTHRC1 | insertion | Nonsense_Mutation | novel | c.472_473insCAGTAAATATTTTTTGAATGCAAAAACAAGAGGAAATATATAAATTG | p.Tyr158SerfsTer6 | p.Y158Sfs*6 | Q96CG8 | protein_coding | TCGA-B6-A0IA-01 | Breast | breast invasive carcinoma | Female | <65 | I/II | Unknown | Unknown | SD | ||
| CTHRC1 | insertion | Nonsense_Mutation | novel | c.492_493insTAAAAACAGGGA | p.Ala164_Glu165insTer | p.A164_E165ins* | Q96CG8 | protein_coding | TCGA-B6-A0IB-01 | Breast | breast invasive carcinoma | Female | <65 | III/IV | Unknown | Unknown | PD | ||
| CTHRC1 | SNV | Missense_Mutation | novel | c.584N>T | p.Ser195Phe | p.S195F | Q96CG8 | protein_coding | deleterious(0.01) | possibly_damaging(0.459) | TCGA-VS-A9UM-01 | Cervix | cervical & endocervical cancer | Female | <65 | I/II | Chemotherapy | cisplatin | CR |
| CTHRC1 | SNV | Missense_Mutation | rs767759004 | c.704N>A | p.Arg235His | p.R235H | Q96CG8 | protein_coding | deleterious(0) | probably_damaging(0.996) | TCGA-AA-3977-01 | Colorectum | colon adenocarcinoma | Male | >=65 | I/II | Unknown | Unknown | SD |
| CTHRC1 | SNV | Missense_Mutation | rs374084026 | c.371C>T | p.Ala124Val | p.A124V | Q96CG8 | protein_coding | tolerated(0.61) | benign(0.122) | TCGA-AA-A00N-01 | Colorectum | colon adenocarcinoma | Male | >=65 | I/II | Unknown | Unknown | PD |
| CTHRC1 | SNV | Missense_Mutation | rs141428810 | c.577C>T | p.Arg193Cys | p.R193C | Q96CG8 | protein_coding | deleterious(0) | probably_damaging(0.996) | TCGA-AA-A010-01 | Colorectum | colon adenocarcinoma | Female | <65 | I/II | Chemotherapy | folinic | CR |
| CTHRC1 | SNV | Missense_Mutation | rs767061518 | c.248N>A | p.Arg83Gln | p.R83Q | Q96CG8 | protein_coding | tolerated(0.05) | possibly_damaging(0.777) | TCGA-AZ-6601-01 | Colorectum | colon adenocarcinoma | Male | >=65 | I/II | Unknown | Unknown | PD |
| CTHRC1 | SNV | Missense_Mutation | rs36115601 | c.578N>A | p.Arg193His | p.R193H | Q96CG8 | protein_coding | deleterious(0) | probably_damaging(0.996) | TCGA-AZ-6601-01 | Colorectum | colon adenocarcinoma | Male | >=65 | I/II | Unknown | Unknown | PD |
| CTHRC1 | SNV | Missense_Mutation | novel | c.449N>A | p.Arg150Lys | p.R150K | Q96CG8 | protein_coding | tolerated(1) | benign(0) | TCGA-AG-A002-01 | Colorectum | rectum adenocarcinoma | Male | <65 | I/II | Unknown | Unknown | SD |
| CTHRC1 | SNV | Missense_Mutation | novel | c.520N>T | p.Ala174Ser | p.A174S | Q96CG8 | protein_coding | tolerated(0.34) | benign(0) | TCGA-AJ-A3EL-01 | Endometrium | uterine corpus endometrioid carcinoma | Female | <65 | I/II | Unknown | Unknown | SD |
| Page: 1 2 3 |
Top |
Related drugs of malignant transformation related genes |
| Identification of chemicals and drugs interact with genes involved in malignant transfromation |
| (DGIdb 4.0) |
| Entrez ID | Symbol | Category | Interaction Types | Drug Claim Name | Drug Name | PMIDs |
| Page: 1 |

Copyright 2023-Present -The University of Texas Health Science Center at Houston |