
|
|||||
|
 | |
| |
| |
| |
| |
| |
|
Gene: COMMD1 |
Gene summary for COMMD1 |
| Gene information | Species | Human | Gene symbol | COMMD1 | Gene ID | 150684 |
| Gene name | copper metabolism domain containing 1 | |
| Gene Alias | C2orf5 | |
| Cytomap | 2p15 | |
| Gene Type | protein-coding | GO ID | GO:0002028 | UniProtAcc | Q8N668 |
Top |
Malignant transformation analysis |
| Identification of the aberrant gene expression in precancerous and cancerous lesions by comparing the gene expression of stem-like cells in diseased tissues with normal stem cells |
| Entrez ID | Symbol | Replicates | Species | Organ | Tissue | Adj P-value | Log2FC | Malignancy |
| 150684 | COMMD1 | HTA11_3410_2000001011 | Human | Colorectum | AD | 1.03e-13 | -4.62e-01 | 0.0155 |
| 150684 | COMMD1 | HTA11_866_3004761011 | Human | Colorectum | AD | 7.84e-05 | -3.14e-01 | 0.096 |
| 150684 | COMMD1 | HTA11_99999970781_79442 | Human | Colorectum | MSS | 7.11e-17 | -4.48e-01 | 0.294 |
| 150684 | COMMD1 | HTA11_99999971662_82457 | Human | Colorectum | MSS | 1.14e-03 | -3.58e-01 | 0.3859 |
| 150684 | COMMD1 | HTA11_99999974143_84620 | Human | Colorectum | MSS | 1.08e-03 | -2.96e-01 | 0.3005 |
| 150684 | COMMD1 | A015-C-203 | Human | Colorectum | FAP | 8.44e-20 | -4.72e-01 | -0.1294 |
| 150684 | COMMD1 | A015-C-204 | Human | Colorectum | FAP | 4.34e-04 | -3.33e-01 | -0.0228 |
| 150684 | COMMD1 | A014-C-040 | Human | Colorectum | FAP | 9.11e-03 | -4.10e-01 | -0.1184 |
| 150684 | COMMD1 | A002-C-201 | Human | Colorectum | FAP | 3.39e-13 | -4.23e-01 | 0.0324 |
| 150684 | COMMD1 | A001-C-119 | Human | Colorectum | FAP | 1.87e-06 | -4.05e-01 | -0.1557 |
| 150684 | COMMD1 | A001-C-108 | Human | Colorectum | FAP | 3.91e-13 | -3.31e-01 | -0.0272 |
| 150684 | COMMD1 | A002-C-205 | Human | Colorectum | FAP | 1.18e-20 | -5.10e-01 | -0.1236 |
| 150684 | COMMD1 | A015-C-006 | Human | Colorectum | FAP | 3.97e-11 | -4.14e-01 | -0.0994 |
| 150684 | COMMD1 | A015-C-106 | Human | Colorectum | FAP | 6.34e-11 | -2.66e-01 | -0.0511 |
| 150684 | COMMD1 | A002-C-114 | Human | Colorectum | FAP | 2.64e-13 | -4.28e-01 | -0.1561 |
| 150684 | COMMD1 | A015-C-104 | Human | Colorectum | FAP | 7.50e-21 | -4.95e-01 | -0.1899 |
| 150684 | COMMD1 | A001-C-014 | Human | Colorectum | FAP | 4.93e-12 | -3.83e-01 | 0.0135 |
| 150684 | COMMD1 | A002-C-016 | Human | Colorectum | FAP | 7.13e-16 | -3.72e-01 | 0.0521 |
| 150684 | COMMD1 | A015-C-002 | Human | Colorectum | FAP | 1.84e-10 | -5.21e-01 | -0.0763 |
| 150684 | COMMD1 | A001-C-203 | Human | Colorectum | FAP | 7.20e-05 | -1.73e-01 | -0.0481 |
| Page: 1 2 3 4 5 6 7 8 9 |
| Tissue | Expression Dynamics | Abbreviation |
| Colorectum (GSE201348) | 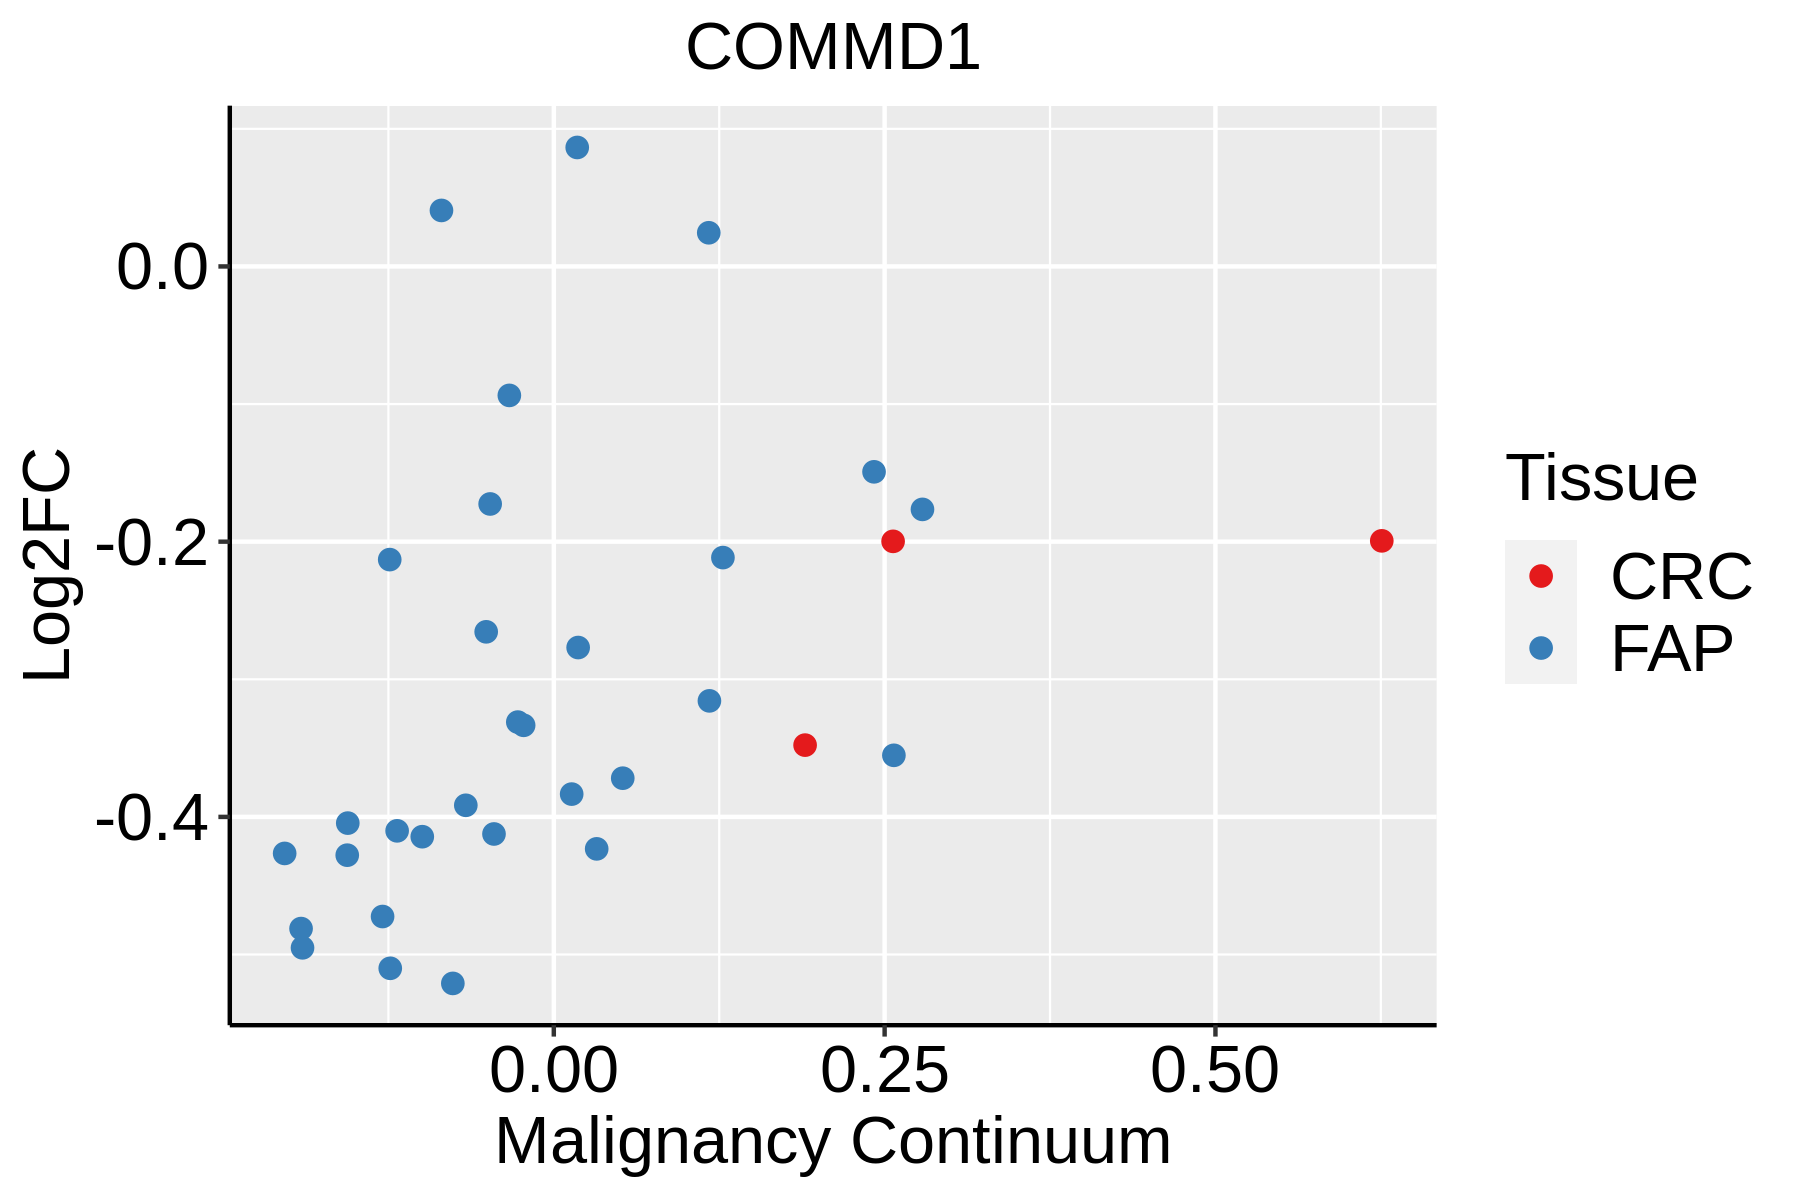 | FAP: Familial adenomatous polyposis |
| CRC: Colorectal cancer | ||
| Colorectum (HTA11) | 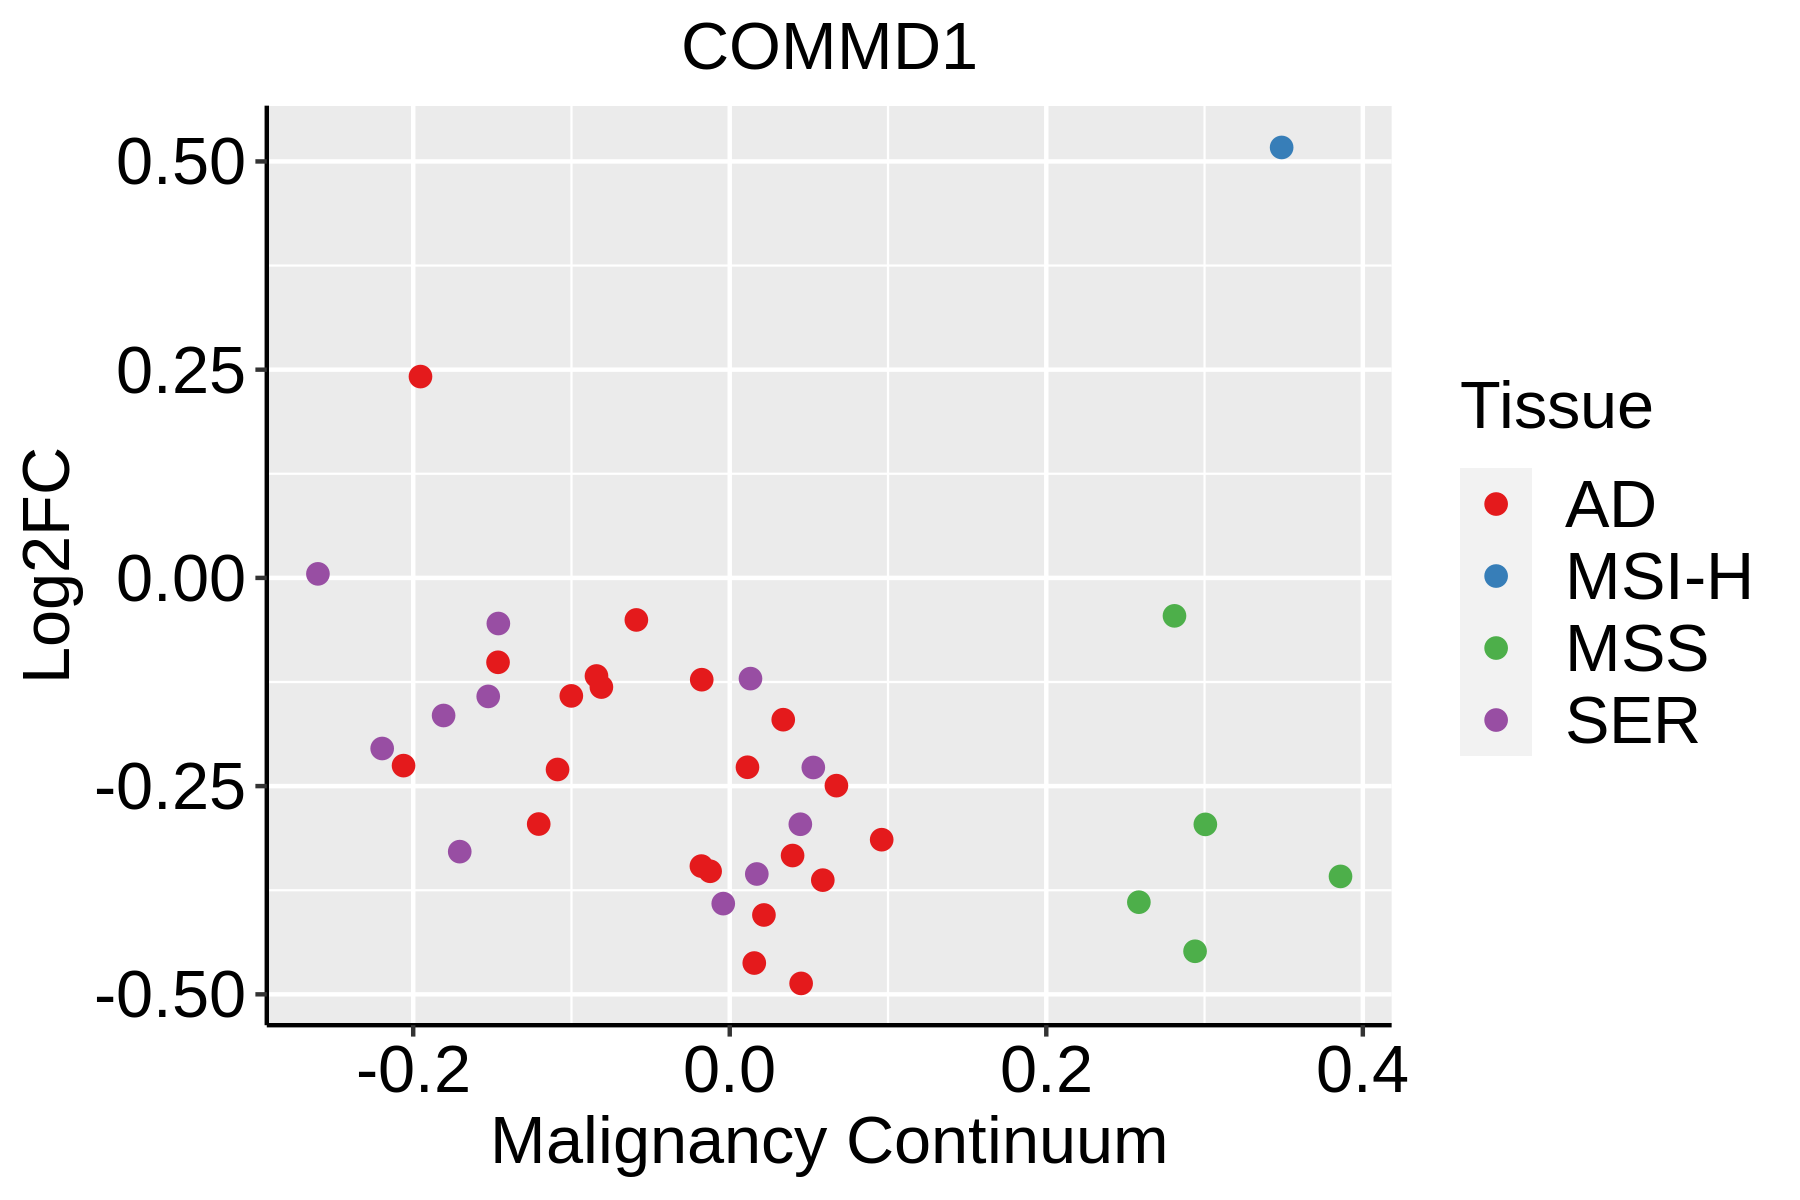 | AD: Adenomas |
| SER: Sessile serrated lesions | ||
| MSI-H: Microsatellite-high colorectal cancer | ||
| MSS: Microsatellite stable colorectal cancer | ||
| Esophagus | 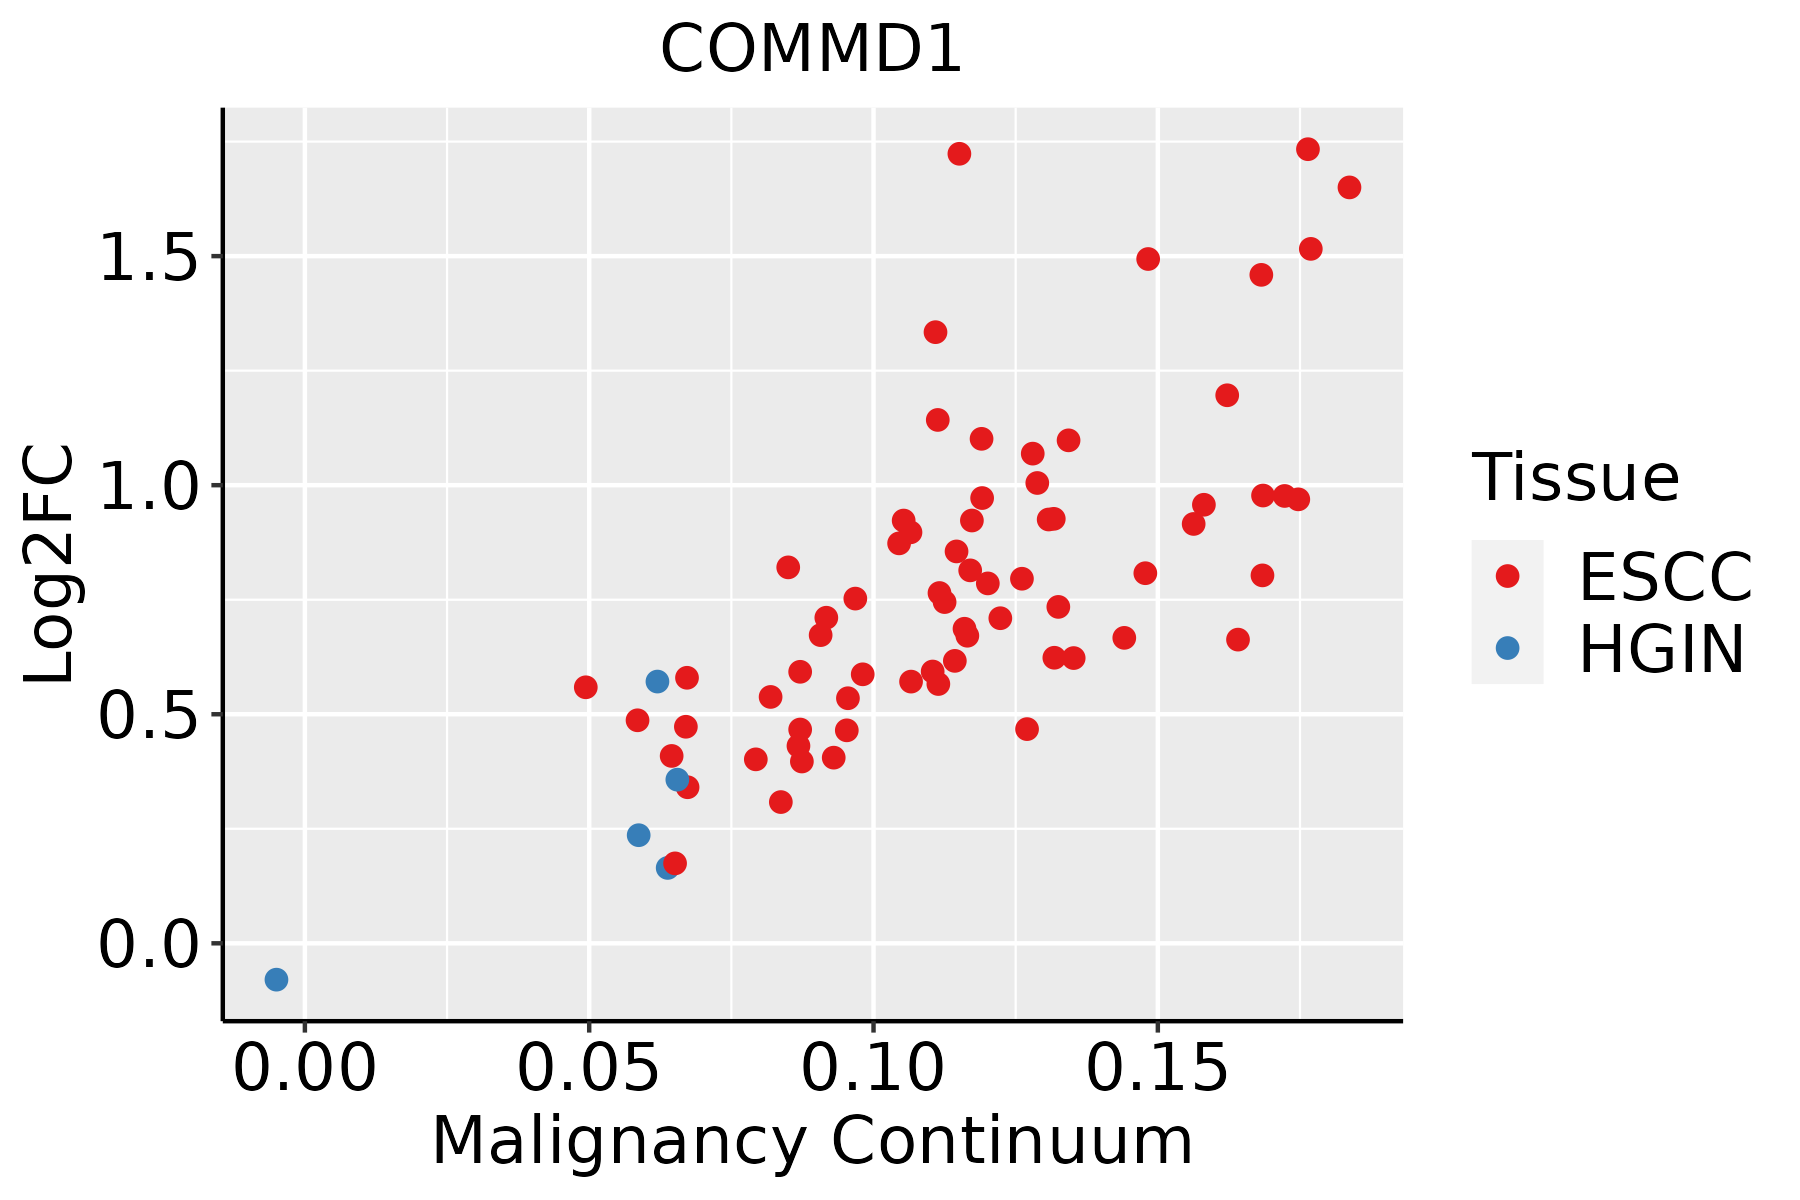 | ESCC: Esophageal squamous cell carcinoma |
| HGIN: High-grade intraepithelial neoplasias | ||
| LGIN: Low-grade intraepithelial neoplasias | ||
| Liver |  | HCC: Hepatocellular carcinoma |
| NAFLD: Non-alcoholic fatty liver disease | ||
| Lung | 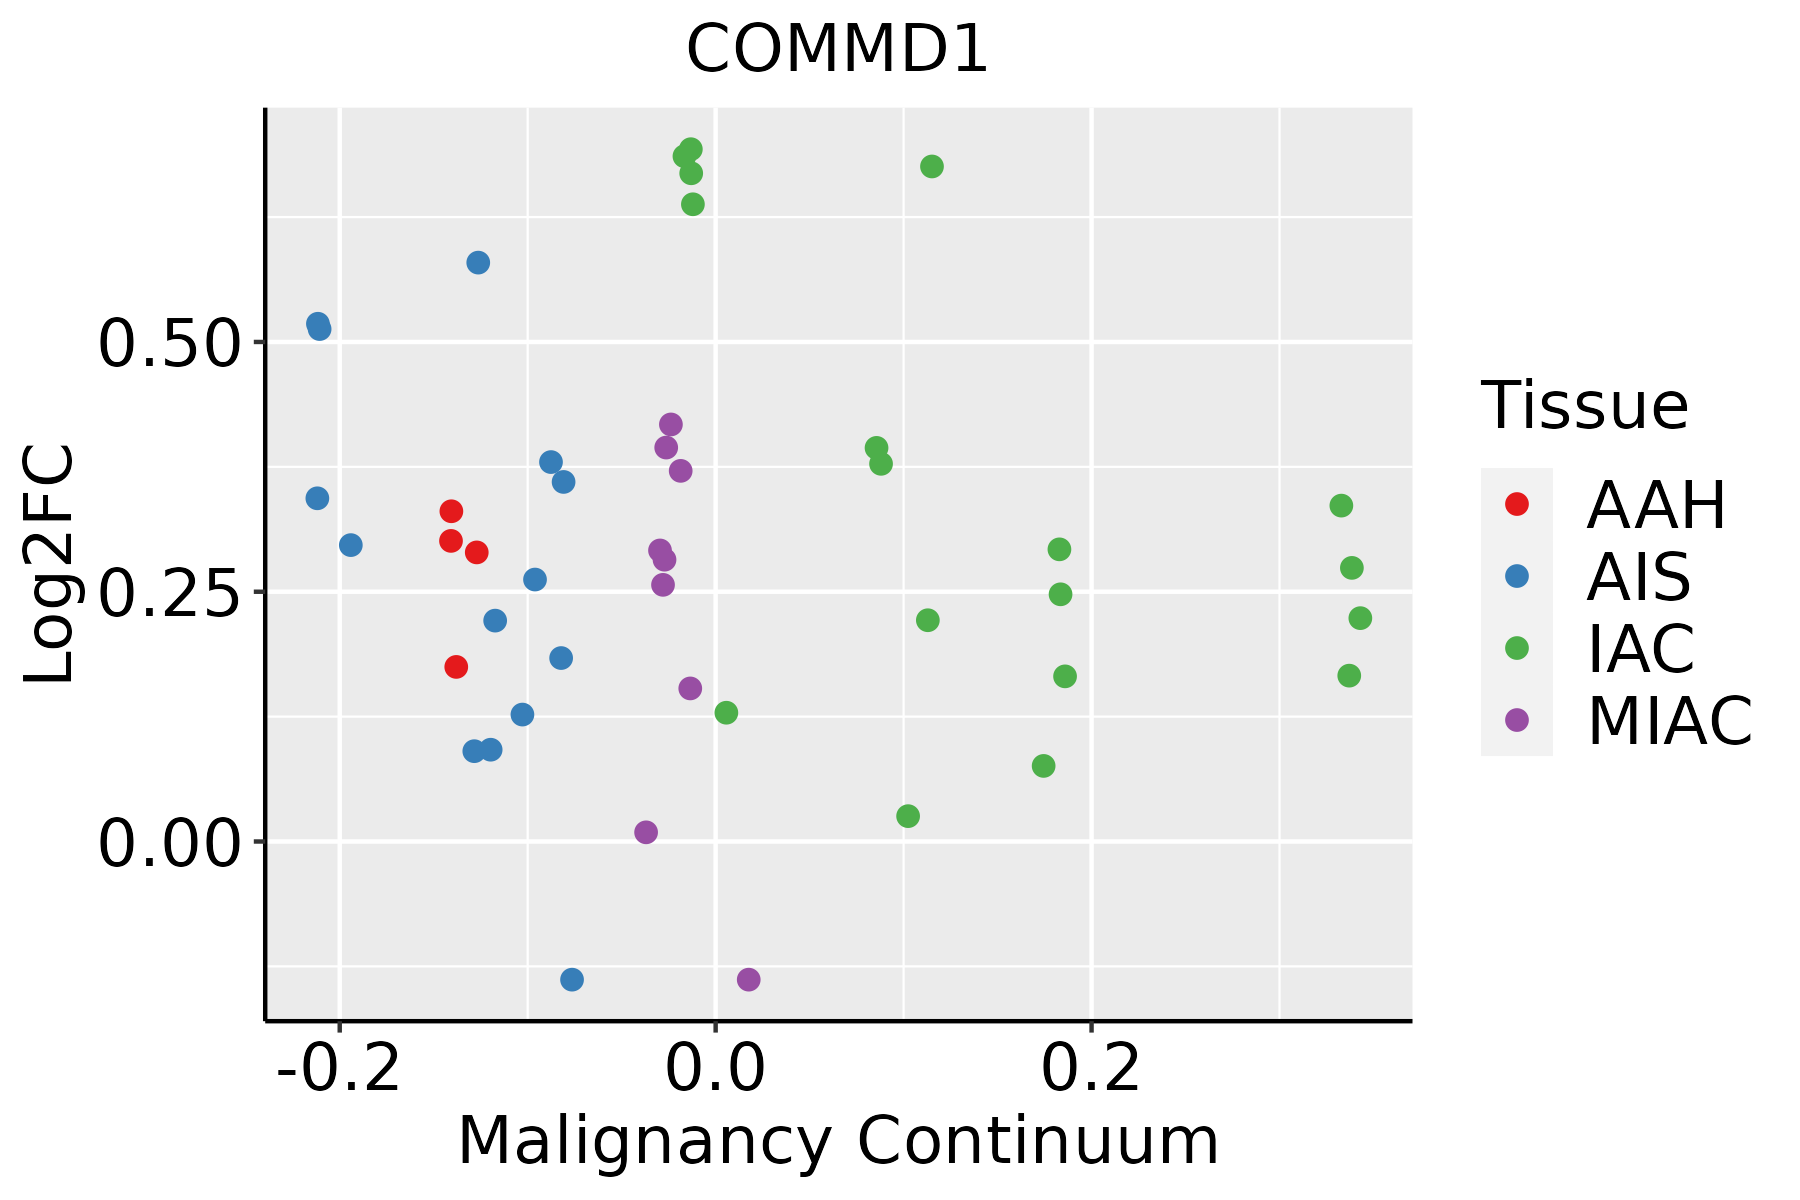 | AAH: Atypical adenomatous hyperplasia |
| AIS: Adenocarcinoma in situ | ||
| IAC: Invasive lung adenocarcinoma | ||
| MIA: Minimally invasive adenocarcinoma | ||
| Oral Cavity | 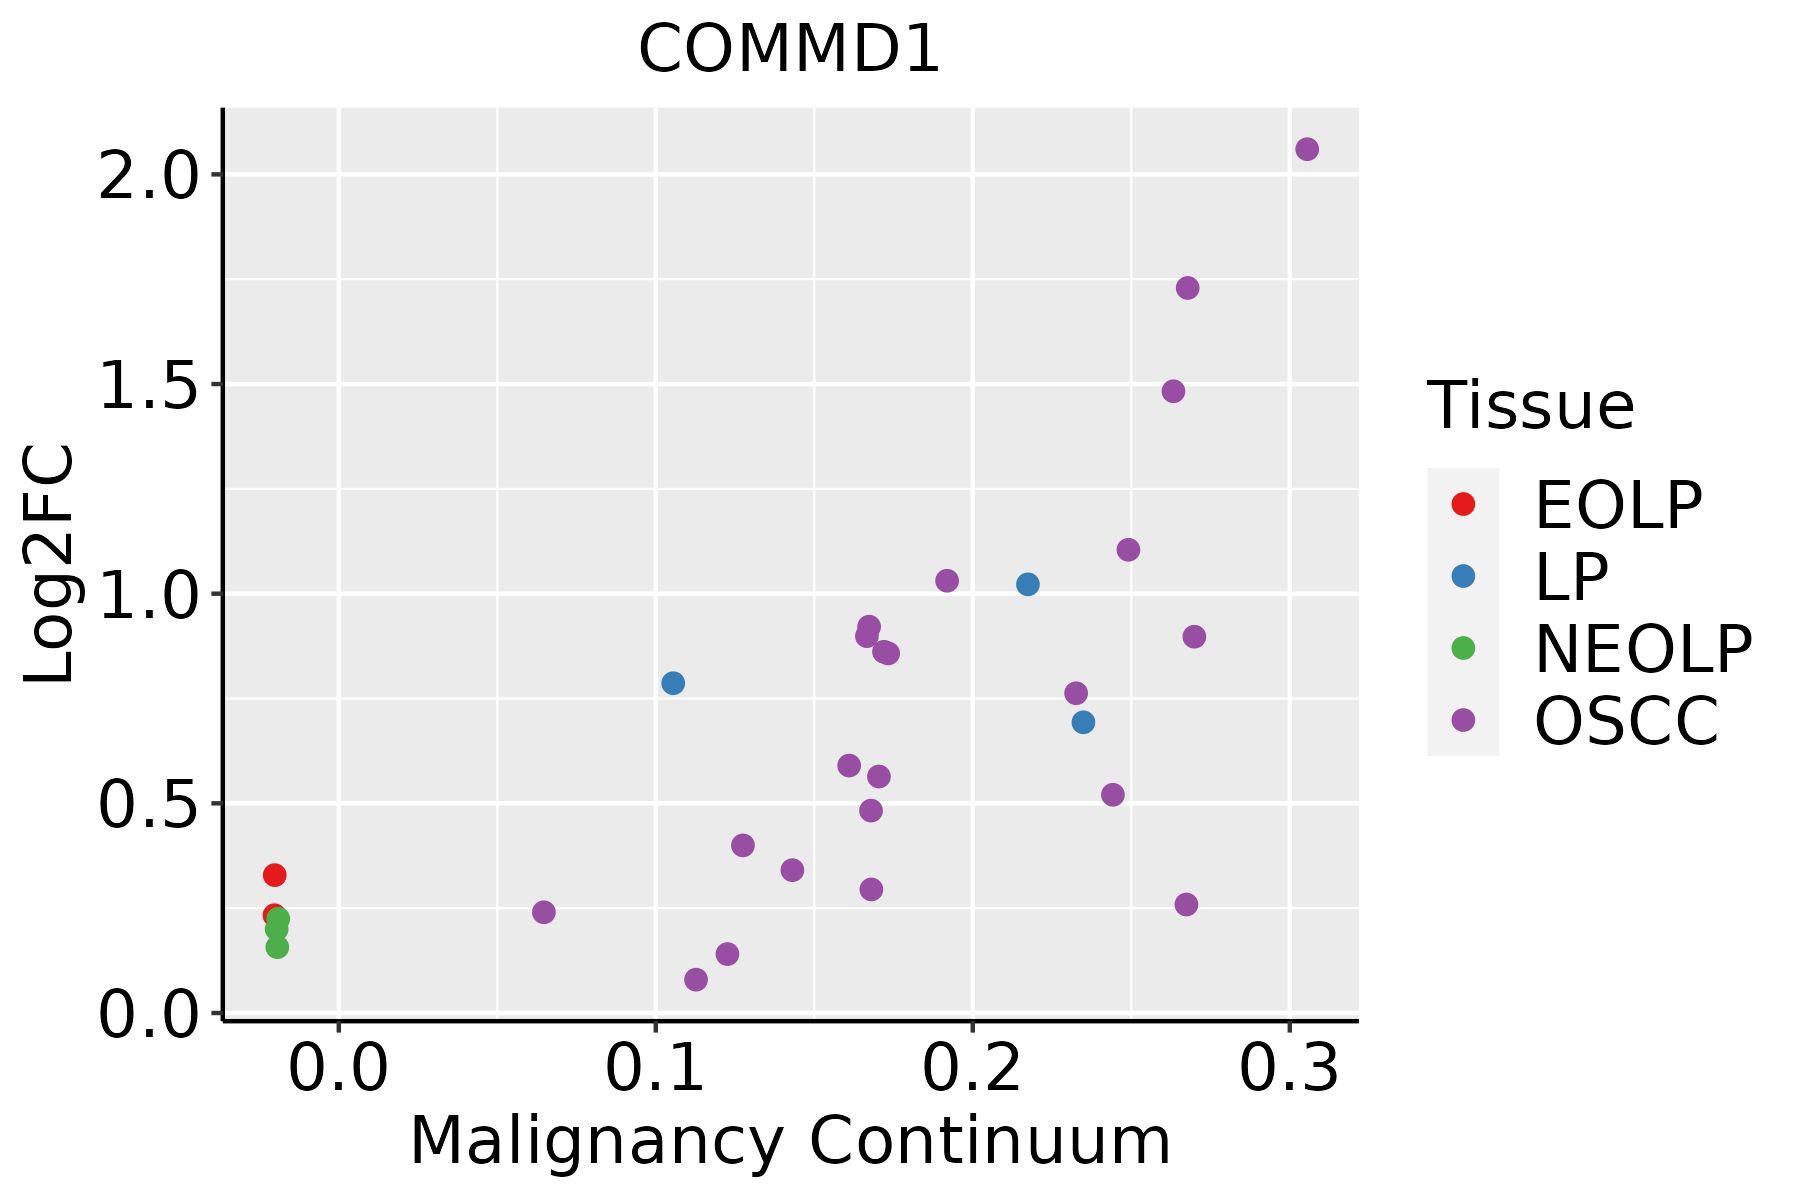 | EOLP: Erosive Oral lichen planus |
| LP: leukoplakia | ||
| NEOLP: Non-erosive oral lichen planus | ||
| OSCC: Oral squamous cell carcinoma | ||
| Skin | 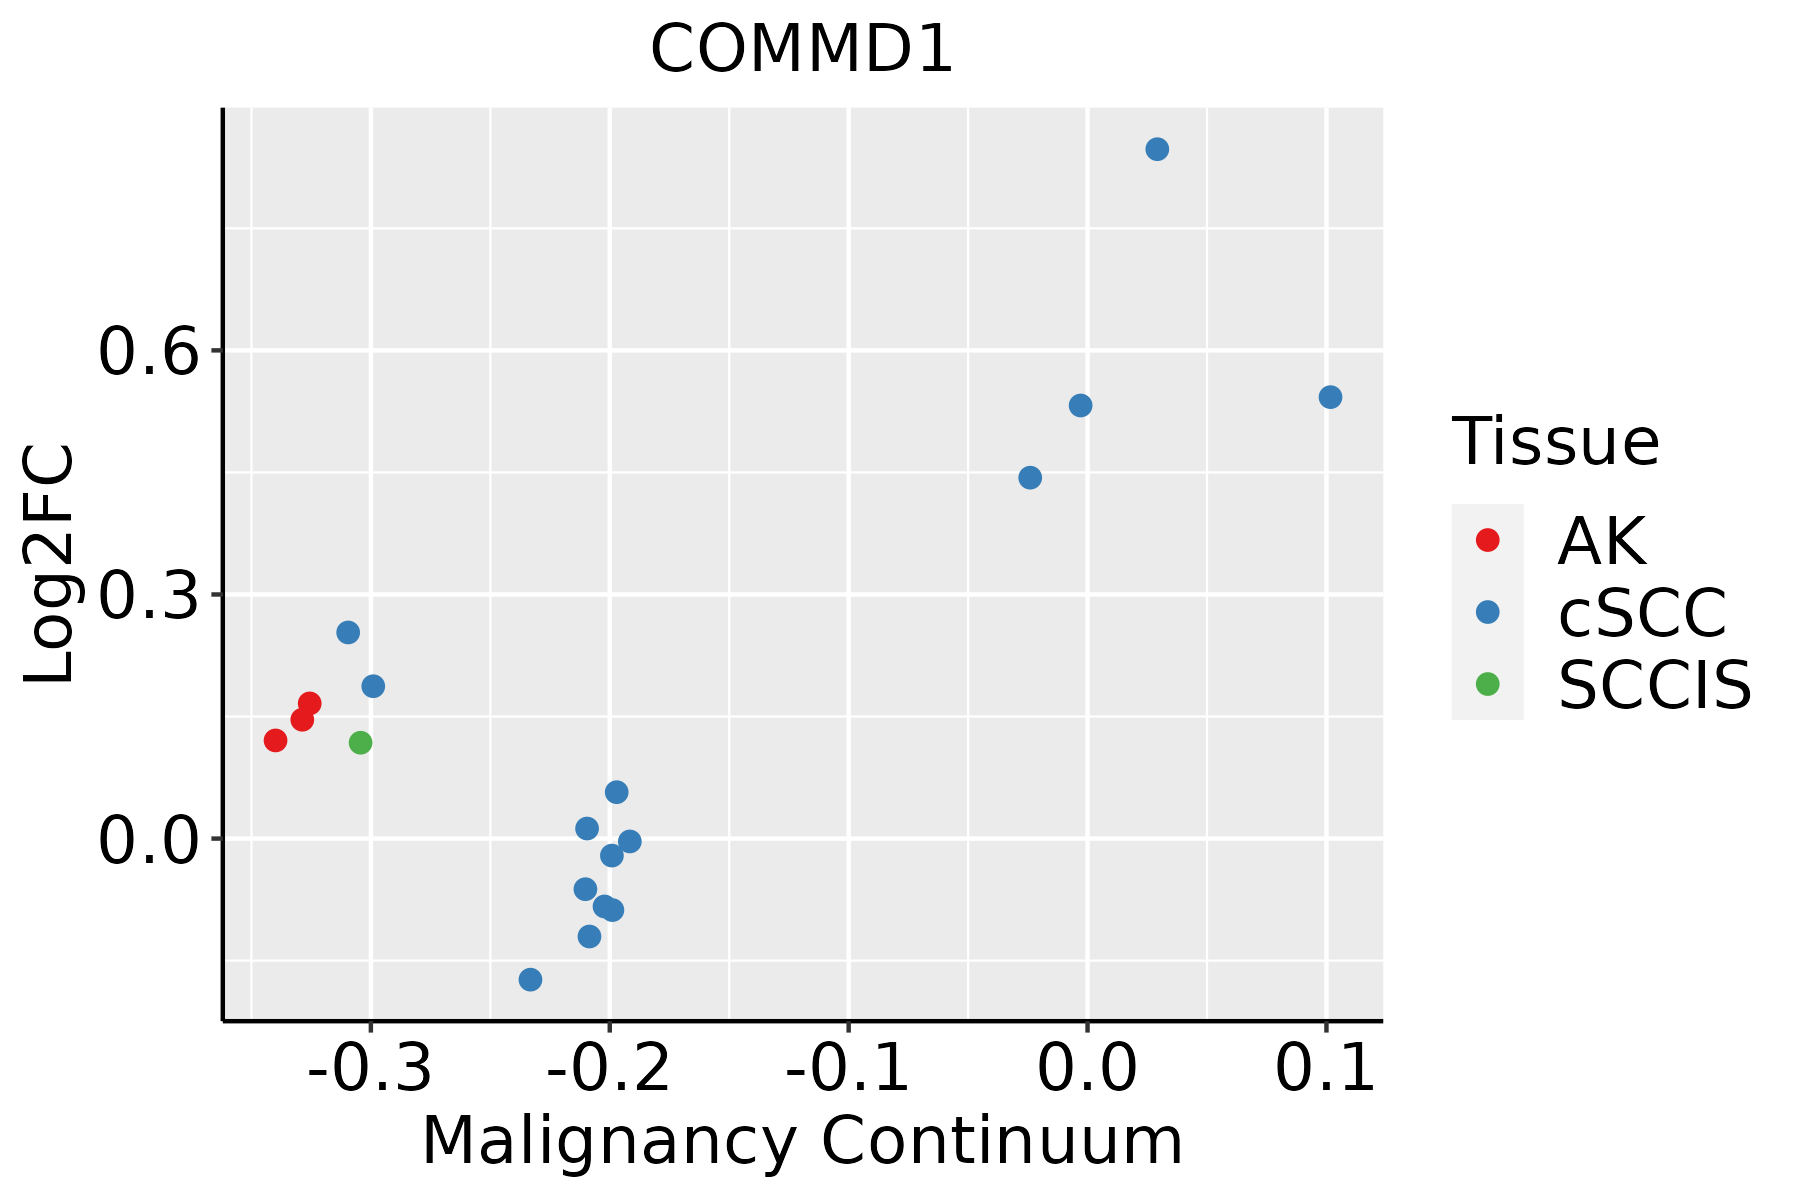 | AK: Actinic keratosis |
| cSCC: Cutaneous squamous cell carcinoma | ||
| SCCIS:squamous cell carcinoma in situ | ||
| Thyroid |  | ATC: Anaplastic thyroid cancer |
| HT: Hashimoto's thyroiditis | ||
| PTC: Papillary thyroid cancer |
| ∗log2FC in expression of this searched gene in stem-like cells from each diseased tissue sample relative to stem-like cells in normal samples in each tissue plotted against the malignancy continuum. Samples are colored based on if they are from different disease stage. |
Top |
Malignant transformation related pathway analysis |
| Find out the enriched GO biological processes and KEGG pathways involved in transition from healthy to precancer to cancer |
| Tissue | Disease Stage | Enriched GO biological Processes |
| Colorectum | AD |  |
| Colorectum | SER |  |
| Colorectum | MSS |  |
| Colorectum | MSI-H |  |
| Colorectum | FAP |  |
| ∗Top 15 enriched GO BP terms are showed in the bar plot of each disease state in each tissue. Each row represents a significant GO biological process which is colored according to the -log10(p.adjust). |
| Page: 1 2 3 4 5 6 7 8 9 |
| GO ID | Tissue | Disease Stage | Description | Gene Ratio | Bg Ratio | pvalue | p.adjust | Count |
| GO:19033221 | Liver | HCC | positive regulation of protein modification by small protein conjugation or removal | 94/7958 | 138/18723 | 9.87e-10 | 3.01e-08 | 94 |
| GO:009887621 | Liver | HCC | vesicle-mediated transport to the plasma membrane | 92/7958 | 136/18723 | 2.57e-09 | 7.07e-08 | 92 |
| GO:00313981 | Liver | HCC | positive regulation of protein ubiquitination | 79/7958 | 119/18723 | 1.18e-07 | 2.26e-06 | 79 |
| GO:000689321 | Liver | HCC | Golgi to plasma membrane transport | 44/7958 | 60/18723 | 1.24e-06 | 1.81e-05 | 44 |
| GO:190382811 | Liver | HCC | negative regulation of cellular protein localization | 71/7958 | 117/18723 | 5.44e-05 | 5.12e-04 | 71 |
| GO:005507612 | Liver | HCC | transition metal ion homeostasis | 81/7958 | 138/18723 | 8.87e-05 | 7.72e-04 | 81 |
| GO:00510902 | Liver | HCC | regulation of DNA-binding transcription factor activity | 220/7958 | 440/18723 | 8.04e-04 | 4.82e-03 | 220 |
| GO:0055070 | Liver | HCC | copper ion homeostasis | 14/7958 | 18/18723 | 2.57e-03 | 1.23e-02 | 14 |
| GO:00421768 | Lung | IAC | regulation of protein catabolic process | 97/2061 | 391/18723 | 6.32e-15 | 1.25e-11 | 97 |
| GO:19033208 | Lung | IAC | regulation of protein modification by small protein conjugation or removal | 64/2061 | 242/18723 | 1.38e-11 | 4.83e-09 | 64 |
| GO:19033628 | Lung | IAC | regulation of cellular protein catabolic process | 63/2061 | 255/18723 | 4.30e-10 | 9.45e-08 | 63 |
| GO:00313968 | Lung | IAC | regulation of protein ubiquitination | 53/2061 | 210/18723 | 4.65e-09 | 7.07e-07 | 53 |
| GO:19030508 | Lung | IAC | regulation of proteolysis involved in cellular protein catabolic process | 52/2061 | 221/18723 | 7.90e-08 | 7.95e-06 | 52 |
| GO:20000588 | Lung | IAC | regulation of ubiquitin-dependent protein catabolic process | 42/2061 | 164/18723 | 1.16e-07 | 1.07e-05 | 42 |
| GO:00104988 | Lung | IAC | proteasomal protein catabolic process | 90/2061 | 490/18723 | 6.69e-07 | 3.89e-05 | 90 |
| GO:00431618 | Lung | IAC | proteasome-mediated ubiquitin-dependent protein catabolic process | 78/2061 | 412/18723 | 1.10e-06 | 6.02e-05 | 78 |
| GO:00068926 | Lung | IAC | post-Golgi vesicle-mediated transport | 27/2061 | 104/18723 | 1.54e-05 | 4.49e-04 | 27 |
| GO:00611368 | Lung | IAC | regulation of proteasomal protein catabolic process | 40/2061 | 187/18723 | 2.71e-05 | 7.24e-04 | 40 |
| GO:19023058 | Lung | IAC | regulation of sodium ion transmembrane transport | 20/2061 | 68/18723 | 2.75e-05 | 7.26e-04 | 20 |
| GO:00510903 | Lung | IAC | regulation of DNA-binding transcription factor activity | 76/2061 | 440/18723 | 4.44e-05 | 1.05e-03 | 76 |
| Page: 1 2 3 4 5 6 7 8 9 10 11 12 13 14 15 16 17 |
| Pathway ID | Tissue | Disease Stage | Description | Gene Ratio | Bg Ratio | pvalue | p.adjust | qvalue | Count |
| Page: 1 |
Top |
Cell-cell communication analysis |
| Identification of potential cell-cell interactions between two cell types and their ligand-receptor pairs for different disease states |
| Ligand | Receptor | LRpair | Pathway | Tissue | Disease Stage |
| Page: 1 |
Top |
Single-cell gene regulatory network inference analysis |
| Find out the significant the regulons (TFs) and the target genes of each regulon across cell types for different disease states |
| TF | Cell Type | Tissue | Disease Stage | Target Gene | RSS | Regulon Activity |
| ∗The dot plots of a searched regulon are shown for all cell subpopulations in each disease state of each tissue based on the regulon specific score inferred using pySCENIC and by calculating the average expression. |
| Page: 1 |
Top |
Somatic mutation of malignant transformation related genes |
| Annotation of somatic variants for genes involved in malignant transformation |
| Hugo Symbol | Variant Class | Variant Classification | dbSNP RS | HGVSc | HGVSp | HGVSp Short | SWISSPROT | BIOTYPE | SIFT | PolyPhen | Tumor Sample Barcode | Tissue | Histology | Sex | Age | Stage | Therapy Types | Drugs | Outcome |
| COMMD1 | SNV | Missense_Mutation | c.409N>G | p.Gln137Glu | p.Q137E | Q8N668 | protein_coding | deleterious(0.02) | benign(0.009) | TCGA-AC-A23H-01 | Breast | breast invasive carcinoma | Female | >=65 | I/II | Unknown | Unknown | PD | |
| COMMD1 | SNV | Missense_Mutation | novel | c.443A>G | p.Glu148Gly | p.E148G | Q8N668 | protein_coding | deleterious(0) | probably_damaging(0.965) | TCGA-2W-A8YY-01 | Cervix | cervical & endocervical cancer | Female | <65 | I/II | Chemotherapy | cisplatin | CR |
| COMMD1 | SNV | Missense_Mutation | rs779213025 | c.340N>T | p.Arg114Cys | p.R114C | Q8N668 | protein_coding | tolerated(0.14) | benign(0.041) | TCGA-AP-A0LM-01 | Endometrium | uterine corpus endometrioid carcinoma | Female | <65 | III/IV | Chemotherapy | cisplatin | SD |
| COMMD1 | SNV | Missense_Mutation | novel | c.157N>A | p.Ala53Thr | p.A53T | Q8N668 | protein_coding | tolerated(0.43) | benign(0.187) | TCGA-EY-A1GU-01 | Endometrium | uterine corpus endometrioid carcinoma | Female | >=65 | I/II | Unknown | Unknown | SD |
| COMMD1 | SNV | Missense_Mutation | novel | c.88A>G | p.Ile30Val | p.I30V | Q8N668 | protein_coding | tolerated(0.25) | benign(0.006) | TCGA-86-A4D0-01 | Lung | lung adenocarcinoma | Male | <65 | I/II | Chemotherapy | etoposide | CR |
| COMMD1 | SNV | Missense_Mutation | novel | c.353G>C | p.Gly118Ala | p.G118A | Q8N668 | protein_coding | tolerated(0.8) | benign(0.02) | TCGA-99-7458-01 | Lung | lung adenocarcinoma | Female | >=65 | III/IV | Targeted Molecular therapy | tarceva | SD |
| COMMD1 | SNV | Missense_Mutation | novel | c.508N>A | p.Gln170Lys | p.Q170K | Q8N668 | protein_coding | tolerated(0.14) | benign(0.294) | TCGA-63-A5MW-01 | Lung | lung squamous cell carcinoma | Male | >=65 | I/II | Unknown | Unknown | SD |
| COMMD1 | SNV | Missense_Mutation | c.433N>G | p.Ile145Val | p.I145V | Q8N668 | protein_coding | tolerated(1) | benign(0) | TCGA-66-2771-01 | Lung | lung squamous cell carcinoma | Male | <65 | I/II | Chemotherapy | carboplatin | CR | |
| COMMD1 | SNV | Missense_Mutation | c.425N>C | p.Val142Ala | p.V142A | Q8N668 | protein_coding | tolerated(0.07) | benign(0.318) | TCGA-CG-5721-01 | Stomach | stomach adenocarcinoma | Male | <65 | III/IV | Unknown | Unknown | SD | |
| COMMD1 | insertion | Nonsense_Mutation | novel | c.260_261insTTGAGGTT | p.Ser88Ter | p.S88* | Q8N668 | protein_coding | TCGA-FY-A4B0-01 | Thyroid | thyroid carcinoma | Male | >=65 | I/II | Hormone Therapy | synthroid | SD |
| Page: 1 |
Top |
Related drugs of malignant transformation related genes |
| Identification of chemicals and drugs interact with genes involved in malignant transfromation |
| (DGIdb 4.0) |
| Entrez ID | Symbol | Category | Interaction Types | Drug Claim Name | Drug Name | PMIDs |
| Page: 1 |

Copyright 2023-Present -The University of Texas Health Science Center at Houston |