
|
|||||
|
 | |
| |
| |
| |
| |
| |
|
Gene: COA4 |
Gene summary for COA4 |
| Gene information | Species | Human | Gene symbol | COA4 | Gene ID | 51287 |
| Gene name | cytochrome c oxidase assembly factor 4 homolog | |
| Gene Alias | CHCHD8 | |
| Cytomap | 11q13.4 | |
| Gene Type | protein-coding | GO ID | GO:0006996 | UniProtAcc | A0A024R5J6 |
Top |
Malignant transformation analysis |
| Identification of the aberrant gene expression in precancerous and cancerous lesions by comparing the gene expression of stem-like cells in diseased tissues with normal stem cells |
| Entrez ID | Symbol | Replicates | Species | Organ | Tissue | Adj P-value | Log2FC | Malignancy |
| 51287 | COA4 | GSM4909281 | Human | Breast | IDC | 2.20e-03 | 2.85e-01 | 0.21 |
| 51287 | COA4 | GSM4909282 | Human | Breast | IDC | 1.63e-05 | 3.70e-01 | -0.0288 |
| 51287 | COA4 | GSM4909286 | Human | Breast | IDC | 9.16e-05 | 2.86e-01 | 0.1081 |
| 51287 | COA4 | GSM4909290 | Human | Breast | IDC | 1.70e-18 | 6.19e-01 | 0.2096 |
| 51287 | COA4 | GSM4909296 | Human | Breast | IDC | 7.33e-05 | 6.73e-02 | 0.1524 |
| 51287 | COA4 | GSM4909297 | Human | Breast | IDC | 2.89e-07 | -1.28e-01 | 0.1517 |
| 51287 | COA4 | GSM4909307 | Human | Breast | IDC | 9.59e-06 | 3.50e-01 | 0.1569 |
| 51287 | COA4 | GSM4909308 | Human | Breast | IDC | 1.71e-08 | 3.58e-01 | 0.158 |
| 51287 | COA4 | GSM4909311 | Human | Breast | IDC | 3.08e-15 | -1.59e-01 | 0.1534 |
| 51287 | COA4 | GSM4909312 | Human | Breast | IDC | 5.60e-03 | 5.84e-02 | 0.1552 |
| 51287 | COA4 | GSM4909319 | Human | Breast | IDC | 1.21e-23 | -6.02e-02 | 0.1563 |
| 51287 | COA4 | GSM4909320 | Human | Breast | IDC | 1.69e-07 | 3.70e-01 | 0.1575 |
| 51287 | COA4 | GSM4909321 | Human | Breast | IDC | 6.44e-10 | 1.44e-01 | 0.1559 |
| 51287 | COA4 | brca1 | Human | Breast | Precancer | 6.06e-04 | 3.16e-01 | -0.0338 |
| 51287 | COA4 | brca2 | Human | Breast | Precancer | 8.63e-03 | 2.11e-01 | -0.024 |
| 51287 | COA4 | M2 | Human | Breast | IDC | 2.47e-02 | 3.14e-01 | 0.21 |
| 51287 | COA4 | NCCBC14 | Human | Breast | DCIS | 1.13e-05 | 2.39e-01 | 0.2021 |
| 51287 | COA4 | NCCBC2 | Human | Breast | DCIS | 3.11e-04 | 1.65e-01 | 0.1554 |
| 51287 | COA4 | P1 | Human | Breast | IDC | 5.79e-07 | -1.36e-02 | 0.1527 |
| 51287 | COA4 | P3 | Human | Breast | IDC | 4.95e-04 | 5.77e-01 | 0.1542 |
| Page: 1 2 3 4 5 6 7 8 9 |
| Tissue | Expression Dynamics | Abbreviation |
| Breast | 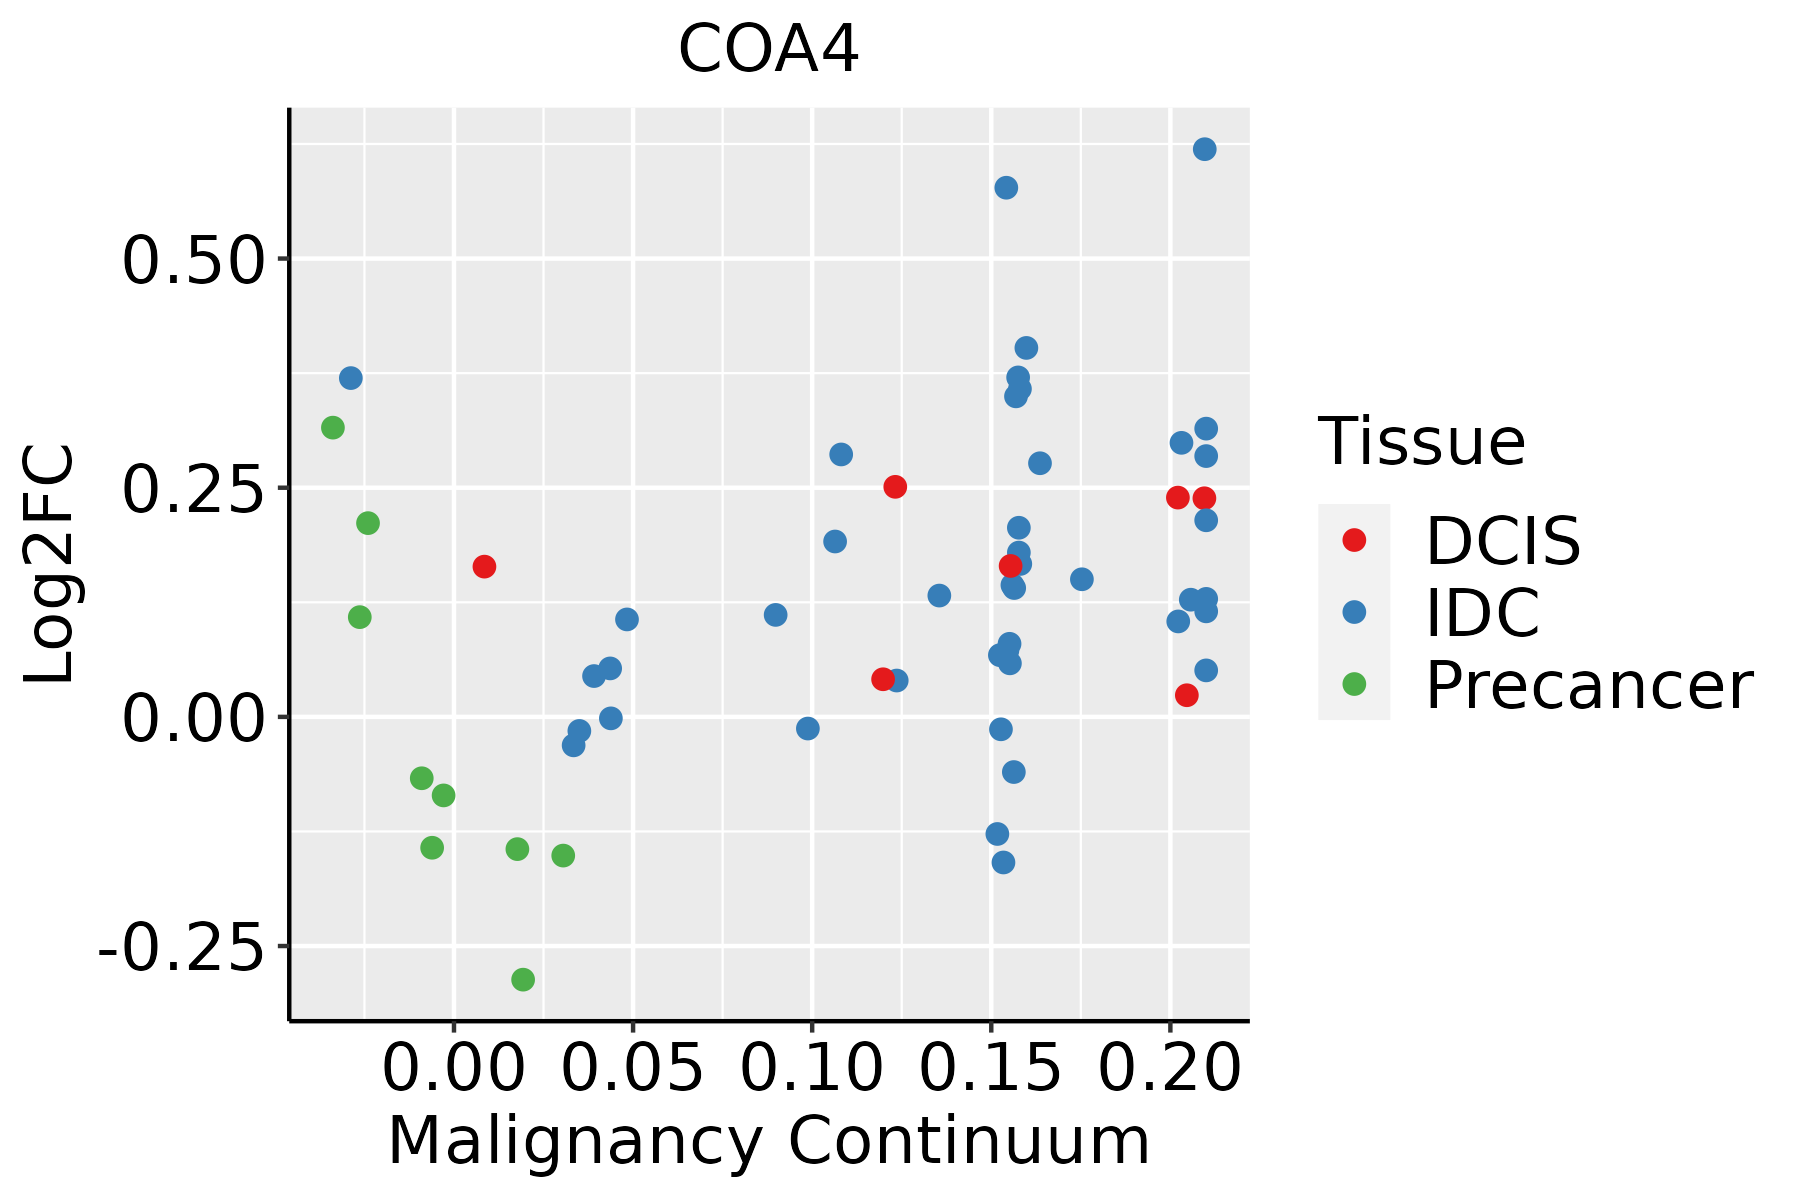 | IDC: Invasive ductal carcinoma |
| DCIS: Ductal carcinoma in situ | ||
| Precancer(BRCA1-mut): Precancerous lesion from BRCA1 mutation carriers | ||
| Colorectum (GSE201348) |  | FAP: Familial adenomatous polyposis |
| CRC: Colorectal cancer | ||
| Colorectum (HTA11) |  | AD: Adenomas |
| SER: Sessile serrated lesions | ||
| MSI-H: Microsatellite-high colorectal cancer | ||
| MSS: Microsatellite stable colorectal cancer | ||
| Esophagus | 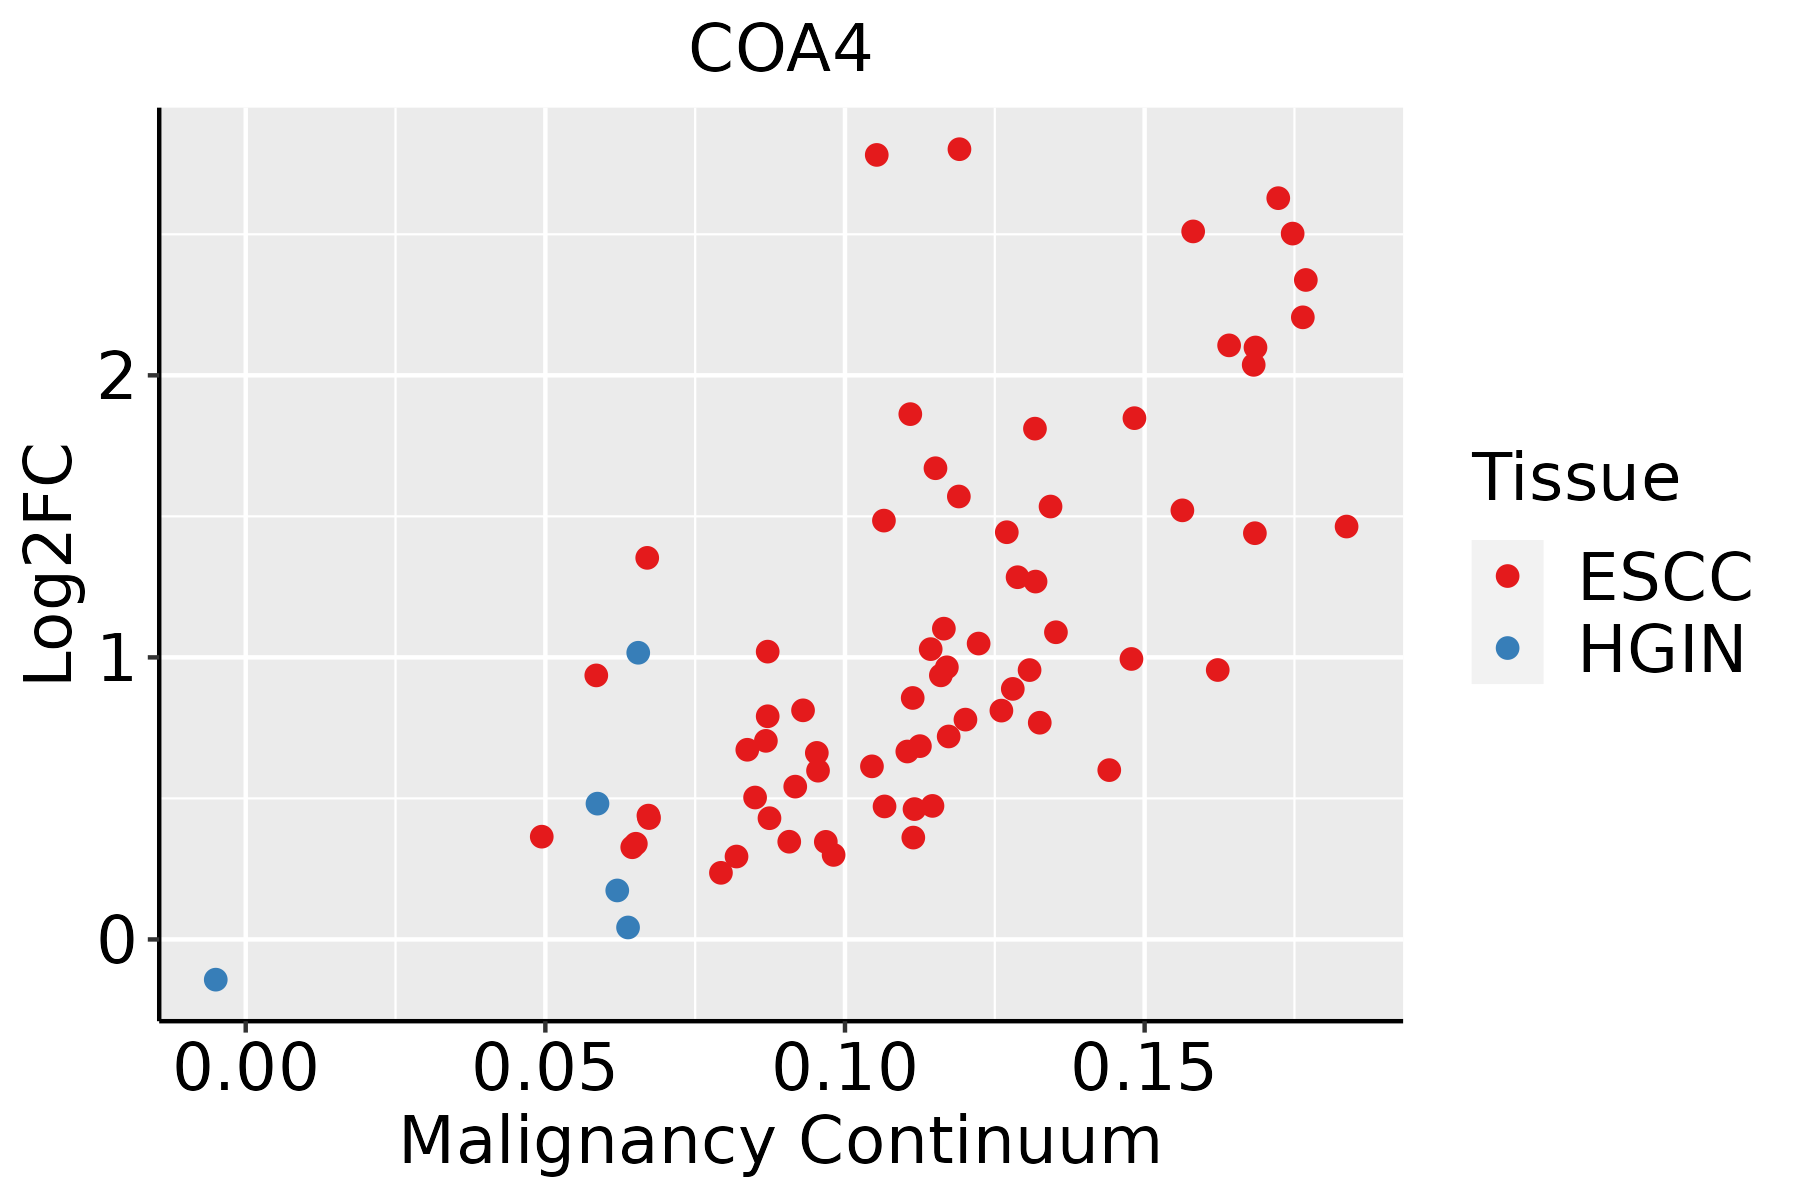 | ESCC: Esophageal squamous cell carcinoma |
| HGIN: High-grade intraepithelial neoplasias | ||
| LGIN: Low-grade intraepithelial neoplasias | ||
| Liver | 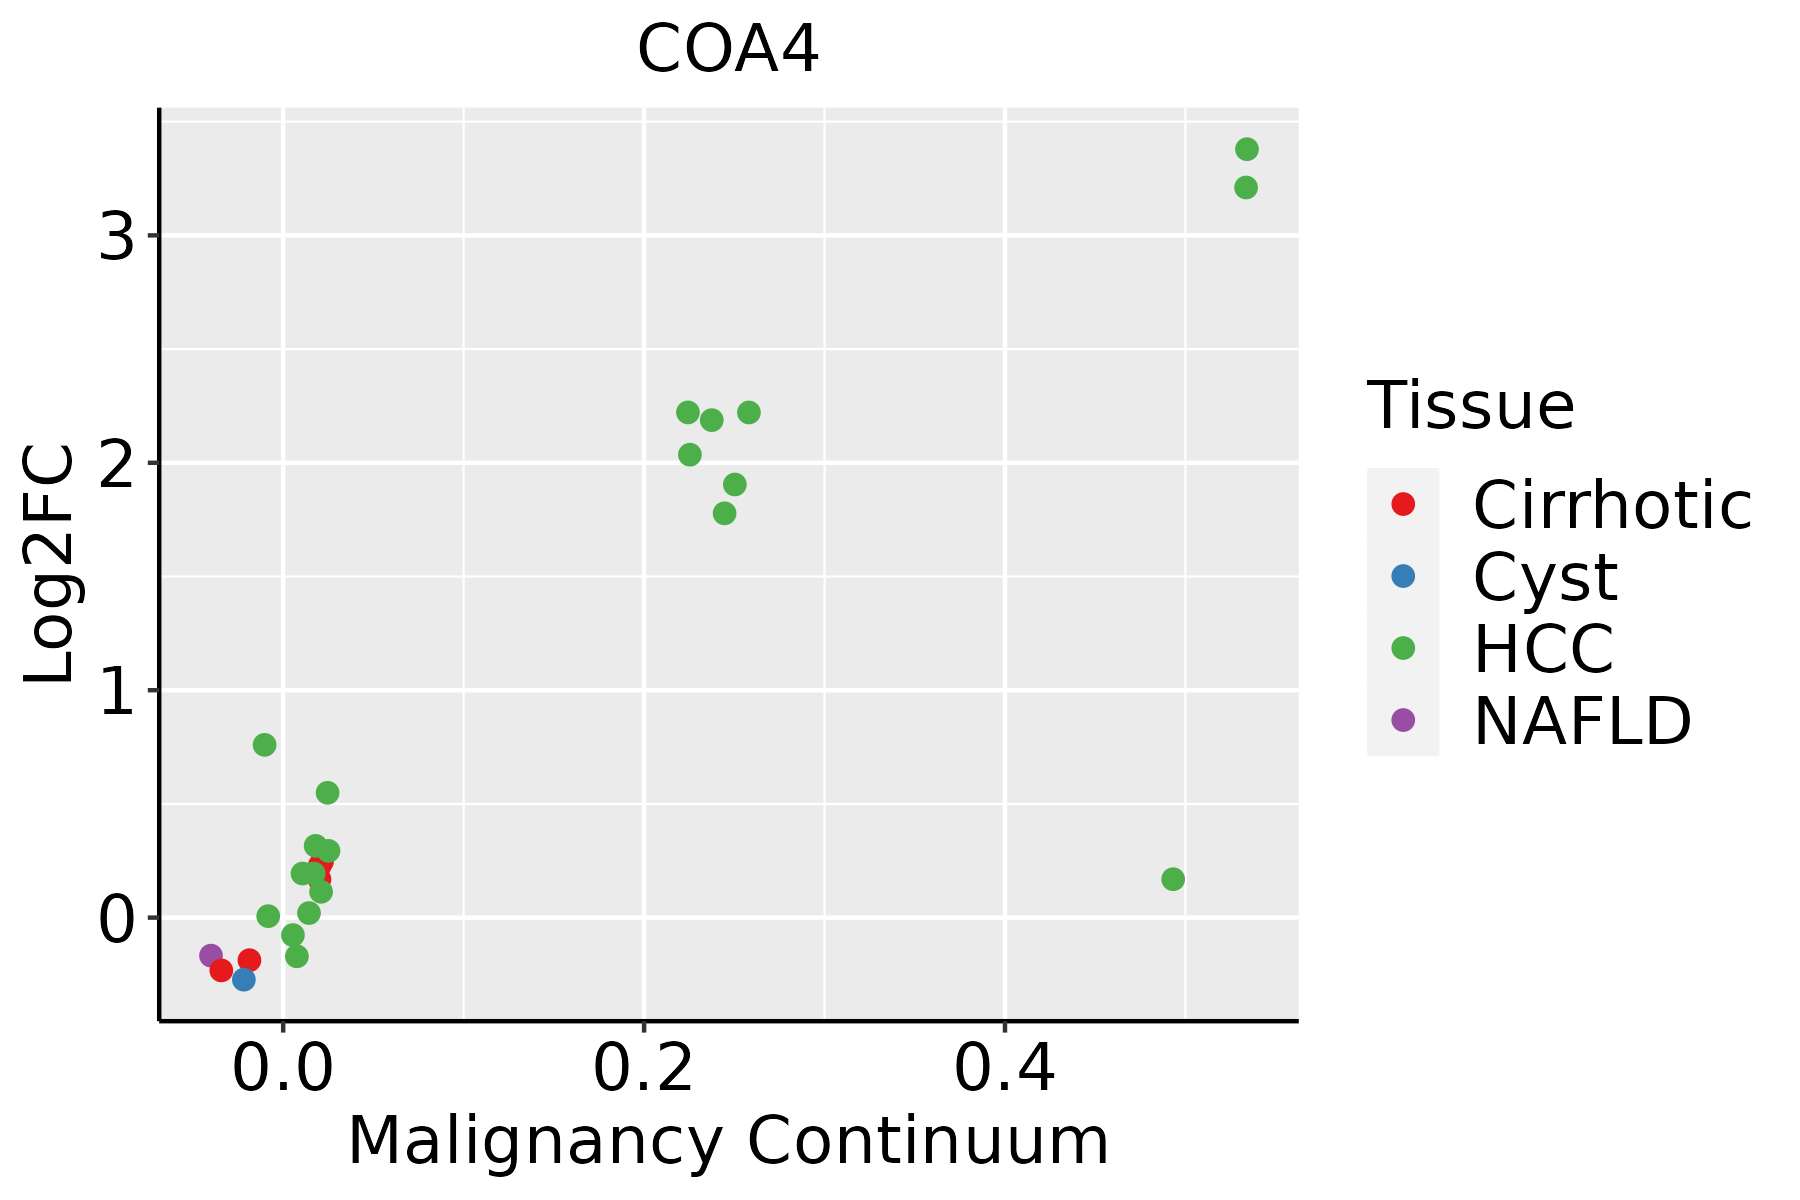 | HCC: Hepatocellular carcinoma |
| NAFLD: Non-alcoholic fatty liver disease | ||
| Oral Cavity | 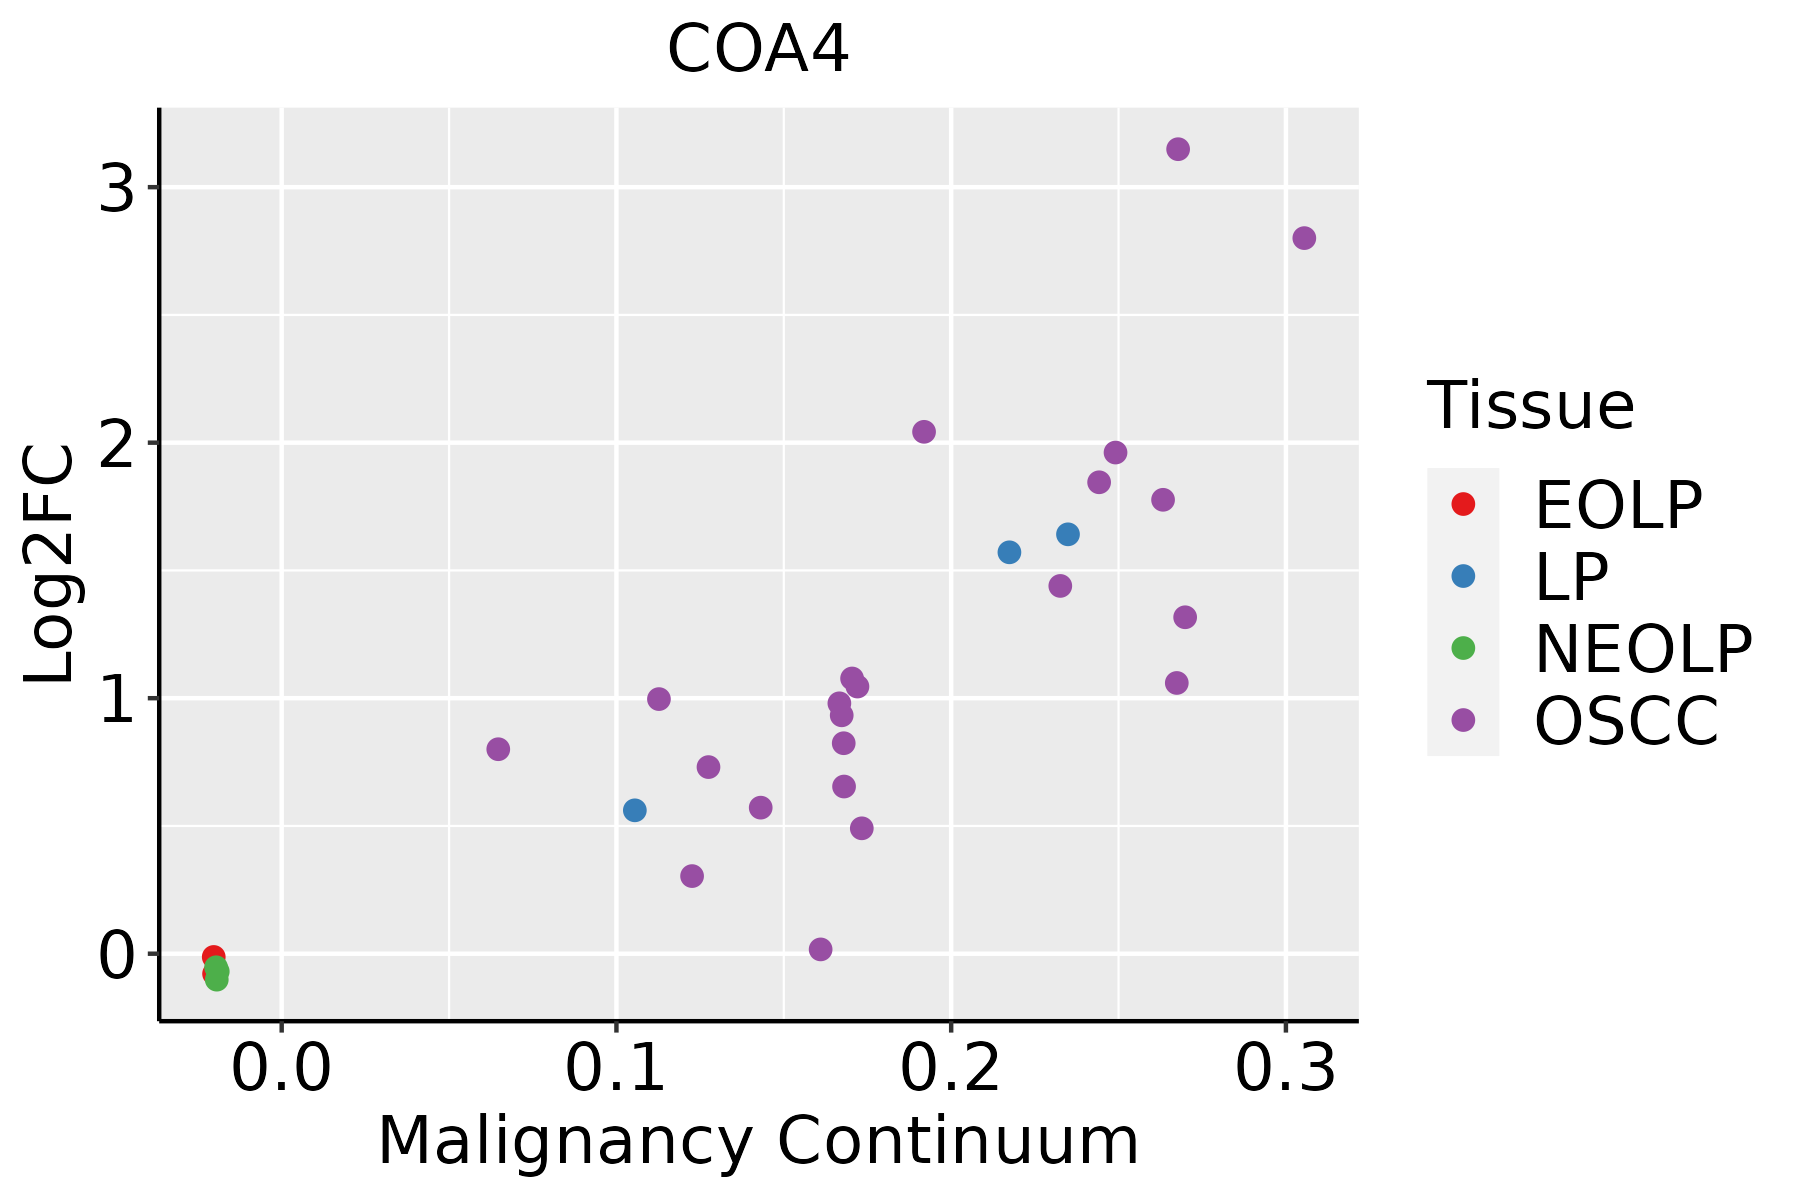 | EOLP: Erosive Oral lichen planus |
| LP: leukoplakia | ||
| NEOLP: Non-erosive oral lichen planus | ||
| OSCC: Oral squamous cell carcinoma | ||
| Prostate | 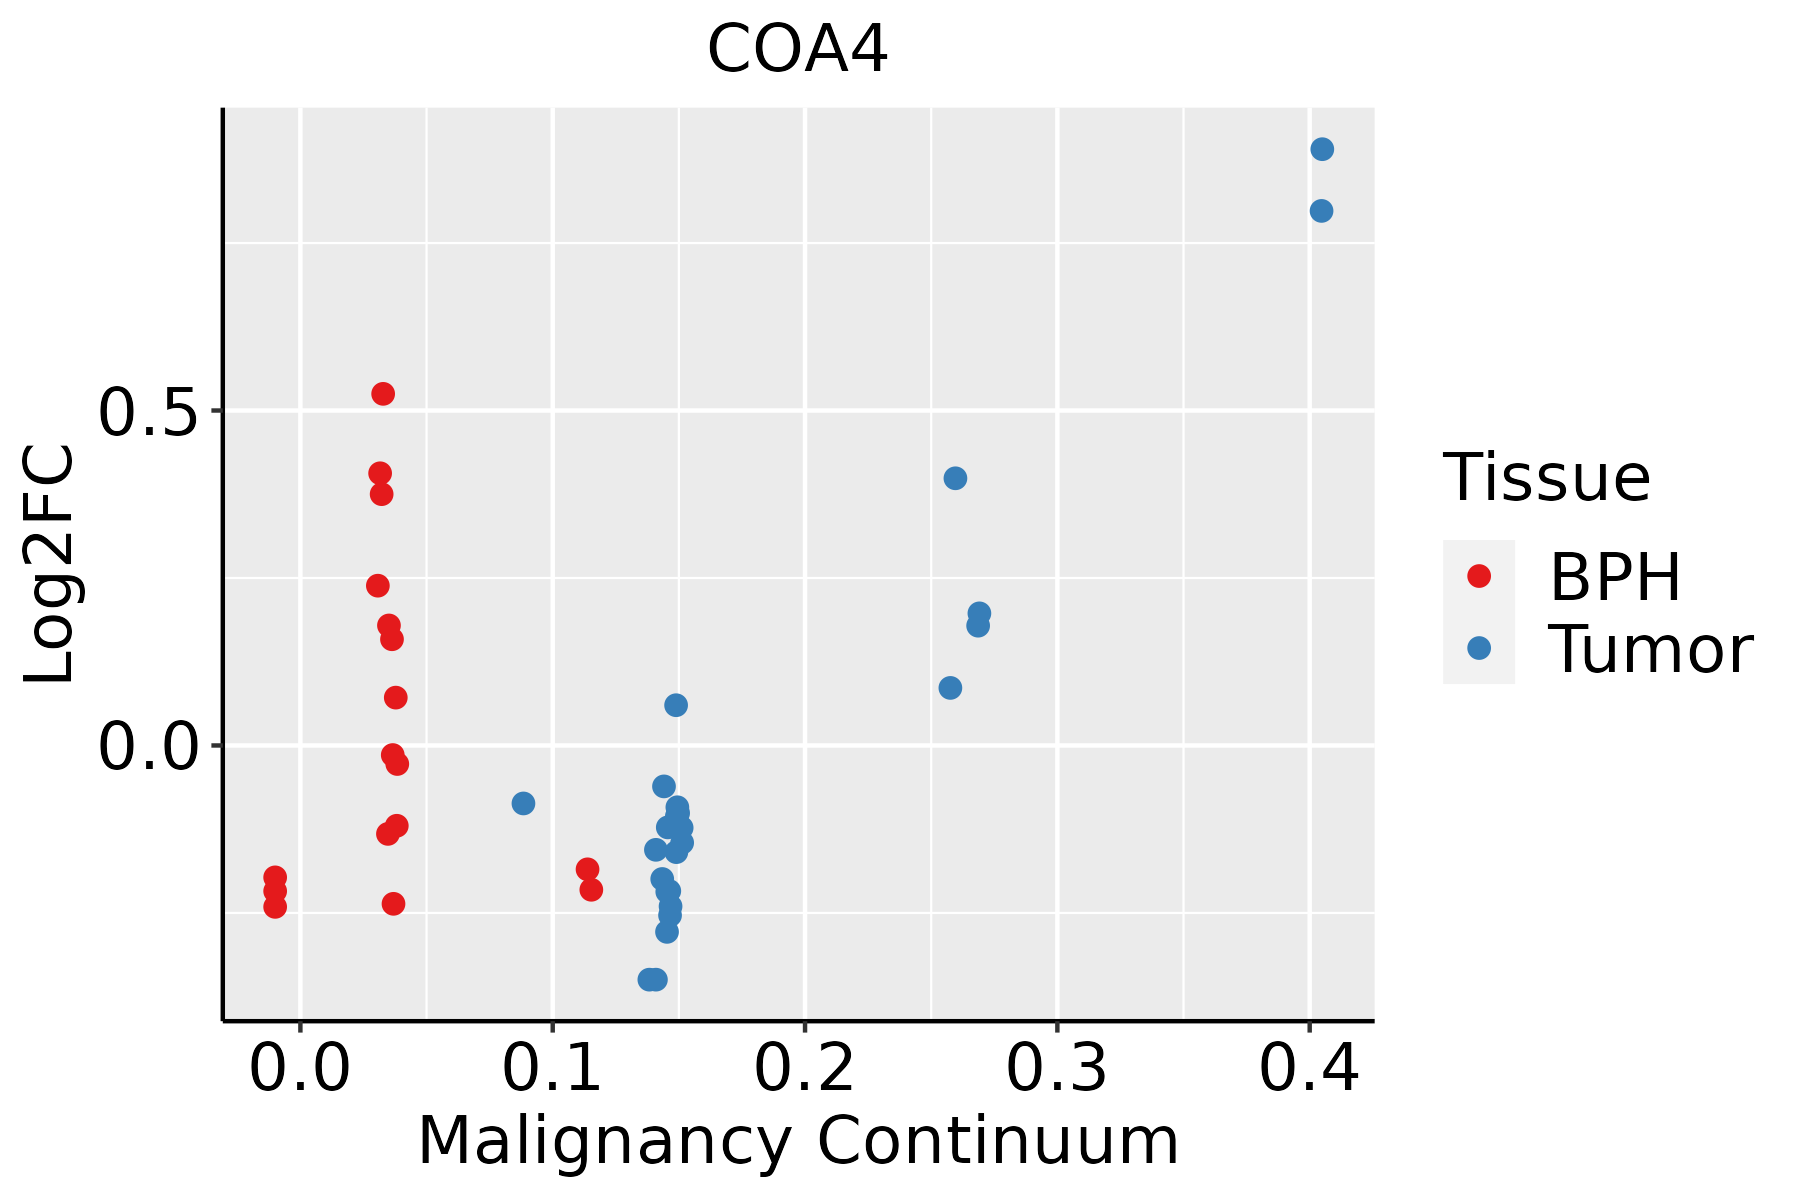 | BPH: Benign Prostatic Hyperplasia |
| Skin |  | AK: Actinic keratosis |
| cSCC: Cutaneous squamous cell carcinoma | ||
| SCCIS:squamous cell carcinoma in situ | ||
| Thyroid |  | ATC: Anaplastic thyroid cancer |
| HT: Hashimoto's thyroiditis | ||
| PTC: Papillary thyroid cancer |
| ∗log2FC in expression of this searched gene in stem-like cells from each diseased tissue sample relative to stem-like cells in normal samples in each tissue plotted against the malignancy continuum. Samples are colored based on if they are from different disease stage. |
Top |
Malignant transformation related pathway analysis |
| Find out the enriched GO biological processes and KEGG pathways involved in transition from healthy to precancer to cancer |
| Tissue | Disease Stage | Enriched GO biological Processes |
| Colorectum | AD |  |
| Colorectum | SER |  |
| Colorectum | MSS |  |
| Colorectum | MSI-H |  |
| Colorectum | FAP |  |
| ∗Top 15 enriched GO BP terms are showed in the bar plot of each disease state in each tissue. Each row represents a significant GO biological process which is colored according to the -log10(p.adjust). |
| Page: 1 2 3 4 5 6 7 8 9 |
| GO ID | Tissue | Disease Stage | Description | Gene Ratio | Bg Ratio | pvalue | p.adjust | Count |
| GO:00434017 | Lung | IAC | steroid hormone mediated signaling pathway | 31/2061 | 136/18723 | 6.00e-05 | 1.31e-03 | 31 |
| GO:19016548 | Lung | IAC | response to ketone | 39/2061 | 194/18723 | 1.40e-04 | 2.60e-03 | 39 |
| GO:00066234 | Lung | IAC | protein targeting to vacuole | 12/2061 | 37/18723 | 4.06e-04 | 6.14e-03 | 12 |
| GO:00097557 | Lung | IAC | hormone-mediated signaling pathway | 36/2061 | 190/18723 | 7.95e-04 | 1.02e-02 | 36 |
| GO:00070346 | Lung | IAC | vacuolar transport | 31/2061 | 157/18723 | 8.82e-04 | 1.11e-02 | 31 |
| GO:00070415 | Lung | IAC | lysosomal transport | 24/2061 | 114/18723 | 1.30e-03 | 1.45e-02 | 24 |
| GO:00066058 | Lung | IAC | protein targeting | 51/2061 | 314/18723 | 2.91e-03 | 2.61e-02 | 51 |
| GO:19016553 | Lung | IAC | cellular response to ketone | 20/2061 | 96/18723 | 3.58e-03 | 3.00e-02 | 20 |
| GO:00335744 | Lung | IAC | response to testosterone | 11/2061 | 42/18723 | 4.72e-03 | 3.68e-02 | 11 |
| GO:00305204 | Lung | IAC | intracellular estrogen receptor signaling pathway | 13/2061 | 54/18723 | 4.89e-03 | 3.78e-02 | 13 |
| GO:00726664 | Lung | IAC | establishment of protein localization to vacuole | 12/2061 | 49/18723 | 5.82e-03 | 4.23e-02 | 12 |
| GO:003052213 | Lung | AIS | intracellular receptor signaling pathway | 53/1849 | 265/18723 | 4.57e-07 | 3.55e-05 | 53 |
| GO:003051812 | Lung | AIS | intracellular steroid hormone receptor signaling pathway | 28/1849 | 116/18723 | 6.14e-06 | 2.82e-04 | 28 |
| GO:007138313 | Lung | AIS | cellular response to steroid hormone stimulus | 41/1849 | 204/18723 | 7.76e-06 | 3.35e-04 | 41 |
| GO:004854513 | Lung | AIS | response to steroid hormone | 59/1849 | 339/18723 | 1.15e-05 | 4.65e-04 | 59 |
| GO:006145812 | Lung | AIS | reproductive system development | 70/1849 | 427/18723 | 1.52e-05 | 5.50e-04 | 70 |
| GO:004860811 | Lung | AIS | reproductive structure development | 69/1849 | 424/18723 | 2.23e-05 | 7.42e-04 | 69 |
| GO:004340112 | Lung | AIS | steroid hormone mediated signaling pathway | 28/1849 | 136/18723 | 1.32e-04 | 2.97e-03 | 28 |
| GO:000662312 | Lung | AIS | protein targeting to vacuole | 12/1849 | 37/18723 | 1.46e-04 | 3.15e-03 | 12 |
| GO:000703412 | Lung | AIS | vacuolar transport | 30/1849 | 157/18723 | 3.09e-04 | 5.63e-03 | 30 |
| Page: 1 2 3 4 5 6 7 8 9 10 11 12 13 14 15 16 17 18 19 20 |
| Pathway ID | Tissue | Disease Stage | Description | Gene Ratio | Bg Ratio | pvalue | p.adjust | qvalue | Count |
| hsa0471418 | Breast | Precancer | Thermogenesis | 68/684 | 232/8465 | 4.40e-22 | 1.26e-20 | 9.69e-21 | 68 |
| hsa0471419 | Breast | Precancer | Thermogenesis | 68/684 | 232/8465 | 4.40e-22 | 1.26e-20 | 9.69e-21 | 68 |
| hsa0471424 | Breast | IDC | Thermogenesis | 75/867 | 232/8465 | 8.41e-21 | 3.04e-19 | 2.27e-19 | 75 |
| hsa0471434 | Breast | IDC | Thermogenesis | 75/867 | 232/8465 | 8.41e-21 | 3.04e-19 | 2.27e-19 | 75 |
| hsa0471443 | Breast | DCIS | Thermogenesis | 74/846 | 232/8465 | 8.72e-21 | 3.13e-19 | 2.30e-19 | 74 |
| hsa0471453 | Breast | DCIS | Thermogenesis | 74/846 | 232/8465 | 8.72e-21 | 3.13e-19 | 2.30e-19 | 74 |
| hsa04714 | Colorectum | AD | Thermogenesis | 120/2092 | 232/8465 | 2.76e-19 | 1.16e-17 | 7.37e-18 | 120 |
| hsa047141 | Colorectum | AD | Thermogenesis | 120/2092 | 232/8465 | 2.76e-19 | 1.16e-17 | 7.37e-18 | 120 |
| hsa047142 | Colorectum | SER | Thermogenesis | 106/1580 | 232/8465 | 1.15e-21 | 6.34e-20 | 4.61e-20 | 106 |
| hsa047143 | Colorectum | SER | Thermogenesis | 106/1580 | 232/8465 | 1.15e-21 | 6.34e-20 | 4.61e-20 | 106 |
| hsa047144 | Colorectum | MSS | Thermogenesis | 113/1875 | 232/8465 | 1.52e-19 | 4.62e-18 | 2.83e-18 | 113 |
| hsa047145 | Colorectum | MSS | Thermogenesis | 113/1875 | 232/8465 | 1.52e-19 | 4.62e-18 | 2.83e-18 | 113 |
| hsa0471439 | Esophagus | HGIN | Thermogenesis | 91/1383 | 232/8465 | 1.97e-17 | 5.36e-16 | 4.25e-16 | 91 |
| hsa04714114 | Esophagus | HGIN | Thermogenesis | 91/1383 | 232/8465 | 1.97e-17 | 5.36e-16 | 4.25e-16 | 91 |
| hsa04714211 | Esophagus | ESCC | Thermogenesis | 163/4205 | 232/8465 | 9.22e-11 | 1.14e-09 | 5.86e-10 | 163 |
| hsa04714310 | Esophagus | ESCC | Thermogenesis | 163/4205 | 232/8465 | 9.22e-11 | 1.14e-09 | 5.86e-10 | 163 |
| hsa0471414 | Liver | Cirrhotic | Thermogenesis | 121/2530 | 232/8465 | 5.70e-13 | 1.36e-11 | 8.36e-12 | 121 |
| hsa0471415 | Liver | Cirrhotic | Thermogenesis | 121/2530 | 232/8465 | 5.70e-13 | 1.36e-11 | 8.36e-12 | 121 |
| hsa0471422 | Liver | HCC | Thermogenesis | 170/4020 | 232/8465 | 5.36e-16 | 2.25e-14 | 1.25e-14 | 170 |
| hsa0471432 | Liver | HCC | Thermogenesis | 170/4020 | 232/8465 | 5.36e-16 | 2.25e-14 | 1.25e-14 | 170 |
| Page: 1 2 |
Top |
Cell-cell communication analysis |
| Identification of potential cell-cell interactions between two cell types and their ligand-receptor pairs for different disease states |
| Ligand | Receptor | LRpair | Pathway | Tissue | Disease Stage |
| Page: 1 |
Top |
Single-cell gene regulatory network inference analysis |
| Find out the significant the regulons (TFs) and the target genes of each regulon across cell types for different disease states |
| TF | Cell Type | Tissue | Disease Stage | Target Gene | RSS | Regulon Activity |
| ∗The dot plots of a searched regulon are shown for all cell subpopulations in each disease state of each tissue based on the regulon specific score inferred using pySCENIC and by calculating the average expression. |
| Page: 1 |
Top |
Somatic mutation of malignant transformation related genes |
| Annotation of somatic variants for genes involved in malignant transformation |
| Hugo Symbol | Variant Class | Variant Classification | dbSNP RS | HGVSc | HGVSp | HGVSp Short | SWISSPROT | BIOTYPE | SIFT | PolyPhen | Tumor Sample Barcode | Tissue | Histology | Sex | Age | Stage | Therapy Types | Drugs | Outcome |
| COA4 | SNV | Missense_Mutation | c.223N>A | p.Glu75Lys | p.E75K | Q9NYJ1 | protein_coding | deleterious(0.01) | benign(0.111) | TCGA-AR-A0TX-01 | Breast | breast invasive carcinoma | Female | <65 | I/II | Unknown | Unknown | SD | |
| COA4 | SNV | Missense_Mutation | c.148N>A | p.Asp50Asn | p.D50N | Q9NYJ1 | protein_coding | deleterious(0) | probably_damaging(0.994) | TCGA-EK-A2R8-01 | Cervix | cervical & endocervical cancer | Female | <65 | I/II | Unknown | Unknown | SD | |
| COA4 | SNV | Missense_Mutation | rs146693705 | c.92G>A | p.Arg31His | p.R31H | Q9NYJ1 | protein_coding | tolerated(0.15) | benign(0.012) | TCGA-AZ-4315-01 | Colorectum | colon adenocarcinoma | Male | <65 | I/II | Unknown | Unknown | SD |
| COA4 | SNV | Missense_Mutation | rs143220644 | c.209N>T | p.Ala70Val | p.A70V | Q9NYJ1 | protein_coding | tolerated(0.27) | benign(0.003) | TCGA-A5-A0G2-01 | Endometrium | uterine corpus endometrioid carcinoma | Female | <65 | III/IV | Unknown | Unknown | SD |
| COA4 | SNV | Missense_Mutation | novel | c.185N>T | p.Lys62Met | p.K62M | Q9NYJ1 | protein_coding | deleterious(0) | possibly_damaging(0.807) | TCGA-EC-A1NJ-01 | Endometrium | uterine corpus endometrioid carcinoma | Female | >=65 | I/II | Unknown | Unknown | SD |
| COA4 | insertion | Frame_Shift_Ins | novel | c.105_106insAATTTTTGTATTTTTAGTAGAGAATG | p.Ala36AsnfsTer39 | p.A36Nfs*39 | Q9NYJ1 | protein_coding | TCGA-A5-A0G5-01 | Endometrium | uterine corpus endometrioid carcinoma | Female | >=65 | I/II | Unknown | Unknown | SD | ||
| COA4 | SNV | Missense_Mutation | novel | c.212G>T | p.Arg71Met | p.R71M | Q9NYJ1 | protein_coding | deleterious(0.01) | benign(0.254) | TCGA-73-A9RS-01 | Lung | lung adenocarcinoma | Male | <65 | I/II | Chemotherapy | carboplatin | PD |
| Page: 1 |
Top |
Related drugs of malignant transformation related genes |
| Identification of chemicals and drugs interact with genes involved in malignant transfromation |
| (DGIdb 4.0) |
| Entrez ID | Symbol | Category | Interaction Types | Drug Claim Name | Drug Name | PMIDs |
| Page: 1 |

Copyright 2023-Present -The University of Texas Health Science Center at Houston |