
|
|||||
|
 | |
| |
| |
| |
| |
| |
|
Gene: CNOT6 |
Gene summary for CNOT6 |
| Gene information | Species | Human | Gene symbol | CNOT6 | Gene ID | 57472 |
| Gene name | CCR4-NOT transcription complex subunit 6 | |
| Gene Alias | CCR4 | |
| Cytomap | 5q35.3 | |
| Gene Type | protein-coding | GO ID | GO:0000288 | UniProtAcc | NA |
Top |
Malignant transformation analysis |
| Identification of the aberrant gene expression in precancerous and cancerous lesions by comparing the gene expression of stem-like cells in diseased tissues with normal stem cells |
| Entrez ID | Symbol | Replicates | Species | Organ | Tissue | Adj P-value | Log2FC | Malignancy |
| 57472 | CNOT6 | LZE20T | Human | Esophagus | ESCC | 9.97e-03 | 4.64e-02 | 0.0662 |
| 57472 | CNOT6 | LZE24T | Human | Esophagus | ESCC | 2.48e-04 | 1.37e-01 | 0.0596 |
| 57472 | CNOT6 | P2T-E | Human | Esophagus | ESCC | 4.19e-08 | 1.61e-01 | 0.1177 |
| 57472 | CNOT6 | P4T-E | Human | Esophagus | ESCC | 8.04e-08 | 1.35e-01 | 0.1323 |
| 57472 | CNOT6 | P5T-E | Human | Esophagus | ESCC | 1.78e-03 | 5.87e-02 | 0.1327 |
| 57472 | CNOT6 | P8T-E | Human | Esophagus | ESCC | 1.34e-02 | 1.07e-01 | 0.0889 |
| 57472 | CNOT6 | P9T-E | Human | Esophagus | ESCC | 1.88e-05 | 2.56e-02 | 0.1131 |
| 57472 | CNOT6 | P10T-E | Human | Esophagus | ESCC | 1.29e-14 | 1.28e-01 | 0.116 |
| 57472 | CNOT6 | P11T-E | Human | Esophagus | ESCC | 2.96e-13 | 2.60e-01 | 0.1426 |
| 57472 | CNOT6 | P12T-E | Human | Esophagus | ESCC | 2.28e-11 | 1.31e-01 | 0.1122 |
| 57472 | CNOT6 | P15T-E | Human | Esophagus | ESCC | 7.61e-12 | 1.96e-01 | 0.1149 |
| 57472 | CNOT6 | P16T-E | Human | Esophagus | ESCC | 6.04e-11 | 7.76e-02 | 0.1153 |
| 57472 | CNOT6 | P20T-E | Human | Esophagus | ESCC | 4.90e-07 | 3.34e-02 | 0.1124 |
| 57472 | CNOT6 | P21T-E | Human | Esophagus | ESCC | 7.28e-14 | 1.34e-01 | 0.1617 |
| 57472 | CNOT6 | P22T-E | Human | Esophagus | ESCC | 1.89e-09 | 1.80e-01 | 0.1236 |
| 57472 | CNOT6 | P23T-E | Human | Esophagus | ESCC | 1.16e-18 | 1.38e-01 | 0.108 |
| 57472 | CNOT6 | P26T-E | Human | Esophagus | ESCC | 2.55e-07 | 5.80e-02 | 0.1276 |
| 57472 | CNOT6 | P27T-E | Human | Esophagus | ESCC | 7.39e-03 | 5.63e-02 | 0.1055 |
| 57472 | CNOT6 | P28T-E | Human | Esophagus | ESCC | 2.45e-11 | 1.91e-01 | 0.1149 |
| 57472 | CNOT6 | P30T-E | Human | Esophagus | ESCC | 1.07e-07 | 3.06e-01 | 0.137 |
| Page: 1 2 3 4 |
| Tissue | Expression Dynamics | Abbreviation |
| Esophagus |  | ESCC: Esophageal squamous cell carcinoma |
| HGIN: High-grade intraepithelial neoplasias | ||
| LGIN: Low-grade intraepithelial neoplasias | ||
| Oral Cavity | 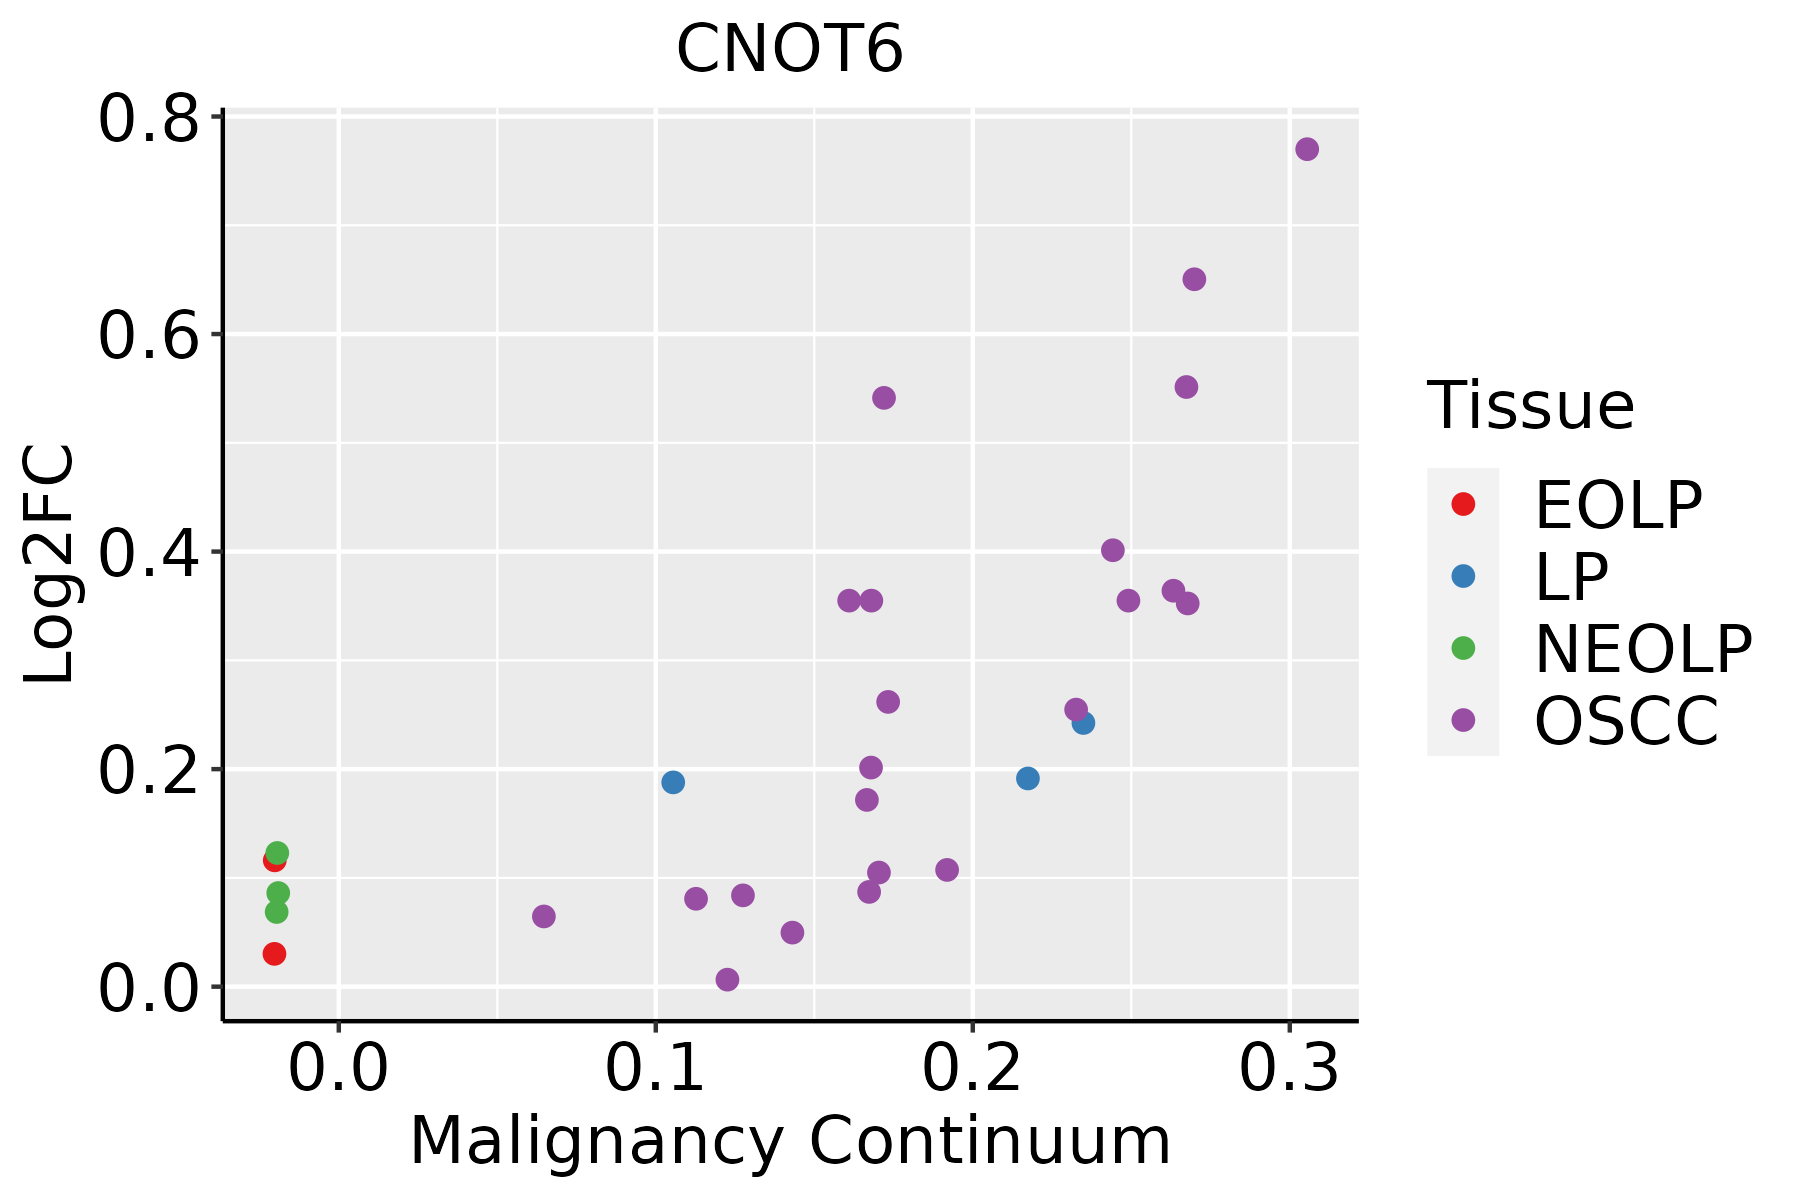 | EOLP: Erosive Oral lichen planus |
| LP: leukoplakia | ||
| NEOLP: Non-erosive oral lichen planus | ||
| OSCC: Oral squamous cell carcinoma | ||
| Thyroid | 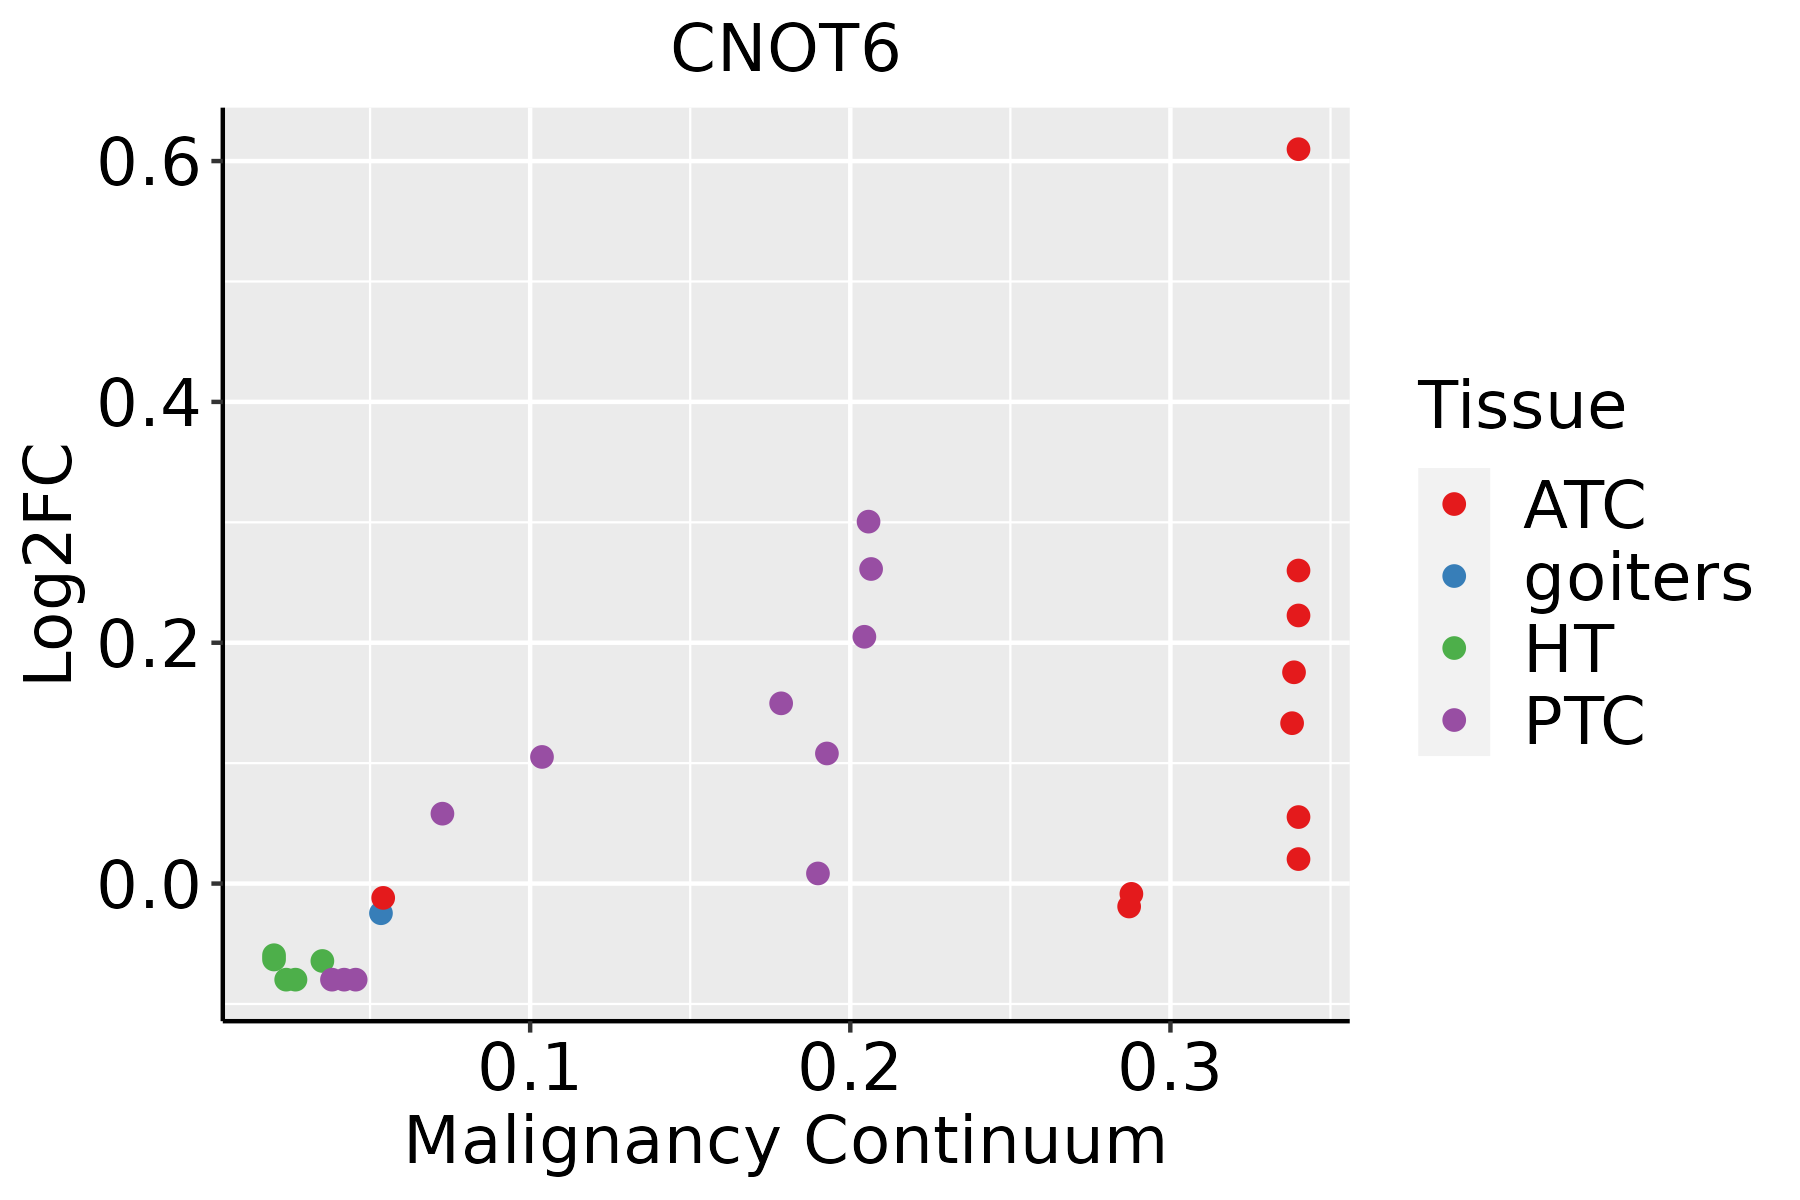 | ATC: Anaplastic thyroid cancer |
| HT: Hashimoto's thyroiditis | ||
| PTC: Papillary thyroid cancer |
| ∗log2FC in expression of this searched gene in stem-like cells from each diseased tissue sample relative to stem-like cells in normal samples in each tissue plotted against the malignancy continuum. Samples are colored based on if they are from different disease stage. |
Top |
Malignant transformation related pathway analysis |
| Find out the enriched GO biological processes and KEGG pathways involved in transition from healthy to precancer to cancer |
| Tissue | Disease Stage | Enriched GO biological Processes |
| Colorectum | AD |  |
| Colorectum | SER |  |
| Colorectum | MSS |  |
| Colorectum | MSI-H |  |
| Colorectum | FAP |  |
| ∗Top 15 enriched GO BP terms are showed in the bar plot of each disease state in each tissue. Each row represents a significant GO biological process which is colored according to the -log10(p.adjust). |
| Page: 1 2 3 4 5 6 7 8 9 |
| GO ID | Tissue | Disease Stage | Description | Gene Ratio | Bg Ratio | pvalue | p.adjust | Count |
| GO:000095615 | Prostate | Tumor | nuclear-transcribed mRNA catabolic process | 46/3246 | 112/18723 | 2.80e-09 | 1.17e-07 | 46 |
| GO:006101315 | Prostate | Tumor | regulation of mRNA catabolic process | 57/3246 | 166/18723 | 8.79e-08 | 2.39e-06 | 57 |
| GO:003465516 | Prostate | Tumor | nucleobase-containing compound catabolic process | 112/3246 | 407/18723 | 1.61e-07 | 4.02e-06 | 112 |
| GO:004348815 | Prostate | Tumor | regulation of mRNA stability | 54/3246 | 158/18723 | 2.26e-07 | 5.42e-06 | 54 |
| GO:003424912 | Prostate | Tumor | negative regulation of cellular amide metabolic process | 80/3246 | 273/18723 | 6.33e-07 | 1.32e-05 | 80 |
| GO:004670014 | Prostate | Tumor | heterocycle catabolic process | 117/3246 | 445/18723 | 1.11e-06 | 2.10e-05 | 117 |
| GO:004427015 | Prostate | Tumor | cellular nitrogen compound catabolic process | 118/3246 | 451/18723 | 1.30e-06 | 2.39e-05 | 118 |
| GO:004348715 | Prostate | Tumor | regulation of RNA stability | 54/3246 | 170/18723 | 3.00e-06 | 4.95e-05 | 54 |
| GO:190331314 | Prostate | Tumor | positive regulation of mRNA metabolic process | 41/3246 | 118/18723 | 3.86e-06 | 6.18e-05 | 41 |
| GO:001714812 | Prostate | Tumor | negative regulation of translation | 71/3246 | 245/18723 | 4.08e-06 | 6.51e-05 | 71 |
| GO:190136114 | Prostate | Tumor | organic cyclic compound catabolic process | 124/3246 | 495/18723 | 7.37e-06 | 1.10e-04 | 124 |
| GO:190211711 | Prostate | Tumor | positive regulation of organelle assembly | 27/3246 | 67/18723 | 7.76e-06 | 1.16e-04 | 27 |
| GO:001943914 | Prostate | Tumor | aromatic compound catabolic process | 118/3246 | 467/18723 | 7.92e-06 | 1.17e-04 | 118 |
| GO:006101414 | Prostate | Tumor | positive regulation of mRNA catabolic process | 30/3246 | 87/18723 | 8.61e-05 | 8.53e-04 | 30 |
| GO:006115714 | Prostate | Tumor | mRNA destabilization | 29/3246 | 84/18723 | 1.09e-04 | 1.04e-03 | 29 |
| GO:000028914 | Prostate | Tumor | nuclear-transcribed mRNA poly(A) tail shortening | 14/3246 | 29/18723 | 1.22e-04 | 1.14e-03 | 14 |
| GO:005077914 | Prostate | Tumor | RNA destabilization | 29/3246 | 88/18723 | 2.74e-04 | 2.25e-03 | 29 |
| GO:190211512 | Prostate | Tumor | regulation of organelle assembly | 51/3246 | 186/18723 | 3.87e-04 | 2.99e-03 | 51 |
| GO:003396213 | Prostate | Tumor | P-body assembly | 10/3246 | 21/18723 | 1.33e-03 | 8.31e-03 | 10 |
| GO:000028814 | Prostate | Tumor | nuclear-transcribed mRNA catabolic process, deadenylation-dependent decay | 19/3246 | 56/18723 | 2.02e-03 | 1.16e-02 | 19 |
| Page: 1 2 3 4 5 6 7 8 9 10 11 12 |
| Pathway ID | Tissue | Disease Stage | Description | Gene Ratio | Bg Ratio | pvalue | p.adjust | qvalue | Count |
| hsa0301824 | Esophagus | ESCC | RNA degradation | 62/4205 | 79/8465 | 1.18e-07 | 9.39e-07 | 4.81e-07 | 62 |
| hsa0301834 | Esophagus | ESCC | RNA degradation | 62/4205 | 79/8465 | 1.18e-07 | 9.39e-07 | 4.81e-07 | 62 |
| hsa030189 | Oral cavity | OSCC | RNA degradation | 59/3704 | 79/8465 | 2.05e-08 | 1.91e-07 | 9.70e-08 | 59 |
| hsa0301814 | Oral cavity | OSCC | RNA degradation | 59/3704 | 79/8465 | 2.05e-08 | 1.91e-07 | 9.70e-08 | 59 |
| hsa0301841 | Oral cavity | EOLP | RNA degradation | 22/1218 | 79/8465 | 1.33e-03 | 4.80e-03 | 2.83e-03 | 22 |
| hsa0301851 | Oral cavity | EOLP | RNA degradation | 22/1218 | 79/8465 | 1.33e-03 | 4.80e-03 | 2.83e-03 | 22 |
| Page: 1 |
Top |
Cell-cell communication analysis |
| Identification of potential cell-cell interactions between two cell types and their ligand-receptor pairs for different disease states |
| Ligand | Receptor | LRpair | Pathway | Tissue | Disease Stage |
| Page: 1 |
Top |
Single-cell gene regulatory network inference analysis |
| Find out the significant the regulons (TFs) and the target genes of each regulon across cell types for different disease states |
| TF | Cell Type | Tissue | Disease Stage | Target Gene | RSS | Regulon Activity |
| CNOT6 | NK | Breast | ADJ | BECN1,AC090152.1,AL137779.1, etc. | 5.00e-02 |  |
| CNOT6 | M1MAC | Breast | ADJ | BECN1,AC090152.1,AL137779.1, etc. | 2.58e-02 | |
| CNOT6 | M2MAC | Breast | DCIS | BECN1,AC090152.1,AL137779.1, etc. | 2.22e-16 |  |
| CNOT6 | MON | Breast | DCIS | BECN1,AC090152.1,AL137779.1, etc. | 0.00e+00 | |
| CNOT6 | MAST | Breast | Healthy | BECN1,AC090152.1,AL137779.1, etc. | 2.62e-02 |  |
| CNOT6 | GC | Breast | Healthy | BECN1,AC090152.1,AL137779.1, etc. | 0.00e+00 | |
| CNOT6 | TFH | Breast | Healthy | BECN1,AC090152.1,AL137779.1, etc. | 7.74e-03 | |
| CNOT6 | M2MAC | Breast | Healthy | BECN1,AC090152.1,AL137779.1, etc. | 1.30e-02 | |
| CNOT6 | pDC | Breast | Healthy | BECN1,AC090152.1,AL137779.1, etc. | 3.12e-03 | |
| CNOT6 | CD8TRM | Breast | IDC | BECN1,AC090152.1,AL137779.1, etc. | 1.15e-03 |  |
| ∗The dot plots of a searched regulon are shown for all cell subpopulations in each disease state of each tissue based on the regulon specific score inferred using pySCENIC and by calculating the average expression. |
| Page: 1 2 |
Top |
Somatic mutation of malignant transformation related genes |
| Annotation of somatic variants for genes involved in malignant transformation |
| Hugo Symbol | Variant Class | Variant Classification | dbSNP RS | HGVSc | HGVSp | HGVSp Short | SWISSPROT | BIOTYPE | SIFT | PolyPhen | Tumor Sample Barcode | Tissue | Histology | Sex | Age | Stage | Therapy Types | Drugs | Outcome |
| CNOT6 | SNV | Missense_Mutation | c.1066N>G | p.Leu356Val | p.L356V | Q9ULM6 | protein_coding | tolerated(0.48) | benign(0.148) | TCGA-AC-A23H-01 | Breast | breast invasive carcinoma | Female | >=65 | I/II | Unknown | Unknown | PD | |
| CNOT6 | SNV | Missense_Mutation | c.1172N>T | p.Ser391Phe | p.S391F | Q9ULM6 | protein_coding | deleterious(0.01) | possibly_damaging(0.555) | TCGA-AC-A23H-01 | Breast | breast invasive carcinoma | Female | >=65 | I/II | Unknown | Unknown | PD | |
| CNOT6 | SNV | Missense_Mutation | rs745926565 | c.1229N>A | p.Cys410Tyr | p.C410Y | Q9ULM6 | protein_coding | deleterious(0) | probably_damaging(1) | TCGA-AO-A128-01 | Breast | breast invasive carcinoma | Female | <65 | I/II | Chemotherapy | doxorubicin | SD |
| CNOT6 | SNV | Missense_Mutation | c.1543N>A | p.Val515Ile | p.V515I | Q9ULM6 | protein_coding | tolerated(0.19) | benign(0) | TCGA-BH-A0HA-01 | Breast | breast invasive carcinoma | Female | <65 | I/II | Unknown | Unknown | SD | |
| CNOT6 | SNV | Missense_Mutation | c.1648N>A | p.Gly550Ser | p.G550S | Q9ULM6 | protein_coding | tolerated(0.1) | probably_damaging(0.999) | TCGA-D8-A1XQ-01 | Breast | breast invasive carcinoma | Female | >=65 | I/II | Unknown | Unknown | SD | |
| CNOT6 | deletion | Frame_Shift_Del | c.661delN | p.Lys222ArgfsTer8 | p.K222Rfs*8 | Q9ULM6 | protein_coding | TCGA-EW-A1IZ-01 | Breast | breast invasive carcinoma | Female | <65 | III/IV | Chemotherapy | taxotere | SD | |||
| CNOT6 | SNV | Missense_Mutation | c.1244N>A | p.Ser415Tyr | p.S415Y | Q9ULM6 | protein_coding | deleterious(0) | probably_damaging(1) | TCGA-FU-A3HZ-01 | Cervix | cervical & endocervical cancer | Female | <65 | I/II | Chemotherapy | cisplatin | CR | |
| CNOT6 | SNV | Missense_Mutation | c.464A>C | p.Asp155Ala | p.D155A | Q9ULM6 | protein_coding | deleterious(0.02) | possibly_damaging(0.87) | TCGA-AA-3663-01 | Colorectum | colon adenocarcinoma | Male | <65 | I/II | Unknown | Unknown | SD | |
| CNOT6 | SNV | Missense_Mutation | rs867009011 | c.605N>T | p.Ala202Val | p.A202V | Q9ULM6 | protein_coding | deleterious(0) | probably_damaging(0.97) | TCGA-AA-3672-01 | Colorectum | colon adenocarcinoma | Female | >=65 | III/IV | Unknown | Unknown | SD |
| CNOT6 | SNV | Missense_Mutation | novel | c.1636N>T | p.Pro546Ser | p.P546S | Q9ULM6 | protein_coding | tolerated(0.18) | benign(0.007) | TCGA-AA-A00N-01 | Colorectum | colon adenocarcinoma | Male | >=65 | I/II | Unknown | Unknown | PD |
| Page: 1 2 3 4 5 6 |
Top |
Related drugs of malignant transformation related genes |
| Identification of chemicals and drugs interact with genes involved in malignant transfromation |
| (DGIdb 4.0) |
| Entrez ID | Symbol | Category | Interaction Types | Drug Claim Name | Drug Name | PMIDs |
| Page: 1 |

Copyright 2023-Present -The University of Texas Health Science Center at Houston |